2010 Atlantic hurricane season
| 2010 Atlantic hurricane season | |
|---|---|
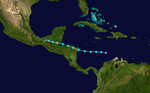
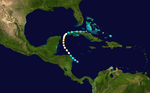
 Season summary map | |
| Seasonal boundaries | |
| First system formed | June 25, 2010 |
| Last system dissipated | November 7, 2010 |
| Strongest storm | |
| Name | Igor |
| • Maximum winds | 155 mph (250 km/h) (1-minute sustained) |
| • Lowest pressure | 924 mbar (hPa; 27.29 inHg) |
| Seasonal statistics | |
| Total depressions | 21 |
| Total storms | 19 |
| Hurricanes | 12 |
| Major hurricanes (Cat. 3+) | 5 |
| Total fatalities | 392 total |
| Total damage | $7.39 billion (2010 USD) |
| Related articles | |
The 2010 Atlantic hurricane season was the first of three consecutive very active Atlantic hurricane seasons, each with 19 named storms. This above average activity included 12 hurricanes, equaling the number that formed in 1969. Only the 2020 and 2005 seasons have had more, at 14 and 15 hurricanes respectively. Despite the high number of hurricanes, not one hurricane hit the United States making the season the only season with 10 or more hurricanes without a United States landfall. The overall tropical cyclone count in the Atlantic exceeded that in the West Pacific for only the second time on record. The season officially began on June 1 and ended on November 30, dates that conventionally delimit the period during each year when tropical cyclone formation is most likely. The first cyclone, Alex intensified into the first June hurricane since Allison in 1995. The month of September featured eight named storms. October featured five hurricanes, including Tomas, which became the latest on record in a calendar year to move through the Windward Islands. Activity was represented with an accumulated cyclone energy (ACE) value of 165 units, which was the eleventh highest value on record at the time. The activity in 2010 was heightened due to a very strong La Niña, which also led to an inactive Pacific hurricane season.
Numerous tropical cyclones affected countries bordering the Atlantic Ocean throughout 2010. Alex caused 52 deaths and up to $1.52 billion (2010 USD) in damage as it struck northern Mexico in June. The next month, Tropical Storm Bonnie struck Florida as a weak cyclone, leaving one dead. Tropical Storm Colin led to one drowning death, and rip currents produced by Tropical Depression Five killed two people. Hurricane Danielle passed east of Bermuda while Earl moved parallel to the East Coast of the United States and into Nova Scotia throughout late August, resulting in 2 and 8 deaths, respectively. In early September, Tropical Storm Hermine caused significant flooding across Texas and killed 8 people. The strongest hurricane of the year, Igor, killed four as it traversed the Atlantic and across Newfoundland. Latin America was badly hit by Hurricane Karl and Tropical Storm Matthew, with 22 and 126 deaths, respectively. In late September, Tropical Storm Nicole produced torrential rainfall from the Caribbean into the U.S. East Coast, resulting in 16 fatalities. Hurricane Paula caused a tourist to drown offshore Cozumel in mid-October, while Hurricane Richard left two dead in Belize later that month. The season concluded with Tomas which caused 35 fatalities along its track through the Caribbean and into the Atlantic.
Seasonal forecasts[]
| Source | Date | Named storms |
Hurricanes | Major hurricanes |
Ref |
| Average (1950–2005) | 10.3 | 6.2 | 2.7 | [1] | |
| Record high activity | 30 | 15 | 7† | [2] | |
| Record low activity | 4 | 2† | 0† | [2] | |
| ––––––––––––––––––––––––––––––––––––––––––––––––––––––– | |||||
| TSR | December 7, 2009 | 13.9 | 7.4 | 3.4 | [3] |
| CSU | December 9, 2009 | 11–16 | 6–8 | 3–5 | [4] |
| TWC/WSI | January 27, 2010 | 13 | 7 | 3 | [5] |
| CSU | April 7, 2010 | 15 | 8 | 4 | [6] |
| TSR | April 9, 2010 | 16.3 | 8.5 | 4 | [7] |
| TWC/WSI | April 21, 2010 | 16 | 9 | 5 | [8] |
| NCSU | April 26, 2010 | 15–18 | 8–11 | N/A | [9] |
| TSR | May 25, 2010 | 16 | 8 | 4 | [10] |
| TWC/WSI | May 26, 2010 | 18 | 10 | 5 | [11] |
| NOAA | May 27, 2010 | 14–23 | 8–14 | 3–7 | [12] |
| FSU COAPS | June 1, 2010 | 17 | 10 | N/A | [13] |
| CSU | June 2, 2010 | 18 | 10 | 5 | [14] |
| TSR | June 4, 2010 | 17.7 | 9.5 | 4.4 | [15] |
| UKMET | June 17, 2010 | 20* | N/A | N/A | [16] |
| TWC/WSI | June 23, 2010 | 20 | 11 | 5 | [17] |
| TSR | July 6, 2010 | 19.1 | 10.4 | 4.8 | [18] |
| TWC/WSI | July 21, 2010 | 19 | 11 | 5 | [19] |
| CSU | August 4, 2010 | 18 | 10 | 5 | [20] |
| TSR | August 4, 2010 | 17.8 | 9.7 | 4.5 | [21] |
| NOAA | August 5, 2010 | 14–20 | 8–12 | 4–6 | [22] |
| TWC/WSI | August 25, 2010 | 18 | 10 | 5 | [23] |
| TWC/WSI | September 22, 2010 | 18 | 10 | 6 | [24] |
| ––––––––––––––––––––––––––––––––––––––––––––––––––––––– | |||||
| Actual activity |
19 | 12 | 5 | [25] | |
| * June–November only † Most recent of several such occurrences. (See all) | |||||
Before and during each hurricane season, several forecasts of hurricane activity are issued by national meteorological services, scientific agencies, and noted hurricane experts. The forecasts include weekly and monthly changes in significant factors that help determine the number of tropical storms, hurricanes, and major hurricanes within a particular year. According to NOAA, the average Atlantic hurricane season between 1950 and 2005 contained 10.3 tropical storms, 6.2 hurricanes, 2.7 major hurricanes, and an accumulated cyclone energy (ACE) index of 66–103 units. Broadly speaking, ACE is a measure of the power of a tropical or subtropical storm multiplied by the length of time it existed. Therefore, a storm with a longer duration will have high values of ACE. It is only calculated for full advisories on specific tropical and subtropical systems reaching or exceeding wind speeds of 39 mph (63 km/h). Accordingly, tropical depressions are not included in the count. After the storm has dissipated, typically after the end of the season, the NHC re-examines the data and produces a final report on each storm. These revisions can lead to a revised ACE total either upward or downward compared to the original value.[26] The National Oceanic and Atmospheric Administration (NOAA) typically categorizes a season as either above-average, average, or below-average based on the cumulative ACE Index, but the number of tropical storms, hurricanes, and major hurricanes within a hurricane season are occasionally considered as well.[1]
Pre-season forecasts[]
On December 7, 2009, Tropical Storm Risk (TSR) issued their first extended range outlook for the 2010 Atlantic hurricane season, predicting 13.9 named storms, 7.4 hurricanes, 3.4 major hurricanes, and an ACE index of 135 units. The organization referenced two main factors, slower trade winds across the Caribbean and above-average ocean temperatures across the Atlantic, for an above-average season.[3] Two days later, Colorado State University (CSU) issued their first extended range outlook, projecting 11 to 16 named storms, 6 to 8 hurricanes, 3 to 5 major hurricanes, and an ACE index of 100 to 162 units. The organization stated that although a strong El Niño event was ongoing at the release of their forecast, a continuation of a warm El Niño–Southern Oscillation was unlikely to persist through the hurricane season.[4] On January 27, 2010, The Weather Company (formerly WSI) called for the year to feature 13 named storms, 7 hurricanes, and 3 major hurricanes.[5]
CSU issued a more detailed update on April 7, upping their forecast to 15 named storms, 8 hurricanes, 4 major hurricanes, and an ACE index of 150. More confidence in the weakening of El Niño (and thus lower vertical wind shear) and the continuation of anomalously warm sea surface temperatures across the Atlantic Ocean were cited.[6] Two days later, TSR revised their forecast upward to 16.3 named storms, 8.5 hurricanes, 4 major hurricanes, and an ACE index of 159 units.[7] In their April 21 update, WSI predicted the most active year since the record-breaking 2005 season, with 16 named storms, 9 hurricanes, and 5 major hurricanes.[8] Five days later, North Carolina State University (NCSU) released their only forecast for the season, with 15 to 18 named storms and 8 to 11 hurricanes.[9] TSR largely maintained their forecast for their May 25 release.[10] The next day, TWC/WSI again raised their forecast to 18 named storms, 10 hurricanes, and 5 major hurricanes.[11] NOAA, meanwhile, released their forecast prediction for the 2010 season on May 27. The organization called for an active to extremely active year including 14 to 23 named storms, 8 to 14 hurricanes, and 3 to 7 major hurricanes, referencing a continuation of the active era that began in 1995.[12]
Mid-season outlooks[]
On the first day of the 2010 Atlantic season, Florida State University's Center for Ocean-Atmospheric Prediction Studies (FSU COAPS) released their only predictions, forecasting 17 named storms, 10 hurricanes, and an ACE index of 156 units.[13] The next day, CSU upped their forecast to 18 named storms, 10 hurricanes, and 5 major hurricanes.[14] On June 4, TSR followed suit, with 17.7 named storms, 9.5 hurricanes, 4.4 major hurricanes, and an ACE index of 182 units.[15] The United Kingdom's Met Office (UKMET) released their only prediction for the season on June 17, with the most likely number of tropical storms being 20 and the most likely value of the ACE index being 204 units.[16] On June 23, TWC/WSI once again upped their forecast, noting 20 named storms, 11 hurricanes, and 5 major hurricanes.[17] TSR issued their boldest predictions on July 6, with 19.1 named storms, 10.4 hurricanes, 4.8 major hurricanes, and an ACE index of 203 units.[18]
Following a slightly less active June and July than originally anticipated, TWC/WSI downgraded their number of named storms from 20 to 19 on July 21, but kept their June numbers of 11 hurricanes and 5 major hurricanes untouched.[19] In their final seasonal prediction on August 4, CSU left their June numbers the same, predicting 18 named storms, 10 hurricanes, 5 major hurricanes, and an ACE index of 185 units.[20] That same day, TSR reduced their predictions for their final seasonal outlook, expecting 17.8 named storms, 9.7 hurricanes, 4.5 major hurricanes, and an ACE index of 183 units.[21] On August 5, NOAA announced the official development of La Niña in their last seasonal outlook. The organization lowered the upper bounds of their forecast compared to May due to less early season activity than expected, in all predicting 14 to 20 named storms, 8 to 12 hurricanes, and 4 to 6 major hurricanes.[22] TWC/WSI issued two final forecasts on August 25 and September 22, both expecting 18 named storms and 10 hurricanes. The number of major hurricanes was increased from 5 to 6 in their September update, however.[23][24]
Seasonal summary[]


Unlike on the eastern Pacific, which tied 1977 for the least active year in the reliable records, the 2010 Atlantic hurricane season ended as one of the most active in recorded history. It began on June 1 and ended on November 30, dates that conventionally delimit the period during each year when most tropical cyclones form in the Atlantic Ocean. The first system of the season, Hurricane Alex, developed on June 25; the final system of the season, Hurricane Tomas, dissipated on November 7. A total of 21 tropical depressions formed within the basin, of which 19 intensified into tropical storms, 12 intensified into hurricanes, and 5 further intensified into major hurricanes. The year's 12 hurricanes matched 1969 for the third highest count on record, exceeded only by 2005 and 2020.[2][27] There were more tropical storms in the Atlantic than the West Pacific in 2010, the second such occurrence on record after 2005. Throughout the entire Atlantic tropical cyclone database, 2010 is the only year with more than 10 hurricanes not to feature a hurricane landfall on the United States.[28]
Several factors contributed to exceptional activity. A strong El Niño observed in 2009 rapidly transitioned into a strong La Niña by mid-summer 2010, projecting anomalously low vertical wind shear across the Atlantic Ocean. Ocean temperatures reached record levels across the basin, averaging at 0.82 °C above the 1981–2010 average. Not only did ocean temperatures surpass 2005 to break the record overall, averaged water temperatures across the Main Development Region (MDR) of the Atlantic set monthly records from February to October 2010. This was aided by a strongly negative North Atlantic Oscillation that contributed to weaker trade winds and thus anomalous warming of ocean temperatures in the months leading up to the hurricane season. Lower sea level pressures were prevalent throughout much of the season, trailing only 1955 for the lowest average values across the MDR during the August to October period. In spite of the high number of tropical cyclones, mid-level dry air dominated the tropical Atlantic throughout the peak of the season, perhaps hindering the season from being even more active.[29]
The beginning of the Atlantic season featured Alex, the first hurricane observed in June since Hurricane Allison in 1995.[30] One tropical storm, Bonnie, and a tropical depression formed in the month of July.[31] August featured five cyclones – a tropical depression, tropical storms Colin and Fiona, as well as hurricanes Danielle and Earl (both of which further intensified into major hurricanes).[32] September, the peak period of the Atlantic hurricane season, was its most active month, featuring eight tropical cyclones: tropical storms Gaston, Hermine, Matthew, and Nicole, as well as hurricanes Igor, Julia, Karl, and Lisa. This put the season into a tie with 2002 and 2007 for the most tropical storms to develop in September, a record that stood until it was surpassed in 2020.[33] Igor attained peak winds of 155 mph (250 km/h) on September 15, cementing its status as the most intense storm of the season.[34] Well above-average activity continued into October, with the formation of hurricanes Otto, Paula, Richard, Shary, and Tomas, one hurricane short of the monthly record set in 1870.[35] Tomas persisted into the subsequent month before dissipating on November 7, heralding the end of the season's tropical cyclone activity.[36]
The season's activity was reflected with an ACE rating of approximately 165 units, the highest since 2005.[37]
Systems[]
Hurricane Alex[]
| Category 2 hurricane (SSHWS) | |
  | |
| Duration | June 25 – July 2 |
|---|---|
| Peak intensity | 110 mph (175 km/h) (1-min) 946 mbar (hPa) |
A disturbance developed within the Intertropical Convergence Zone on June 17 and remained well defined as it tracked westward. An area of low pressure developed in association with the system over the northwestern Caribbean on June 24 and further organized into a tropical depression by 18:00 UTC the following day, supported by data from a reconnaissance aircraft. Steered west and eventually west-northwest by an expansive ridge across the Bahamas and Gulf of Mexico, the depression intensified into Tropical Storm Alex at 06:00 UTC on June 26 and attained an initial peak with winds of 65 mph (105 km/h) before moving ashore near Belize City, Belize several hours later. Alex maintained tropical storm intensity as it crossed the Yucatán Peninsula, and upon executing a northward turn and a second westward turn began to steadily intensify. The cyclone intensified into the season's first hurricane at 00:00 UTC on June 30 and attained peak winds of 110 mph (175 km/h) as it made landfall near Soto la Marina, Mexico, at 02:00 UTC on July 1. Once inland, Alex turned west-southwest and rapidly weakened over the mountainous terrain of Mexico. The increasingly disrupted system dissipated at 06:00 UTC on July 2.[38]
The precursor disturbance to Alex flooded hundreds of homes and prompted the evacuation of thousands of residents in the Dominican Republic.[39] Damage to crops and hundreds of structures occurred across Central America.[40] In southern Mexico, torrential rainfall led to numerous landslides and mudslides, while swollen rivers flooded many homes and roads were collapsed.[41] Near the track of Alex in northern Mexico, rainfall reached as high as 35.04 in (890 mm) in Monterrey,[42] 13-foot (4.0 m) waves affected the coastline,[43] hundreds of thousands of citizens lost power,[44] and widespread infrastructure was damaged or destroyed.[45] Although the hurricane did not directly move ashore the coastline of the United States, its spiral bands produced tropical storm-force sustained winds across the southern reaches of Texas, peaking at 51 mph (82 km/h) in Port Isabel.[46] Heavy rainfall broke accumulation records,[42] a storm surge of at least 3.5 ft (1.1 m) caused beach erosion,[47] and embedded supercells produced nine tornadoes (all rated EF0).[38] Along its track, Alex was responsible for 51 deaths (22 missing) and $1.52 billion in damage.[48]
Tropical Depression Two[]
| Tropical depression (SSHWS) | |
  | |
| Duration | July 8 – July 9 |
|---|---|
| Peak intensity | 35 mph (55 km/h) (1-min) 1005 mbar (hPa) |
A tropical wave emerged off the western coast of Africa on June 24, eventually emerging into the Gulf of Mexico on July 7. An area of low pressure became discernible, and with data from a reconnaissance aircraft, the system was upgraded to a tropical depression by 00:00 UTC on July 8. The depression failed to organize appreciably as it tracked west to west-northwest, moving ashore South Padre Island, Texas with winds of 35 mph (55 km/h) by 14:00 UTC that day. The depression degenerated into a remnant low by 06:00 UTC on July 9 and dissipated over northern Mexico a day later.[49]
In advance of landfall, the NHC issued a tropical storm warning from Baffin Bay, Texas to Rio San Fernando, Mexico; this was canceled once the storm failed to intensify.[49] The Servicio Meteorológico Nacional warned residents of gusty winds and heavy rainfall in excess of 4–8 in (100–200 mm) capable of producing localized flooding and mudslides.[50] Upon moving ashore, the depression produced a storm surge of 2–4 ft (0.6–1.2 m) along the southern coastline of Texas.[51] Rainfall accumulations peaked at 5.16 in (131 mm) along the Guadalupe River, with lesser amounts elsewhere, including across areas affected by Hurricane Alex a week prior.[42][52]
Tropical Storm Bonnie[]
| Tropical storm (SSHWS) | |
  | |
| Duration | July 22 – July 24 |
|---|---|
| Peak intensity | 45 mph (75 km/h) (1-min) 1005 mbar (hPa) |
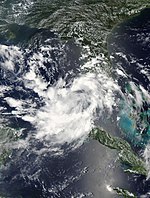
A tropical wave emerged off the western coast of Africa on July 10. Once north of the Greater Antilles, convective growth and the development of a well-defined surface low led to the formation of a tropical depression just south of Acklins Island by 06:00 UTC on July 22. Amid a brief reprieve in strong upper-level winds, the depression intensified into Tropical Storm Bonnie as it crossed Ragged Island around 23:15 UTC that day. It later traversed Andros Island at peak intensity, with sustained winds of 45 mph (70 km/h), and weakened slightly before moving ashore near Elliott Key, Florida, with winds of 40 mph (65 km/h) on July 23. Bonnie weakened to a tropical depression as it crossed South Florida, and the persistent effects of strong wind shear prevented intensification in the Gulf of Mexico. The cyclone degenerated into a remnant low by 00:00 UTC on July 25 and later moved into southeastern Louisiana before dissipating later that day.[53]
The precursor disturbance to Bonnie produced rainfall up to 4 in (100 mm) in the Dominican Republic, isolating towns due to bridge collapses and prompting the evacuation of thousands of residents. In nearby Puerto Rico, one person drowned in a swollen river.[54] Upon designation, tropical storm watches and warnings were issued along portions of the Florida coastline.[53] Approximately 14,000 Florida customers lost power as Bonnie moved ashore. Minimal tropical storm-force winds affected Virginia Key, where a storm surge of 0.92 ft (0.29 m) was also reported, and rainfall up to 3.25 in (82.6 mm) across Miami-Dade County caused urban flooding.[55] Despite degenerating into a remnant low, Bonnie produced more substantial rainfall totals across Louisiana and Mississippi, officially peaking at 5.75 in (146 mm) in Tylertown.[56] Radar estimates of 8–9 in (203–229 mm) of rain prompted flash flooding which washed out more than 20 roads and bridges in Washington Parish,[57] while about 110 homes were flooded in West Baton Rouge Parish.[58] Remnant moisture combined with a cold front to produce damaging severe thunderstorms across portions of the Southeast in late July.[59]
Tropical Storm Colin[]
| Tropical storm (SSHWS) | |
  | |
| Duration | August 2 – August 8 |
|---|---|
| Peak intensity | 60 mph (95 km/h) (1-min) 1005 mbar (hPa) |
The interaction of two tropical waves and an upper-level trough led to the development of a tropical depression over the central Atlantic by 12:00 UTC on August 2. The depression steadily organized after formation, intensifying into Tropical Storm Colin by 06:00 UTC on August 3. An abnormally strong ridge to the storm's north steered Colin to the west-northwest; reaching a forward speed up to 30 mph (50 km/h), the system was unable to maintain a closed circulation and instead degenerated into a trough by 18:00 UTC that day. Over the coming days, the trough decelerated and recurved north into a weakness in the ridge while still producing tropical storm-force winds. Satellite imagery showed the reformation of a well-defined circulation by 12:00 UTC on August 5, and the system was once again classified as Tropical Storm Colin. After attaining peak winds of 60 mph (95 km/h), an approaching trough sheared the cyclone and turned it northeast. Colin weakened to a tropical depression by 00:00 UTC on August 8 and degenerated into a trough for a second time twelve hours later; the trough dissipated early on August 9.[60]
A tropical storm warning was raised for Bermuda as Colin approached but was later discontinued as it weakened.[60] Average winds of 31 mph (50 km/h) were observed across the island, although peak winds fell just shy of tropical storm intensity at 37 mph (60 km/h). L.F. Wade International Airport received 0.16 in (4.06 mm) of rainfall.[61] Although Colin steered well clear of the Carolinas, swells from the storm prompted at least 205 water rescues,[62] and a rip current off Ocracoke led to the drowning of one man.[63]
Tropical Depression Five[]
| Tropical depression (SSHWS) | |
  | |
| Duration | August 10 – August 11 |
|---|---|
| Peak intensity | 35 mph (55 km/h) (1-min) 1008 mbar (hPa) |
A non-tropical area of low pressure, first noted over the Gulf Stream on August 7, entered the southeastern Gulf of Mexico and organized into a tropical depression about 120 mi (195 km) west of Fort Myers, Florida, by 18:00 UTC on August 10. As the newly formed cyclone moved west-northwest, a nearby upper-level low imparted high wind shear and dry air entrainment, and the depression degenerated into a remnant low twelve hours later without attaining tropical storm intensity. Upon degeneration, the low moved into the Gulf Coast of the United States and conducted a clockwise loop.[64] It emerged into the Gulf of Mexico again on August 16, where the disturbance nearly regenerated into a tropical cyclone before making a second landfall in Mississippi the next day.[65] The remnants dissipated over the southeastern portion of the state on August 18.[64]
The tropical depression produced waves up to 3 ft (0.9 m) around Anna Maria Island, where two people died of fatigue-related heart attacks after being caught in a rip current.[66] Heavy rainfall in the New Orleans, Louisiana and Mobile, Alabama areas—aided by instability from the remnants of the depression—flooded streets, inundating an apartment complex in the former city and cutting power to 1,921 customers in the latter city.[67][68] Forty homes and businesses were flooded in Avoyelles Parish.[69] Rainfall accumulations peaked south of Natchez, Mississippi, where 13.9 in (353 mm) was documented.[70]
Hurricane Danielle[]
| Category 4 hurricane (SSHWS) | |
  | |
| Duration | August 21 – August 30 |
|---|---|
| Peak intensity | 130 mph (215 km/h) (1-min) 942 mbar (hPa) |
The interaction of a vigorous tropical wave and a disturbance within the Intertropical Convergence Zone led to the formation of a tropical depression about 520 mi (835 km) west-southwest of Cabo Verde by 18:00 UTC on August 21. Steered by a ridge to its north, the depression steadily organized as it moved west-northwest, intensifying into Tropical Storm Danielle by 06:00 UTC on August 22 and attaining hurricane intensity the following day. Influenced by moderate wind shear initially, Danielle maintained its status as a minimal hurricane for several days. Early on August 26, however, a more conducive environment led to rapid intensification, and by 18:00 UTC the next day, the storm attained its peak intensity as a Category 4 hurricane with winds of 130 mph (210 km/h). Danielle began to round the western periphery of the steering ridge after peak intensity, curving northeast as it began an eyewall replacement cycle. The inner core change, combined with progressively cooler waters, resulted in the system weakening to a tropical storm by 18:00 UTC on August 30 and degenerating into a remnant low six hours later. The low became extratropical on August 31 maintained distinct until dissipating well east-southeast of Greenland on September 3.[71]
A tropical storm watch was issued for Bermuda on August 27 but swiftly canceled the next day as Danielle steered well clear of the island.[71] Swells from the powerful hurricane reached the East Coast of the United States, leading to the rescues of 250 people in Ocean City, Maryland and an additional 70 people off the coast of Central Florida. The body of a man—whose death appeared to have been from drowning—was pulled from the waters of Satellite Beach, Florida; a second man went missing in Ocean City, but his body was never recovered and the search was eventually called off.[72] Researchers examining the wreckage of RMS Titanic were forced to seek refuge in St. John's, Newfoundland;[73] swells as large as 10 ft (3 m) impacted the coastline of Newfoundland.[74]
Hurricane Earl[]
| Category 4 hurricane (SSHWS) | |
  | |
| Duration | August 25 – September 4 |
|---|---|
| Peak intensity | 145 mph (230 km/h) (1-min) 927 mbar (hPa) |
A vigorous tropical wave entered the Atlantic on August 23, developing into a tropical depression off the western coast of Africa two days later at 06:00 UTC. The nascent depression steadily intensified as it moved west-northwest, becoming Tropical Storm Earl six hours after formation and further strengthening into a hurricane by 12:00 UTC on August 29. A weakness in the steering ridge, created by leading Hurricane Danielle, caused Earl to narrowly miss the northern Leeward Islands as it strengthened into a Category 4 hurricane on August 30. Intensification was temporarily stunted as the cyclone underwent an eyewall replacement cycle, but Earl ultimately attained peak winds of 145 mph (235 km/h) by 06:00 UTC on September 2. Increased shear and a second replacement cycle caused the hurricane to rapidly weaken thereafter. It weakened to a tropical storm by 00:00 UTC on September 4, and although the system briefly re-attained hurricane intensity as it moved ashore near Liverpool, Nova Scotia, Earl transitioned into an extratropical cyclone twelve hours later. The extratropical low merged with another system over the Labrador Sea the next day.[75]
Severe impacts from Earl in Antigua and Barbuda amounted to EC $34 million ($12.6 million USD).[76] One person was electrocuted trying to restore power.[77] Wind gusts neared or surpassed hurricane force across Guadeloupe and the French islands, peaking at 105 mph (170 km/h) in Gustavia.[78] Approximately 7,500 residents were left without power across Saint Martin, Saint Barthélemy, and Guadeloupe.[79] Heavy rainfall and strong wind gusts battered Saint Kitts and Nevis, leaving streets flooded and many residences without power.[80] In the British Virgin Islands, wind gusts up to 88 mph (142 km/h) damaged or destroyed dozens of structures, resulting in up to $7 million in damage.[81] Substantial effects were also observed in the U.S. Virgin Islands, where total infrastructure losses were placed at $2.5 million and revenue losses from deterred vacationers reached $10.7 million.[82][83] Flooding and downed power lines in Puerto Rico left 187,000 residents without power and an additional 60,000 without water access.[84] As Earl paralleled the East Coast of the United States, it produced varying degrees of impact; North Carolina was hardest hit, with over $3.5 million in damage.[75] Three people were killed in rough seas off Florida,[75][85][86] one person was killed by rough seas off Maine,[75] and two people were killed by rip currents off New Jersey.[75] Approximately 940,000 people were left without power across Nova Scotia and surrounding areas, where one death occurred.[75][87]
Tropical Storm Fiona[]
| Tropical storm (SSHWS) | |
  | |
| Duration | August 30 – September 3 |
|---|---|
| Peak intensity | 65 mph (100 km/h) (1-min) 998 mbar (hPa) |
A large and convective tropical wave moved off the western coast of Africa in late August, developing into a tropical depression by 12:00 UTC on August 30 about 1,035 mi (1,665 km) east of the Lesser Antilles. Satellite imagery and data from a research aircraft indicated the depression intensified into Tropical Storm Fiona six hours later. Directed by an expansive mid-level ridge to its north, the cyclone moved west-northwest for several days, attaining peak winds of 65 mph (105 km/h) by 18:00 UTC on September 1 as it passed close to the northern Leeward Islands. Fiona's position between the mid-level ridge and the large circulation of Hurricane Earl off The Carolinas turned the storm northwest and then north as it encountered increasingly strong wind shear and began to weaken. Expansive outflow from Earl caused Fiona's low-level circulation to become dislocated from its convection, and the system degenerated into a remnant low by 00:00 UTC on September 4.[88] The remnant low passed near Bermuda, producing light winds and about 0.78 in (19.8 mm) of rainfall,[89] before dissipating the next day.[88]
Tropical Storm Gaston[]
| Tropical storm (SSHWS) | |
  | |
| Duration | September 1 – September 2 |
|---|---|
| Peak intensity | 40 mph (65 km/h) (1-min) 1005 mbar (hPa) |
A strong tropical wave organized into a tropical depression by 06:00 UTC on September 1 about 920 mi (1,480 km) west-southwest of Cabo Verde. With a burst of convection near its center, the depression was upgraded to Tropical Storm Gaston six hours later and reached peak winds of 40 mph (65 km/h).[90] Despite initial projections that Gaston would become an increasingly strong hurricane over the central Atlantic,[91] exceptionally dry air began to wrap in the storm after peak. It weakened to a tropical depression by 00:00 UTC on September 2 and further degenerated into a remnant low by 18:00 UTC that day. The system nearly regenerated into a tropical cyclone the following day as shallow convection wrapped into the center, but the increased organization was transient and it ultimately remained a remnant low until dissipating southeast on the Dominican Republic on September 8.[90] The remnants of Gaston produced sporadic rainfall across Puerto Rico, peaking at 3.03 in (76.9 mm) in Naguabo.[92]
Tropical Storm Hermine[]
| Tropical storm (SSHWS) | |
  | |
| Duration | September 5 – September 9 |
|---|---|
| Peak intensity | 70 mph (110 km/h) (1-min) 989 mbar (hPa) |
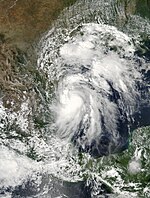
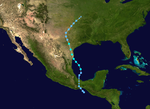
The East Pacific's Tropical Depression Eleven-E moved across Mexico and degenerated into a remnant low on September 4. Its low and mid-level circulations survived crossing Mexico and entered the southern Bay of Campeche, reforming as a tropical depression by 18:00 UTC on September 5. Steered north to north-northwest, the cyclone quickly strengthened as deep convection fired over its center; it intensified into Tropical Storm Hermine by 06:00 UTC on September 6 and attained peak winds of 70 mph (115 km/h) by 02:00 UTC the following day as it made landfall near Matamoros, Mexico.[93] Despite being well inland, Hermine continued to maintain an inner core and only slowly weakened.[94] It fell to tropical depression status over central Texas by 00:00 UTC on September 8 and ultimately dissipated over southeastern Kansas by 06:00 UTC on September 10.[93]
Tropical storm-force winds affected mainly coastal sections of northern Mexico; Matamoros recorded peak sustained winds of 53 mph (85 km/h) with gusts to 67 mph (108 km/h). Dozens of structures were damaged, trees and power lines were downed, and many residents were left without power.[95] Impact was more significant across the United States—most notably in Texas—where 283 homes sustained minor damage, 231 homes sustained major damage, and 68 homes were destroyed.[96] Torrential rainfall, peaking at 16.37 in (415.8 mm) in Georgetown,[97] forced more than 100 high water rescues.[98] In Oklahoma, flash flooding resulted in severe infrastructure damage.[99] Several tornadoes touched down in both states.[93] Seven people were killed in Texas and one in Oklahoma,[100] while the total damage total reached $240 million.[93]
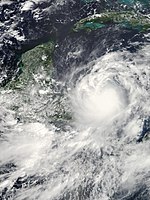
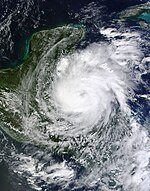
Hurricane Igor[]
| Category 4 hurricane (SSHWS) | |
  | |
| Duration | September 8 – September 21 |
|---|---|
| Peak intensity | 155 mph (250 km/h) (1-min) 924 mbar (hPa) |
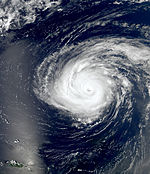
The most intense hurricane of the season began as a tropical wave that organized into a tropical depression southeast of Cabo Verde early on September 8. Initial organization was fast-paced, and the depression intensified into Tropical Storm Igor six hours after formation. Igor moved west to west-northwest for several days while embedded within the monsoon trough. Increased vertical shear caused the cyclone to temporarily weaken to a tropical depression by 12:00 UTC on September 9, but it re-attained tropical storm intensity the next day and further strengthened to a hurricane by 00:00 UTC on September 12. After rapid intensification and a subsequent eyewall replacement cycle, Igor attained its peak with maximum sustained winds of 155 mph (250 km/h) by 00:00 UTC on September 15. Inner core changes continued after peak, and Igor continued as a Category 4 hurricane for several days until increased shear and dry air entrainment forced a consistent weakening trend early on September 17. The system recurved north-northeast while passing within 60 mi (95 km) of Bermuda as a minimal hurricane. It eventually made landfall near Cape Race, Newfoundland with winds of 85 mph (135 km/h) by 15:00 UTC on September 21 and transitioned into an extratropical cyclone three hours later. The extratropical low was absorbed by a larger such system between Greenland and Labrador on September 23.[34]
Although Igor steered well clear of the Caribbean, large swells of 15–20 ft (4.6–6.1 m) propagated from the storm, drowning one person in St. Croix and another in Puerto Rico.[34] Large waves affected the East Coast of the United States, and one person drowned in Surf City, North Carolina.[101] In Bermuda, sustained winds of 91 mph (146 km/h) and gusts up to 117 mph (188 km/h) downed trees and power lines, cutting power to approximately 28,000 residents. Rainfall was largely insignificant, peaking at 3.19 in (81 mm).[34] Impacts near the storm's landfall in Newfoundland were more severe. Rainfall amounts of more than 2 in (50 mm) were widespread, with a peak of 9.37 in (238 mm) in St Lawrence; as such, Igor ranks as the third wettest tropical cyclone to impact Atlantic Canada.[102] Run-off from the torrential rainfall damaged or destroyed structures, killed a man when his driveway was washed out and he was swept away, and isolated approximately 150 communities.[103] Sustained winds of 80 mph (130 km/h) with gusts to 107 mph (172 km/h) in Cape Pine downed trees and power lines while damaging or destroying many homes.[103] Approximately 50,000 households lost power during the peak of the storm.[104] The overall damage total reached $200 million across Newfoundland, making Igor the costliest hurricane on record there.[34] It was regarded as the worst storm of tropical origin to hit Newfoundland since 1935.[105]
Hurricane Julia[]
| Category 4 hurricane (SSHWS) | |
  | |
| Duration | September 12 – September 20 |
|---|---|
| Peak intensity | 140 mph (220 km/h) (1-min) 948 mbar (hPa) |
A vigorous tropical wave moved off the western coast of Africa on September 11 and almost immediately led to the formation of a tropical depression by 06:00 UTC the next day. Steered in a traditional west-northwest fashion, the depression intensified into Tropical Storm Julia twelve hours later and continued steady strengthening to become a hurricane by 12:00 UTC September 14.[106] As a reminder of limited hurricane intensity forecasting skill,[107] the system began a period of rapid intensification thereafter, attaining peak winds of 140 mph (225 km/h) by 12:00 UTC on September 15. Julia became the easternmost Category 4 hurricane on record in the Atlantic as a result. After peak, the system recurved around a ridge while simultaneously weakening under influence of Hurricane Igor's outflow. It fell back to tropical storm intensity by 00:00 UTC on September 18 and degenerated into a remnant low by 18:00 UTC on September 20 while located about 1,095 mi (1,760 km) west of the Azores. The remnant low turned back west, dissipating late on September 24.[106]
The Government of Cabo Verde issued a tropical storm warning for the island chain as Julia approached.[106] Gusts of 24–30 mph (38–48 km/h) damaged maize crops, and waves of 9.8–14.8 ft (3.0–4.5 m) affected the coastline. Landslides isolated the community of Covão Grande.[108] Rainfall was insignificant, peaking at 0.39 in (9.91 mm) in Sal.[109][110]
Hurricane Karl[]
| Category 3 hurricane (SSHWS) | |
  | |
| Duration | September 14 – September 18 |
|---|---|
| Peak intensity | 125 mph (205 km/h) (1-min) 956 mbar (hPa) |
The interaction of a tropical wave and another elongated trough led to the development of a tropical depression by 12:00 UTC on September 14 about 375 mi (605 km) east of Chetumal, Mexico. The depression intensified into Tropical Storm Karl six hours later and continued to strengthen until moving ashore near Rio Huach, Mexico, with winds of 65 mph (105 km/h) at 12:45 UTC on September 15. Although the storm's winds diminished over land, the structure of the storm actually improved, allowing Karl to quickly become a hurricane by 18:00 UTC on September 16 once emerging over the Bay of Campeche. A period of rapid deepening brought the cyclone to its peak of 125 mph (200 km/h) early on September 17, the only major hurricane on record in the Bay of Campeche. Increasing shear and dry air entrainment caused Karl to weaken slightly, but it retained winds of 115 mph (185 km/h) while making landfall just north of Veracruz, Mexico by 16:45 UTC on September 17. The system weakened rapidly over the mountainous terrain of Mexico, falling to tropical storm intensity by 00:00 UTC on September 18, weakening to a tropical depression six hours later, and dissipating about 85 mi (135 km) southeast of Veracruz by 12:00 UTC.[111]
Throughout Quintana Roo, heavy rains from Karl resulted in scattered flooding which forced hundreds of families from their homes.[112] More than 600 houses were destroyed in the city of Chetumal as a result of flooding and landslides.[113] At the height of the storm, a total of 54,265 residents were without power; however, most had their electricity restored within a day.[114] Thousands of hectares of crops were lost.[115] Upon making landfall in Veracruz, Karl caused widespread heavy rainfall, peaking at 17.83 in (452.9 mm) in Misantla, Mexico.[116] Strong winds uprooted hundreds of thousands of trees and downed power lines, leaving up to 280,000 residents in the dark.[117] More than 200,000 homes were damaged or destroyed across the states of Veracruz, Tabasco, and Oaxaca.[113] A total of 22 people were killed by the storm, and the damage cost totaled to approximately $3.9 billion.[111][113]
Hurricane Lisa[]
| Category 1 hurricane (SSHWS) | |
  | |
| Duration | September 20 – September 26 |
|---|---|
| Peak intensity | 85 mph (140 km/h) (1-min) 982 mbar (hPa) |
Following a sequence of Cape Verde hurricanes, another tropical wave moved off the coast of Africa on September 16. A broad area of low pressure developed in association with the wave as it passed southwest of Cape Verde. By 18:00 UTC on September 20, the wave developed into a tropical depression about 460 mi (740 km) southwest of Cape Verde. An unusually weak subtropical ridge steered the system north, east, and then north again over subsequent days. The depression intensified into Tropical Storm Lisa six hours after formation, but fell back to tropical depression intensity by 18:00 UTC on September 22 as dry air entered the circulation. A more favorable environment allowed Lisa to re-attain tropical storm status by 12:00 UTC the following day and subsequently begin a period of rapid intensification. The small cyclone reached hurricane intensity by 21:00 UTC on September 24 and attained peak winds of 85 mph (135 km/h) six hours later. Progressively cooler waters and stronger shear caused Lisa to weaken to a tropical storm early on September 25, weaken to a tropical depression early on September 26, and degenerate into a remnant low at 18:00 UTC that day. The remnant low moved northwest and north, dissipating by 06:00 UTC on September 29 about 595 mi (960 km) south-southwest of the Azores.[118]
Tropical Storm Matthew[]
| Tropical storm (SSHWS) | |
  | |
| Duration | September 23 – September 26 |
|---|---|
| Peak intensity | 60 mph (95 km/h) (1-min) 998 mbar (hPa) |
The same tropical wave that led to the formation of Julia moved off the western coast of Africa on September 11, leading to the development of a tropical depression by 12:00 UTC on September 23 about 565 mi (910 km) east of Cabo Gracias a Dios. Steered west to west-northwest by a subtropical ridge to its north, the depression steadily organized, intensifying into Tropical Storm Matthew six hours after formation and attaining peak winds of 60 mph (95 km/h) by 18:00 UTC on September 23, an intensity it maintained while making just south of Cabo Gracias a Dios an hour later. The system briefly emerged into the Gulf of Honduras on September 25 before making a second landfall north-northeast of Monkey River Town, Belize, with winds of 40 mph (65 km/h) around 15:00 UTC. The system weakened quickly once inland, falling to a tropical depression by 18:00 UTC and degenerating into a remnant low by 12:00 UTC on September 26. The remnant low turned southwest and dissipated twelve hours later.[119]
The precursor wave to Matthew produced heavy rainfall across portions of Venezuela, destroying several homes and leading to eight fatalities.[120] Impacts extended across Central America, especially in Nicaragua where 70 people were killed. Bridges were collapsed, roads were destroyed, communication lines were downed, and up to 255 communities were affected by the storm there.[121] Similar but less severe damage was observed in Honduras, where four people were killed, and in El Salvador, where one person died.[122] Widespread rainfall totals of 10 in (250 mm) were recorded across Veracruz, peaking at 16.73 in (424.9 mm) in Acayucan.[123] The combined impacts of Hurricane Karl and Tropical Storm Matthew in the state cost up to $8 billion.[124] Flooding from Matthew further inland in Mexico, which was already observing one of its wettest years on record, led to a landslide in Santa María Tlahuitoltepec that killed seven people.[125]
Tropical Storm Nicole[]
| Tropical storm (SSHWS) | |
  | |
| Duration | September 28 – September 29 |
|---|---|
| Peak intensity | 45 mph (75 km/h) (1-min) 995 mbar (hPa) |
The remnants of Matthew combined with a broad area of low pressure over the northwestern Caribbean to form Tropical Storm Nicole by 12:00 UTC on September 28, about 75 mi (120 km) south of the Isle of Youth, Cuba. Affected by strong westerly shear, Nicole never inherited a traditional appearance on satellite imagery; instead, it was characterized by an ill-defined circulation west of most convection, with the strongest winds well displaced from the center. The cyclone attained peak winds of 45 mph (70 km/h) shortly after formation, but its center of circulation became increasingly diffuse as Nicole tracked toward the Cuba coastline, leading to degeneration into a remnant low by 15:00 UTC on September 29. The low moved north-northeast into the Bahamas, where it became extratropical and quickly weakened to a trough on September 30.[126]
Nicole produced a tremendous amount of rain in Jamaica, totaling to 37.42 in (950.5 mm) in Belleisle.[126] Severe flooding and landslides affected up to 507,831 residents, resulting 16 deaths and 42 injuries.[127] Flooded roadways isolated communities, trapping hundreds of people in their homes.[128] Over 288,000 residences lost power, over 40 percent of the island's water supply systems were inoperable at one point, and dozens of bridges collapsed.[129] Infrastructure damage totaled to $235.4 million,[130] while property damage reached $3.2 million and agricultural damage amounted to $6.8 million.[127] In nearby Cuba, rainfall reached 9.22 in (234 mm) and winds gusted to 53 mph (85 km/h);[126] houses were flooded, crops were damaged, and livestock was killed as a result.[131] Similar impacts occurred across the Cayman Islands, with sporadic power outages, flooding in low-lying locations, and damaged houses.[132] While the remnants of Nicole produced only minor impacts across Florida, mainly in the form of street flooding,[126] impacts were much more severe across the Mid-Atlantic as the system combined with a large area of low pressure across the region.[133] Record-breaking rainfall, accumulating to 22.54 in (572.5 mm) in Wilmington, North Carolina, closed over 150 roadways, knocked out power, and caused traffic accidents.[134]
Hurricane Otto[]
| Category 1 hurricane (SSHWS) | |
  | |
| Duration | October 6 – October 10 |
|---|---|
| Peak intensity | 85 mph (140 km/h) (1-min) 976 mbar (hPa) |
A tropical wave departed the western coast of Africa on September 26, becoming entangled with an upper-level trough to form a subtropical depression by 06:00 UTC on October 6, about 265 mi (425 km) north-northwest of San Juan, Puerto Rico. The depression recurved sharply northeast and quickly strengthened into Subtropical Storm Otto six hours after formation. On October 7, Otto completed transition into a fully tropical cyclone as deep convection formed over its center, despite weakening during the process. The system further intensified into a hurricane by 12:00 UTC on October 8 and attained peak winds of 85 mph (135 km/h) twelve hours later. An abrupt increase in wind shear caused Otto to weaken as it accelerated northeast; it fell to tropical storm intensity by 00:00 UTC on October 10 and transitioned into an extratropical cyclone six hours later while positioned about 1,035 mi (1,665 km) east-northeast of Bermuda. The extratropical cyclone persisted for several days, eventually becoming a non-convective swirl early on October 14 and dissipating by 00:00 UTC on October 18.[135]
Otto and its precursor disturbance brought several days of rainfall and gusty winds to the Greater Antilles. In St. Lucia, 400 houses were severely flooded or destroyed, access to water was cut off, and power outages were observed.[136] Storm impacts in Saint Kitts and Nevis flooded homes, caused minor beach erosion, topped bridges, washed out roads, and caused severe disruption to electrical services.[137] Throughout the U.S. Virgin Islands, monthly rainfall records were shattered, with 21.52 in (546.6 mm) in Red Hook.[138] Flooding and landslides on surrounding islands closed roads and highways.[139] Across the British Virgin Islands, the worst flooding in the nation's history—with precipitation amounts up to 24.98 in (634.5 mm)—overturned cars, damaged drainage pipes and utility lines, and left residents without water.[140] Widespread flooding across Puerto Rico affected at least 295 roads, including at least 14 that were severely damaged, and impacted crops.[141] Landslides and downed utility poles isolated communities, waters supplies were contaminated, and numerous people required rescuing.[142][143]
Hurricane Paula[]
| Category 2 hurricane (SSHWS) | |
  | |
| Duration | October 11 – October 15 |
|---|---|
| Peak intensity | 105 mph (165 km/h) (1-min) 981 mbar (hPa) |
The complex interaction between a cold front, multiple tropical waves, and a broad area of low pressure in the wake of Nicole led to the formation of a tropical depression by 00:00 UTC on October 11 about 115 mi (185 km) southeast of Cabo Gracias a Dios. The nascent cyclone intensified into Tropical Storm Paula six hours later, briefly moving ashore the northeastern tip of Honduras early on October 11 before re-emerging into the northwestern Caribbean. Amid a favorable environment, Paula intensified into a hurricane by 00:00 UTC on October 12 and attained peak winds of 105 mph (170 km/h) at 18:00 UTC while maintaining an unusually small size. An increase in shear prompted a steady weakening trend as the system turned north and then east. Paula fell to tropical storm intensity early on October 14, making landfall between Santa Lucia and Puerto Esperanza with winds of 65 mph (105 km/h). The system further weakened to a tropical depression early on October 15 and degenerated into a remnant low by 12:00 UTC. The remnant low quickly became diffuse, dissipating at 18:00 UTC.[144]
In northeastern Honduras, low-lying areas were evacuated and numerous homes were destroyed.[145] Rainfall peaked at 7.9 in (200 mm), resulting in widespread flooding.[146] Waves up to 7 ft (2.1 m) affected the coastline.[147] An American tourist drowned off Cozumel after succumbing to rough seas.[144] Only very minor impacts were observed along the northeastern coastline of the Yucatán Peninsula.[148] The outer bands of Paula affected Cuba, where rainfall peaked at 7.32 in (186 mm) and winds reached 68 mph (109 km/h).[144][149] The strong winds downed many trees, blocking roadways, and damaged the roofs of several homes. The rain, however, was regarded as generally beneficial to crops and low reservoirs. Rough seas removed concrete from Havana's sea wall and submerged coastal streets under 1–2 ft (0.3–0.61 m) of water.[150]
Hurricane Richard[]
| Category 2 hurricane (SSHWS) | |
  | |
| Duration | October 20 – October 25 |
|---|---|
| Peak intensity | 100 mph (155 km/h) (1-min) 977 mbar (hPa) |
An area of disturbed weather within a persistent, broad trough across the southwestern Caribbean organized into the nineteenth tropical depression of the season by 06:00 UTC on October 20 about 195 mi (315 km) north of Cabo Gracias a Dios. The depression was slow to organize at first, affected by dry air and moderate shear from a trough over the Southeast United States and western Atlantic, but eventually strengthened into Tropical Storm Richard by 12:00 UTC on October 21 as it curved south and then west. Upper-level winds slackened over subsequent days, allowing the cyclone to attain hurricane intensity early on October 24 and reach peak winds of 100 mph (160 km/h) by 00:00 UTC the next day. Richard moved ashore near Gales Point, Belize, thirty minutes later. The system weakened rapidly once inland, degenerating into a remnant low by 00:00 UTC on October 26. Despite emerging over the Bay of Campeche, high wind shear prevented redevelopment and instead caused the feature to dissipate eighteen hours later.[151]
Although Richard tracked north of Honduras, strong winds along the coastline downed trees and power lines. Mudslides stranded up to 15,000 people across 40 different towns. The island of Roatán received a gust of 58 mph (93 km/h).[152] Farther north and west in Belize, the Belize Zoo and Tropical Education Center—popular attractions for tourists—were heavily damaged.[153] About 80% of the grapefruit and nearly 25% of the orange crop were lost there. Two deaths were observed: one man was killed when his boat capsized in rough seas, while a second man was mauled to death by a jaguar that escaped after a tree mangled its cage. The damage cost topped $80 million.[151]
Hurricane Shary[]
| Category 1 hurricane (SSHWS) | |
  | |
| Duration | October 28 – October 30 |
|---|---|
| Peak intensity | 75 mph (120 km/h) (1-min) 989 mbar (hPa) |
A broad area of low pressure formed at the tail-end of a stationary front, organizing into a tropical depression by 18:00 UTC on October 28 about 520 mi (835 km) south-southeast of Bermuda. Steered west-northwest and then sharply northeast ahead of an approaching cold front, the system intensified into Tropical Storm Shary six hours after formation. Within an environment of low wind shear, Shary strengthened into a hurricane and attained peak winds of 75 mph (120 km/h) by 00:00 UTC on October 30 as an eye became apparent on microwave imagery. The storm became increasingly asymmetric as it interacted with the front, and Shary transitioned into an extratropical cyclone by 18:00 UTC that day. The extratropical system was completely absorbed by the front six hours later.[154] Since Shary remained south and east of Bermuda, its effects were limited to 0.54 in (13.7 mm) of rainfall and a gust to 35 mph (55 km/h).[155]
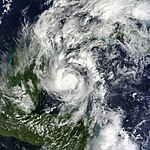
Hurricane Tomas[]
| Category 2 hurricane (SSHWS) | |
  | |
| Duration | October 29 – November 7 |
|---|---|
| Peak intensity | 100 mph (155 km/h) (1-min) 982 mbar (hPa) |
The final tropical cyclone of the 2010 season developed from a tropical wave that moved off Africa on October 24. The wave pushed west, organizing into a tropical depression by 06:00 UTC on October 29 and into Tropical Storm Tomas six hours later while located a few hundred miles east of Barbados. The cyclone turned northwest after formation while continuing to intensify, moving over Barbados by 09:00 UTC on October 30 with winds of 70 mph (115 km/h); as such, Tomas became the latest storm in a calendar year to strike the Windward Islands. The system reached hurricane intensity three hours later, and by 20:00 UTC, attained its peak winds of 100 mph (160 km/h) while moving across St. Lucia. After moving into the Caribbean, a sharp increase in wind shear and dry air entrainment caused Tomas to dramatically weaken, and the storm fell to a tropical depression by 00:00 UTC on November 3. Fluctuating atmospheric conditions allowed Tomas to strengthen and oscillate between a tropical storm and hurricane as it curved through the Windward Passage and into the Atlantic. By 00:00 UTC on November 8, the cyclone succumbed to an increasingly unfavorable regime and became an extratropical cyclone. The storm rotated around a broader low in the western Atlantic before being absorbed by a larger extratropical low south of Newfoundland early on November 11.[36]
Impacts throughout the Windward Islands were substantial, but most heavily concentrated in St. Lucia. There, gusts reached 69 mph (111 km/h), toppling trees and power lines. Torrential rainfall up to 26.3 in (668 mm) created mudslides and landslides that damaged or destroyed numerous structures, bridges, and vehicles. Most of the island's plantain and banana crops were destroyed.[36] Up to 14 people were killed.[156] Farther west in Curaçao, Tomas led to the most prolific rain event in four decades.[157] An elderly man was killed after suffering a heart attack and drowning in his flooded vehicle,[36] while a rescue worker died after a hospital wall collapsed.[158] In Haiti, already ravaged by a catastrophic 7.0 MW earthquake less than a year prior, heavy rainfall flooded a refugee camp and triggered mudslides that destroyed homes and roads.[159] Up to 35 people were killed there, though it was feared many more could die as Tomas exacerbated an already-deadly cholera outbreak.[160]
Storm names[]
The following list of names was used for named storms that formed in the North Atlantic during 2010. The names not retired from this list were used again in the 2016 season. This was the same list used in the 2004 season with the exceptions of Colin, Fiona, Igor, and Julia, which replaced Charley, Frances, Ivan, and Jeanne, respectively.[161] The names Colin, Fiona, Igor, Julia, Paula, Richard, Shary, and Tomas were used for the first time this year (and only, in the cases of Igor and Tomas).
Retirement[]
On March 16, 2011, at the 33rd Session of the RA IV hurricane committee, the World Meteorological Organization retired the names Igor and Tomas from its rotating name lists due to the number of deaths and damage they caused, and they will not be used again for another Atlantic hurricane. They were replaced with Ian & Tobias, respectively, for the 2016 Atlantic hurricane season.[162]
Season effects[]
This is a table of the storms and their effects in the 2010 Atlantic hurricane season. This table includes the storm's names, duration, peak intensity, Areas affected (bold indicates made landfall in that region at least once), damages, and death totals. Deaths in parentheses are additional and indirect (an example of an indirect death would be a traffic accident), but are still storm-related. Damage and deaths include totals while the storm was extratropical, a wave or a low. All of the damage figures are in 2010 USD (the listed damage figure is in millions).
| Saffir–Simpson scale | ||||||
| TD | TS | C1 | C2 | C3 | C4 | C5 |
| Storm name |
Dates active | Storm category
at peak intensity |
Max 1-min wind mph (km/h) |
Min. press. (mbar) |
Areas affected | Damage (USD) |
Deaths | Ref(s)
| ||
|---|---|---|---|---|---|---|---|---|---|---|
| Alex | June 25 – July 2 | Category 2 hurricane | 110 (175) | 946 | Greater Antilles, Central America, Yucatán Peninsula, Northern Mexico, South Texas | $1.52 billion | 33 (19) | |||
| Two | July 8–9 | Tropical depression | 35 (55) | 1005 | Northern Mexico, South Texas | Minimal | None | |||
| Bonnie | July 22–24 | Tropical storm | 45 (75) | 1005 | Puerto Rico, Hispaniola, Turks and Caicos, Bahamas, Florida | $1.36 million | 1 | |||
| Colin | August 2–8 | Tropical storm | 60 (95) | 1005 | Leeward Islands, Bermuda, The Carolinas, New England | Minimal | 1 | |||
| Five | August 10–11 | Tropical depression | 35 (55) | 1007 | United States Gulf Coast | $1 million | 0 (2) | |||
| Danielle | August 21–30 | Category 4 hurricane | 130 (215) | 942 | Bermuda, United States East Coast | Minimal | 2 | |||
| Earl | August 25 – September 4 | Category 4 hurricane | 145 (230) | 927 | Leeward Islands, Puerto Rico, Bahamas, Eastern United States, Atlantic Canada, Quebec | $45 million | 5 (3) | |||
| Fiona | August 30 – September 3 | Tropical storm | 65 (100) | 998 | Leeward Islands, Bermuda | Minimal | None | |||
| Gaston | September 1–2 | Tropical storm | 40 (65) | 1005 | Leeward Islands, Puerto Rico | None | None | |||
| Hermine | September 5–9 | Tropical storm | 70 (110) | 989 | Central America, Mexico, Texas, Oklahoma, Kansas | $740 million | 52 (50) | |||
| Igor | September 8–21 | Category 4 hurricane | 155 (250) | 924 | Cabo Verde, Leeward Islands, Bermuda, United States East Coast, Newfoundland | $200.5 million | 4 | |||
| Julia | September 12–20 | Category 4 hurricane | 140 (220) | 948 | Cabo Verde | Minimal | None | |||
| Karl | September 14–18 | Category 3 hurricane | 125 (205) | 956 | Belize, Yucatán Peninsula, Veracruz | $3.9 billion | 22 | |||
| Lisa | September 20–26 | Category 1 hurricane | 85 (140) | 982 | None | None | None | |||
| Matthew | September 23–26 | Tropical storm | 60 (95) | 998 | Venezuela, Central America, Mexico, Jamaica, Haiti | $171.2 million | 126 | |||
| Nicole | September 28–29 | Tropical storm | 45 (75) | 995 | Cayman Islands, Jamaica, Cuba, Florida, Bahamas, United States East Coast | $245.4 million | 16 | |||
| Otto | October 6 -10 | Category 1 hurricane | 85 (140) | 976 | Leeward Islands, Virgin Islands, Puerto Rico | $22.5 million | None | |||
| Paula | October 11–15 | Category 2 hurricane | 105 (165) | 981 | Nicaragua, Honduras, Mexico, Cuba, Bahamas, Florida | Unknown | 1 | |||
| Richard | October 20–26 | Category 2 hurricane | 100 (155) | 977 | Honduras, Belize, Guatemala, Mexico | $80 million | 1 (1) | |||
| Shary | October 28–30 | Category 1 hurricane | 75 (120) | 989 | Bermuda | Minimal | None | |||
| Tomas | October 29 – November 7 | Category 2 hurricane | 100 (155) | 982 | Windward Islands, Leeward Antilles, Greater Antilles, Lucayan Archipelago | $463.4 million | 51 | |||
| Season aggregates | ||||||||||
| 21 systems | June 25 – November 7 | 155 (250) | 924 | $7.39 billion | 315 (77) | |||||
See also[]
- Atlantic hurricane season
- South-West Indian Ocean cyclone seasons: 2009–10, 2010–11
- Australian region cyclone seasons: 2009–10, 2010–11
- South Pacific cyclone seasons: 2009–10, 2010–11
- South Atlantic tropical cyclone
References[]
- ^ a b Background Information: The North Atlantic Hurricane Season (Report). National Oceanic and Atmospheric Administration. Climate Prediction Center. August 6, 2015. Archived from the original on June 3, 2010. Retrieved January 19, 2017.
- ^ a b c "Atlantic hurricane best track (HURDAT version 2)" (Database). United States National Hurricane Center. May 25, 2020.
- ^ a b Dr. Adam Lea; Professor Mark Saunders (December 7, 2009). "Extended Range Forecast for Atlantic Hurricane Activity in 2010" (PDF). Tropical Storm Risk. Retrieved January 19, 2017.
- ^ a b Philip J. Klotzbach; William M. Gray (December 9, 2009). Extended Range Forecast of Atlantic Seasonal Hurricane Activity and U.S. Landfall Strike Probability for 2010 (PDF) (Report). Colorado State University. Retrieved September 29, 2021.
- ^ a b "WSI Predicts 2010 Hurricane Season to be More Active than 2009". WSI Corporation. January 27, 2010. Archived from the original on February 1, 2017. Retrieved September 29, 2021.
- ^ a b Philip J. Klotzbach; William M. Gray (April 7, 2010). Extended Range Forecast of Atlantic Seasonal Hurricane Activity and U.S. Landfall Strike Probability for 2010 (PDF) (Report). Colorado State University. Retrieved September 29, 2021.
- ^ a b Dr. Adam Lea; Professor Mark Saunders (April 9, 2010). "April Forecast Update for Atlantic Hurricane Activity in 2010" (PDF). Tropical Storm Risk. Retrieved January 19, 2017.
- ^ a b "WSI Significantly Increases Forecast Numbers for 2010 Hurricane Season". WSI Corporation. April 21, 2010. Archived from the original on 2017-02-01. Retrieved January 19, 2017.
- ^ a b Tracey Peake (April 26, 2010). "NC State Predicts Active Atlantic Hurricane Season for 2010". North Carolina State University. Retrieved January 19, 2017.
- ^ a b Dr. Adam Lea; Professor Mark Saunders (May 25, 2010). "TSR Pre-Season Forecast for 2010 Atlantic Hurricane Activity" (PDF). Tropical Storm Risk. Retrieved January 19, 2017.
- ^ a b "WSI Raises Its April Forecast Numbers for 2010 Hurricane Season". WSI Corporation. May 26, 2010. Archived from the original on 2017-02-01. Retrieved January 19, 2017.
- ^ a b Climate Prediction Center (May 27, 2010). "NOAA Expects Busy Atlantic Hurricane Season". National Oceanic and Atmospheric Administration. Archived from the original on May 27, 2010. Retrieved September 29, 2021.
- ^ a b Center for Ocean-Atmospheric Prediction Studies. "FSU COAPS Atlantic Hurricane Season Forecast Archive". Florida State University. Archived from the original on June 19, 2011. Retrieved September 29, 2021.
- ^ a b Philip J. Klotzbach; William M. Gray (June 2, 2010). Extended-Range Forecast of Atlantic Seasonal Hurricane Activity and Landfall Strike Probability for 2010 (PDF) (Report). Colorado State University. Retrieved September 29, 2021.
- ^ a b Dr. Adam Lea; Professor Mark Saunders (June 4, 2010). "June Forecast Update for Atlantic Hurricane Activity in 2010" (PDF). Tropical Storm Risk. Retrieved January 19, 2017.
- ^ a b "North Atlantic tropical storm seasonal forecast 2010". Met Office. June 17, 2010. Retrieved January 19, 2017.
- ^ a b "WSI Again Increases Its Forecast Numbers for 2010 Hurricane Season". WSI Corporation. June 23, 2010. Archived from the original on 2017-02-01. Retrieved January 19, 2017.
- ^ a b Dr. Adam Lea; Professor Mark Saunders (July 6, 2010). "July Forecast Update for Atlantic Hurricane Activity in 2010" (PDF). Tropical Storm Risk. Retrieved January 19, 2017.
- ^ a b "Relatively Inactive June-July Period Forces Decrease in WSI 2010 Tropical Forecast From 20 to 19 Named Storms". WSI Corporation. July 21, 2010. Archived from the original on 2017-02-01. Retrieved January 19, 2017.
- ^ a b Philip J. Klotzbach; William M. Gray (August 4, 2010). Forecast of Atlantic Seasonal Hurricane Activity and Landfall Strike Probability for 2010 (PDF) (Report). Colorado State University. Retrieved September 29, 2021.
- ^ a b Dr. Adam Lea; Professor Mark Saunders (August 4, 2010). "August Forecast Update for Atlantic Hurricane Activity in 2010" (PDF). Tropical Storm Risk. Retrieved January 19, 2017.
- ^ a b "NOAA Still Expects Active Atlantic Hurricane Season; La Niña Develops". National Oceanic and Atmospheric Administration. August 5, 2010. Retrieved January 19, 2017.
- ^ a b "WSI Expects a Very Active Remainder of 2010 Hurricane Season". WSI Corporation. August 25, 2010. Retrieved January 19, 2017.
- ^ a b "WSI Expects 2010 Hurricane Season to Finish Strong". WSI Corporation. September 22, 2010. Archived from the original on 2017-02-01. Retrieved January 19, 2017.
- ^ "Extremely Active Atlantic Hurricane Season was a 'Gentle Giant' for U.S." National Oceanic and Atmospheric Administration. November 29, 2010. Archived from the original on December 3, 2010. Retrieved September 29, 2021.
- ^ Accumulated cyclone energy (ACE) (DOC) (Report). World Meteorological Organization. Retrieved April 27, 2017.
- ^ "Records set in the Atlantic Hurricane Season of 2005". Weather Underground. Retrieved September 29, 2021.
- ^ Remarkable 2010 Hurricane and Typhoon Seasons (PDF) (Report). Tropical Storm Risk. December 2, 2010. Retrieved April 27, 2017.
- ^ Phillip J. Klotzbach; William M. Gray (November 10, 2010). Summary of 2010 Atlantic Tropical Cyclone Activity and Verification of Author's Seasonal and Two-Week Forecasts (PDF) (Report). Colorado State University. pp. 52–60. Retrieved September 29, 2021.
- ^ Eric S. Blake (July 1, 2010). Monthly Tropical Weather Summary: June (Report). National Hurricane Center. Retrieved January 19, 2017.
- ^ Stacy R. Stewart; et al. (August 1, 2010). Monthly Tropical Weather Summary: July (Report). National Hurricane Center. Retrieved January 19, 2017.
- ^ Robbie J. Berg; Eric S. Blake (September 1, 2010). Monthly Tropical Weather Summary: August (Report). National Hurricane Center. Retrieved January 19, 2017.
- ^ Dolce, Chris (October 6, 2020). "All the Records the 2020 Hurricane Season has Broken So Far". weather.com. The Weather Channel. Retrieved September 19, 2021.
- ^ a b c d e Richard J. Pasch; Todd B. Kimberlain (February 15, 2011). Tropical Cyclone Report: Hurricane Igor (PDF) (Report). Miami, Florida: National Hurricane Center. pp. 1, 2, 6, 7. Retrieved January 16, 2017.
- ^ Todd B. Kimerlain; Robbie J. Berg; Eric S. Blake; Stacy R. Stewart (November 1, 2010). Monthly Tropical Weather Summary: October (Report). National Hurricane Center. Retrieved January 19, 2017.
- ^ a b c d Richard J. Pasch; Todd B. Kimberlain (March 7, 2011). Tropical Cyclone Report: Hurricane Tomas (PDF) (Report). Miami, Florida: National Hurricane Center. pp. 1, 2, 5, 6. Retrieved January 18, 2017.
- ^ Hurricane Specialist Unit (December 1, 2010). Monthly Tropical Weather Summary: November (Report). National Hurricane Center. Retrieved January 19, 2017.
- ^ a b Richard J. Pasch (December 15, 2010). Tropical Cyclone Report: Hurricane Alex (PDF) (Report). Miami, Florida: National Hurricane Center. pp. 1, 2, 5. Retrieved January 11, 2017.
- ^ "Un muerto 2 mil 840 desplazados y 568 viviendas afectadas por lluvias en RD". El Nuevo Diario (in Spanish). June 22, 2010. Archived from the original on 2016-04-19. Retrieved January 11, 2017.
- ^ Government of Guatemala (June 29, 2010). "Guatemala: Daños en agricultura se incrementan con tormenta Alex". ReliefWeb. Retrieved January 11, 2017.
- ^ Y. Rodríguez; Ó. Gutiérrez (June 30, 2010). "Alex pegará como huracán a Tamaulipas". El Universal. Retrieved January 11, 2017.
- ^ a b c David M. Roth. Hurricane Alex - June 29 - July 6, 2010 (Report). Weather Prediction Center. Retrieved January 11, 2017.
- ^ Roberto Aguilar; et al. (July 1, 2010). "Furia de Alex obliga a miles a dejar su hogar". El Universal. Retrieved January 11, 2017.
- ^ "Deja Alex 256 mil personas sin luz en Tamaulipas". Milenio. July 1, 2010. Archived from the original on April 11, 2013. Retrieved January 11, 2017.
- ^ "Alex dejó 6 mil casas dañadas en Tamaulipas". Vanguardia. July 22, 2010. Retrieved January 11, 2017.
- ^ United States of America (March 8, 2011). Reports of Hurricanes, Tropical Storms, Tropical Disturbances, and Related Flooding During 2010 (DOC) (Report). World Meteorological Organization. Retrieved January 11, 2017.
- ^ Brief report on Hurricane Alex and Impacts on the Lower Rio Grande Valley (Report). National Weather Service. National Weather Service Weather Forecast Office in Brownsville, Texas. Retrieved January 11, 2017.
- ^ "Hurricane season 2010: Constant storms, inconsistent impact". Plant It Now. November 16, 2010. Archived from the original on January 16, 2017. Retrieved September 29, 2021.
- ^ a b John L. Beven II (October 21, 2010). Tropical Cyclone Report: Tropical Depression Two (PDF) (Report). Miami, Florida: National Hurricane Center. pp. 1, 2. Retrieved January 12, 2017.
- ^ "Alertan a estados del norte por efectos de la depresión tropical 2". Periódico Zócalo. July 8, 2010. Retrieved January 12, 2017.
- ^ Event Report: Storm Surge/Tide (Report). National Centers for Environmental Information. National Weather Service Weather Forecast Office in Corpus Christi, Texas. 2010. Retrieved January 12, 2017.
- ^ Mary Beth Gerhadt (July 9, 2010). "Remnants of Tropical Depression Two Public Advisory Number 9". Weather Prediction Center. Retrieved January 12, 2017.
- ^ a b Stacy R. Stewart (December 28, 2010). Tropical Cyclone Report: Tropical Storm Bonnie (PDF) (Report). Miami, Florida: National Hurricane Center. pp. 1, 2, 5. Retrieved January 12, 2017.
- ^ "Bonnie Hits Florida on Way to Gulf". CBS News. July 23, 2010. Retrieved January 12, 2017.
- ^ Florida Event Report: Tropical Storm (Report). National Centers for Environmental Information. National Weather Service Weather Forecast Office in Miami, Florida. 2010. Retrieved January 12, 2017.
- ^ David M. Roth. Tropical Storm Bonnie - July 22-25, 2010 (Report). Weather Prediction Center. Retrieved January 12, 2017.
- ^ Louisiana Event Report: Heavy Rain/Tropical System (Report). National Centers for Environmental Information. National Weather Service Weather Forecast Office in New Orleans, Louisiana. 2010. Retrieved January 12, 2017.
- ^ Louisiana Event Report: Heavy Rain/Tropical System (Report). National Centers for Environmental Information. National Weather Service Weather Forecast Office in New Orleans, Louisiana. 2010. Retrieved January 12, 2017.
- ^ Arkansas Event Report: Thunderstorm Wind (Report). National Centers for Environmental Information. National Weather Service Weather Forecast Office in Little Rock, Arkansas. 2010. Retrieved January 12, 2017.
- ^ a b Daniel P. Brown (October 4, 2010). Tropical Cyclone Report: Tropical Storm Colin (PDF) (Report). Miami, Florida: National Hurricane Center. pp. 1, 2, 4. Retrieved January 12, 2017.
- ^ BWS Daily Climatology Written Summary (Report). Bermuda Weather Service. August 9, 2010. Archived from the original on February 1, 2010. Retrieved January 12, 2017.
- ^ Colin Hackman (August 9, 2010). "Hundreds of ocean rescues on rip filled beaches". WECT News. Archived from the original on December 30, 2016. Retrieved January 12, 2017.
- ^ Matthew Burns (August 9, 2010). "Maryland man drowns off Ocracoke Island". WRAL News. Retrieved January 12, 2017.
- ^ a b Michael J. Brennan (November 4, 2010). Tropical Cyclone Report: Tropical Depression Five (PDF) (Report). Miami, Florida: National Hurricane Center. pp. 1, 3. Retrieved January 13, 2017.
- ^ Richard J. Pasch; Stacy R. Stewart (August 16, 2010). "Special Tropical Weather Outlook". National Hurricane Center. Retrieved January 13, 2017.
- ^ Christopher O'Donnell (August 14, 2010). "Deaths show secluded beaches carry some risk". Sarasota Herald-Tribune. Retrieved January 13, 2017.
- ^ Mark Schleifstein (August 13, 2010). "Remnants of Tropical Depression 5 soak New Orleans area". The Times-Picayune. Archived from the original on September 25, 2015. Retrieved January 13, 2017.
- ^ Mark R. Kent (August 15, 2010). "Intense thunderstorm dumps 3 inches of rain on Mobile, damages Archdiocese building". AL.com. Retrieved January 13, 2017.
- ^ Louisiana Event Report: Heavy Rain (Report). National Centers for Environmental Information. National Weather Service Weather Forecast Office in Lake Charles, Louisiana. 2010. Retrieved January 13, 2017.
- ^ David M. Roth. Tropical Depression Five - August 9-20, 2010 (Report). Weather Prediction Center. Retrieved January 13, 2017.
- ^ a b Todd B. Kimberlain (December 15, 2010). Tropical Cyclone Report: Hurricane Danielle (PDF) (Report). Miami, Florida: National Hurricane Center. pp. 1, 2, 4, 5. Retrieved January 13, 2017.
- ^ "Hurricanes roil Atlantic coast; 1 dead, 1 missing". WIS News. August 30, 2010. Archived from the original on January 18, 2017. Retrieved January 13, 2017.
- ^ "Titanic explorers take cover from hurricane". CBC News. August 30, 2010. Retrieved January 13, 2017.
- ^ "Hurricane Season 2010: Danielle (Atlantic Ocean)". National Aeronautics and Space Administration. August 31, 2010. Retrieved January 13, 2017.
- ^ a b c d e f John P. Cangialosi (January 13, 2011). Tropical Cyclone Report: Hurricane Earl (PDF) (Report). Miami, Florida: National Hurricane Center. pp. 1, 2, 6, 7. Retrieved January 14, 2017.
- ^ "Hurricane Earl damages amount to $34M, report finds". The Daily Observer. October 5, 2010. Archived from the original on February 2, 2017. Retrieved September 29, 2021.
- ^ Caribbean Disaster Emergency Management Agency (September 1, 2010). CDEMA Situation Report #3 – Hurricane Earl (Report). ReliefWeb. Retrieved January 14, 2017.
- ^ Passage de L'ouragan Earl sur la Guadeloupe et les iles du nord les 29 et 30 Août 2010 (PDF) (Report) (in French). Météo France. Retrieved January 14, 2017.
- ^ "US braces for Hurricane Earl". Al Jazerra. August 30, 2010. Retrieved January 14, 2017.
- ^ Sheena Brooks (September 3, 2010). "Back on Track after Hurricane Earl". The St Kitts & Nevis Observer. Retrieved January 15, 2017.
- ^ Melissa French. "Earl Cost Gov't $7M; Recent Flood to Cost More". BVI Platinum News. Archived from the original on October 8, 2010. Retrieved January 15, 2017.
- ^ Aldeth Lewin (October 2, 2010). "Obama declares Earl a USVI disaster, allowing federal aid". Caribbean News Now. Archived from the original on 2017-01-16. Retrieved January 15, 2017.
- ^ Joy Blackburn (September 15, 2010). "V.I. can feel economic winds from hurricanes far from territory". The Triboro Banner. Archived from the original on January 16, 2017. Retrieved September 29, 2021.
- ^ Gay Nagle Myers (September 1, 2010). "Hurricane Earl does damage in Anguilla". Travel Weekly. Retrieved January 15, 2017.
- ^ David Landes (September 5, 2010). "Swedish sailor missing after tropical storm Earl". The Local. Retrieved January 15, 2017.
- ^ Florida Event Report: High Surf (Report). National Centers for Environmental Information. National Weather Service Weather Forecast Office in Miami, Florida. 2010. Retrieved January 15, 2017.
- ^ Agence-France Presse (September 5, 2010). "Hurricane Earl sweeps through Canada". The Age. Retrieved January 15, 2017.
- ^ a b Robbie J. Berg (October 18, 2010). Tropical Cyclone Report: Tropical Storm Fiona (PDF) (Report). Miami, Florida: National Hurricane Center. pp. 1, 2, 4. Retrieved January 15, 2017.
- ^ "Climate data for Bermuda - September 2010". Bermuda Weather Service. Archived from the original on December 16, 2009. Retrieved January 15, 2017.
- ^ a b Eric S. Blake (November 18, 2010). Tropical Cyclone Report: Tropical Storm Gaston (PDF) (Report). Miami, Florida: National Hurricane Center. pp. 1–3. Retrieved January 15, 2017.
- ^ Eric S. Blake (September 1, 2010). Tropical Storm Gaston Discussion Number 2 (Report). National Hurricane Center. Retrieved January 15, 2017.
- ^ David M. Roth. Remnants of Gaston - September 6-7, 2010 (Report). Weather Prediction Center. Retrieved January 15, 2017.
- ^ a b c d Lixion A. Avila (November 22, 2010). Tropical Cyclone Report: Tropical Storm Hermine (PDF) (Report). Miami, Florida: National Hurricane Center. pp. 1, 4. Retrieved January 16, 2017.
- ^ John P. Cangialosi; Richard J. Pasch (September 7, 2010). Tropical Storm Hermine Discussion Number 8 (Report). National Hurricane Center. Retrieved January 16, 2017.
- ^ "Hermine Weakens to Tropical Depression". CBS News. September 7, 2010. Retrieved January 16, 2017.
- ^ State of Texas (September 13, 2010). Tropical Storm Hermine Situation Report Six (Report). Texas State Operations Center.
- ^ David M. Roth. Tropical Depression 11-E/T.S. Hermine - September 3-11, 2010 (Report). Weather Prediction Center. Retrieved January 16, 2017.
- ^ Ken Miller (September 10, 2010). "Deadly remnants of Hermine pound Texas, Okla". USA Today. Retrieved January 16, 2017.
- ^ Courtney Bullard (November 12, 2010). "Sequoyah County denied flood assistance". Sequoyah County Times. Archived from the original on November 24, 2010. Retrieved January 16, 2017.
- ^ "Death toll from remnants of Tropical Storm Hermine reaches 8 after 2 bodies found in Texas". Fox News. September 14, 2010. Retrieved January 16, 2017.
- ^ Matt Tomsic (September 19, 2010). "Surfer dies after being pulled from water at Surf City". Star News. Retrieved January 16, 2017.
- ^ David M. Roth. Hurricane Igor - September 20-21, 2010 (Report). Weather Prediction Center. Retrieved January 16, 2017.
- ^ a b Government of Canada (March 8, 2011). Review of the Past Hurricane Season: Reports of Hurricanes, Tropical Storms, and Tropical Disturbances and Related Flooding During 2010 (Report). World Meteorological Organization. Retrieved January 16, 2017.
- ^ QMI Agency (September 27, 2010). "Igor cleanup will take months". The Toronto Sun. Archived from the original on November 1, 2016. Retrieved September 29, 2021.
- ^ Government of Canada. "Notable Canadian Tropical Cyclones". Environment and Climate Change Canada. Retrieved January 16, 2017.
- ^ a b c John L. Beven II; Christopher W. Landsea (December 9, 2010). Tropical Cyclone Report: Hurricane Julia (PDF) (Report). Miami, Florida: National Hurricane Cener. pp. 1, 2, 5, 6. Retrieved January 16, 2017.
- ^ John P. Cangialosi (September 15, 2010). "Hurricane Julia Discussion Number 13". Miami, Florida: National Hurricane Center. Retrieved January 16, 2017.
- ^ "Tempestade tropical Júlia afasta-se de Cabo Verde" (in Portuguese). Radiotelevisão Caboverdiana. September 14, 2010. Archived from the original on March 4, 2016. Retrieved September 29, 2021.
- ^ "Weather History for Sal, Cabo Verde: September 12, 2010". Weather Underground. September 12, 2010. Archived from the original on October 7, 2015. Retrieved September 29, 2021.
- ^ "Weather History for Sal, Cabo Verde: September 13, 2010". Weather Underground. September 12, 2010. Archived from the original on October 7, 2015. Retrieved September 29, 2021.
- ^ a b Stacy R. Stewart (January 31, 2011). Tropical Cyclone Report: Hurricane Karl (PDF) (Report). Miami, Florida: National Hurricane Center. pp. 1, 2, 6. Retrieved January 17, 2017.
- ^ "Karl, una de las peores tormentas: autoridades". El Universal (in Spanish). September 15, 2010. Retrieved January 17, 2017.
- ^ a b c Annual Global Climate and Catastrophe Report (PDF) (Report). AON Benefield. Retrieved January 17, 2017.
- ^ "Daños eléctricos en Quintana Roo a causa de la tormenta "Karl"" (in Spanish). Artículo 7. September 15, 2010. Retrieved January 17, 2017.
- ^ Ernestoa Perea (September 22, 2010). "Daños agropecuarios e inundaciones deja el año más húmedo en 60 años" (in Spanish). Imagen Agropecuaria. Retrieved January 17, 2017.
- ^ David M. Roth. "Hurricane Karl - September 14-18, 2010". Weather Prediction Center. Retrieved January 17, 2017.
- ^ "Hay 235 mil casas sin luz en Veracruz" (in Spanish). El Informador. September 18, 2010. Retrieved January 17, 2017.
- ^ Daniel P. Brown. Tropical Cyclone Report: Hurricane Lisa (PDF) (Report). Miami, Florida: National Hurricane Center. pp. 1, 2, 4.
- ^ Michael J. Brennan (December 30, 2010). Tropical Cyclone Report: Tropical Storm Matthew (PDF) (Report). Miami, Florida: National Hurricane Center. pp. 1, 2, 5. Retrieved January 17, 2017.
- ^ "Fourteen dead in tropical storm". News.com.au — Australia's Leading News Site. News.com.au. September 26, 2010. Retrieved January 17, 2017.
- ^ CWS Emergency Situation Report: 2010 Tropical Storm Matthew (Report). ReliefWeb. October 1, 2010. Retrieved January 17, 2017.
- ^ "International Disaster Database: Disaster List". EM-DAT. Archived from the original on July 8, 2015. Retrieved January 17, 2017.
- ^ David M. Roth. Tropical Storm Matthew - September 23-26, 2010 (Report). Weather Prediction Center. Retrieved January 17, 2017.
- ^ "Tropical storms cost Mexican state $8 bn". La Prensa. October 14, 2010. Archived from the original on October 18, 2010. Retrieved January 17, 2017.
- ^ Jo Tuckman; Rory Carroll (September 28, 2010). "Hundreds feared dead in Mexico landslide". The Guardian. Retrieved January 17, 2017.
- ^ a b c d Eric S. Blake (January 31, 2011). Tropical Cyclone Report: Tropical Storm Nicole (PDF) (Report). Miami, Florida: National Hurricane Center. pp. 1, 2, 4. Retrieved January 17, 2017.
- ^ a b Tropical Storm Nicole Impact Assessment (PDF) (Report). Planning Institute of Jamaica. November 2010. Archived from the original (PDF) on March 4, 2016. Retrieved January 20, 2017.
- ^ DREF operation final report – Jamaica: Tropical Storm Nicole (PDF). Disaster Relief Emergency Fund (Report). International Federation of Red Cross and Red Crescent Societies. June 2, 2011. Retrieved January 20, 2017.
- ^ "Tropical Storm Nicole bringing rain to South Florida". USA Today. Associated Press. September 29, 2010. Retrieved January 20, 2017.
- ^ "Tropical Storm Nicole bill now at $20 billion". Jamaica Observer. October 27, 2010. Retrieved January 20, 2017.
- ^ "Lluvias causan daños en cultivos y viviendas". El Nuevo Herald (in Spanish). Noticias 24. October 2, 2010. Retrieved January 20, 2017.
- ^ Annual Report 2010-2011 (PDF). Hazard Management Cayman Islands (Report). Cayman Prepared. Retrieved January 20, 2017.
- ^ "Hurricane Season 2010: Tropical Storm Nicole (Atlantic Ocean)". National Aeronautics and Space Administration. October 4, 2010. Retrieved January 20, 2017.
- ^ Ron Scherer (October 1, 2010). "Remnants of tropical storm Nicole wallop East Coast with huge rainfall". The Christian Science Monitor. Retrieved January 20, 2017.
- ^ John P. Cangialosi (November 17, 2010). Tropical Cyclone Report: Hurricane Otto (PDF) (Report). Miami, Florida: National Hurricane Center. pp. 1, 2, 4, 5. Retrieved January 18, 2017.
- ^ "Red Cross responds to St Lucia floods". Caribbean 360. October 18, 2010. Archived from the original on February 2, 2017. Retrieved September 29, 2021.
- ^ "Heavy rains, high winds in SKN disrupt residents' daily routine". SKN Vibes. October 8, 2010. Retrieved January 21, 2017.
- ^ Joy Blackburn (October 7, 2010). "Storm pummels St. Croix". Daily News. The Times Tribune. Archived from the original on February 2, 2017. Retrieved September 29, 2021.
- ^ Joy Blackburn; Aldeth Lewin (October 8, 2010). "Otto's onslaught spread havoc". Daily News. The Triboro Banner. Retrieved January 21, 2017.
- ^ Danica Coto (October 7, 2010). "Tropical Storm Otto unleashes floods". Newshub. Retrieved January 21, 2017.
- ^ "Gobierno desembolsará millones por estragos causados por Otto" (in Spanish). El Nuevodia. October 11, 2010. Retrieved January 21, 2017.
- ^ "Familias incomunicadas en Arecibo, Ponce y Cayey" (in Spanish). El Nuevodia. October 7, 2010. Retrieved January 21, 2017.
- ^ "Estado de emergencia en toda la Isla" (in Spanish). El Nuevodia. October 8, 2010. Retrieved January 21, 2017.
- ^ a b c Robbie J. Berg (December 20, 2010). Tropical Cyclone Report: Hurricane Paula (PDF) (Report). Miami, Florida: National Hurricane Center. pp. 1, 2, 5. Retrieved January 18, 2017.
- ^ "Hurricane Paula Lashes Honduras, Nears Yucatán". CBS News. October 12, 2010. Retrieved April 26, 2017.
- ^ "Huracán "Paula" se aleja de Honduras" (in Spanish). LaPrensa. October 12, 2010. Retrieved April 26, 2017.
- ^ "Tormenta tropical Paula daña casas y derriba árboles en Honduras". Primera Hora. October 12, 2010. Retrieved April 26, 2017.
- ^ "Weather History for Quintana Roo". Weather Underground. October 13, 2010. Retrieved April 26, 2017.
- ^ "A weakening Paula drenches Cuba". Der Keiler. October 15, 2010. Archived from the original on April 27, 2017. Retrieved September 29, 2021.
- ^ "Cuba's capital cleans up from Tropical Storm Paula". Fox News. October 15, 2010. Retrieved April 26, 2017.
- ^ a b Todd B. Kimberlain (January 13, 2011). Tropical Cyclone Report: Hurricane Richard (PDF) (Report). Miami, Florida: National Hurricane Center. pp. 1, 2, 5. Retrieved January 18, 2017.
- ^ "Richard becomes hurricane, heads for tiny Belize". Sify News. The Associated Press. October 26, 2010. Archived from the original on April 27, 2017. Retrieved April 26, 2017.
- ^ Beth Buczynski (November 14, 2010). "Belize Zoo Ravaged By Hurricane Richard". Care 2. Archived from the original on January 19, 2013. Retrieved April 26, 2017.
- ^ Lixion A. Avila (January 3, 2011). Tropical Cyclone Report: Hurricane Shary (PDF) (Report). Miami, Florida: National Hurricane Center. pp. 1, 3. Retrieved January 18, 2017.
- ^ BWS Daily Climatological Written Summary (Report). Bermuda Weather Service. October 30, 2010. Archived from the original on February 1, 2010. Retrieved April 26, 2017.
- ^ "Hurricane kills 14 people in St Lucia". BBC News. November 2, 2010. Retrieved April 27, 2017.
- ^ Dick Drayer (November 11, 2010). "Meteo rapporteert over Tomas" (in German). Radio Nederland Wereldomroep. Archived from the original on 2017-09-29. Retrieved April 27, 2017.
- ^ Leoni Leidel-Schenk (November 2, 2010). "Tomas eist twee levens". Versgeperst.com. Archived from the original on November 4, 2010. Retrieved April 27, 2017.
- ^ "Rain hits Haiti, flooding refugee camp". SMH News. November 6, 2010. Archived from the original on November 5, 2010. Retrieved April 27, 2017.
- ^ "Haiti fears spread of cholera". Al Jazeera. November 7, 2010. Retrieved April 27, 2017.
- ^ "Retired Hurricane Names Since 1954". National Hurricane Center. Retrieved November 29, 2009.
- ^ Dennis Feltgen (March 16, 2011). Two Tropical Cyclone Names Retired from List of Atlantic Storms (PDF) (Report). National Oceanic and Atmospheric Administration. Retrieved April 28, 2017.
External links[]
| Wikimedia Commons has media related to 2010 Atlantic hurricane season. |
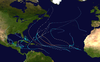
- 2010 Atlantic hurricane season
- Atlantic hurricane seasons
- Tropical cyclones in 2010