2010–11 Australian region cyclone season
| 2010–11 Australian region cyclone season | |
|---|---|
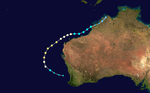
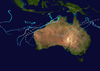
 Season summary map | |
| Seasonal boundaries | |
| First system formed | 28 October 2010 |
| Last system dissipated | 18 April 2011 |
| Strongest storm | |
| Name | Yasi |
| �� Maximum winds | 205 km/h (125 mph) (10-minute sustained) |
| • Lowest pressure | 929 hPa (mbar) |
| Seasonal statistics | |
| Tropical lows | 28[nb 1] |
| Tropical cyclones | 10 |
| Severe tropical cyclones | 5 |
| Total fatalities | 3 total |
| Total damage | $3.62 billion (2011 USD) (Costliest Australian region cyclone season recorded) |
| Related articles | |
The 2010–11 Australian region cyclone season was a near average tropical cyclone season, with eleven tropical cyclones forming compared to an average of 12. The season was also the costliest recorded in the Australian region basin, with a total of $3.62 billion (2011 USD) in damages, mostly from the destructive Cyclone Yasi.[1] The season began on 1 November 2010 and ended on 30 April 2011, although the first tropical cyclone formed on 28 October. The Australian region is defined as being to the south of the equator, between the 90th meridian east and 160th meridian east. Tropical cyclones in this area are monitored by five Tropical Cyclone Warning Centres (TCWC's): Jakarta, Port Moresby, Perth, Darwin, and Brisbane, each of which have the power to name a tropical cyclone. The TCWC's in Perth, Darwin, and Brisbane are run by the Bureau of Meteorology, who designate significant tropical lows with a number and the U suffix. The Joint Typhoon Warning Center also issues unofficial warnings for the region, designating significant tropical cyclones with the "S" suffix when they form west of 135°E, and the "P" suffix when they form east of 135°E.
Seasonal forecasts[]
| TSR forecasts Date |
Tropical storms |
Severe Tropical cyclones |
Landfalling cyclones |
ACE | Ref |
|---|---|---|---|---|---|
| Average (1975/76–2009/10) | 10.5 | 5.5 | 4.5 | 79 | [2][3] |
| 5 May 2010 | 9.3 | 4.9 | 4 | – | [2] |
| 6 July 2010 | 12.5 | 6.7 | 5.2 | – | [4] |
| 6 September 2010 | 15.1 | 8.1 | 6.1 | 108 | [5] |
| 9 November 2010 | 15.4 | 8.3 | 6.2 | 111 | [6] |
| 6 December 2010 | 15.5 | 8.3 | 6.2 | 111 | [3] |
| Region | Average | Chance of Above average |
Predicted activity |
Actual activity | Ref |
| Whole | 12 | 98% | 20–22 | 10 | |
| Western | 7 | 93% | 11–12 | 6 | |
| North-Western | 4 | 67% | 5 | 5 | |
| Northern | 6 | 75% | 7–8 | 0 | |
| Eastern | 4 | 87% | 6–7 | 4 | |
| Forecast Center |
Tropical lows |
Tropical cyclones |
Severe tropical cyclones |
Ref | |
| Actual activity: | BoM | 28 | 10 | 5 | |
| Actual activity: | JTWC | 13 | 13 | 5 |
Ahead of the cyclone season, the Australian Bureau of Meteorology (BoM), the New Zealand National Institute of Water and Atmospheric Research (NIWA) and various other Pacific Meteorological services, all contributed towards the Island Climate Update tropical cyclone outlook that was released during October 2010.[7] The outlook took into account the moderate-strong La Niña conditions that had been observed across the Pacific and analogue seasons that had La Niña conditions occurring during the season.[7][8] The outlook called for a normal or above average number of tropical cyclone occurring during the season, with nine to twelve named tropical cyclones, to occur between 135°E and 120°W compared to an average of nine.[7] At least three of the tropical cyclones were expected to become category 3 severe tropical cyclones, while one was expected to become a category 4 severe tropical cyclone.[7] In addition to contributing towards the Island Climate Update outlook, the BoM issued seven seasonal forecasts during October 2010, for the Australian region and the Southern Pacific with each forecast covering the whole tropical cyclone year.[9] Each forecast issued took into account the La Niña conditions that had developed over the region and were forecasted to persist during the season.[9]
For the Australian region as a whole it was predicted that the season could be the most active season since 1983–84 and that between 20 – 22 tropical cyclones would either develop within or move into the basin compared to an average of 12 cyclones.[9][10] For the Western region between 90°E and 125°E, the BoM forecast that the area would see between 11 and 12 tropical cyclones compared to the average of 7, it was also noted that the region had a 93% chance of an above average cyclone season.[9] For the North-Western subregion between 105°E and 130°E, it was predicted that activity would be above average, with 5 tropical cyclones and a 67% chance of above average tropical cyclone activity.[9] TCWC Perth also noted that there was a likelihood of two tropical cyclones and a significant likelihood of at least one severe tropical cyclone impacting Western Australia.[11] It was also noted that there was an increased chance of an early season cyclone and a system impacting Western Australia before Christmas 2010.[11] It was predicted that the Northern Territory between 125°E and 142.5°E had a 75% chance of an above average season, and that the first cyclone of the season over the Territory and the monsoon onset would be expected to be earlier than normal.[9][12] The Eastern region between 142.5°E and 160°E had an 87% chance of an above average season, with 7–8 tropical cyclones predicted for the region compared to an average of 6.[9][13] The BoM also issued forecasts for the Western Southern Pacific region, between 142.5°E and 165°E and the Eastern Southern Pacific region between 165°E and 120°W.[14] It was predicted that the Western Southern Pacific would have a 79% chance of having an above average season with 7–8 tropical cyclones occurring within the region, compared to an average of 5 tropical cyclones.[14] The Eastern Southern Pacific region was predicted to have a 33% chance of having an above average season and 5–6 tropical cyclones compared to an average of 7 tropical cyclones.[14]
The Guy Carpenter Asia-Pacific Climate Impact Centre (GCACIC) at the City University of Hong Kong and the Tropical Storm Risk Consortium (TSR) at the University College London also issued seasonal forecasts for the region.[15][16]
Seasonal summary[]

Systems[]
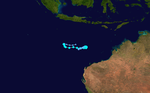
Tropical Low Anggrek[]
| Tropical low (Australian scale) | |
| Tropical storm (SSHWS) | |
  | |
| Duration | 28 October – 4 November |
|---|---|
| Peak intensity | 75 km/h (45 mph) (10-min) 995 hPa (mbar) |
On 28 October, TCWC Jakarta reported that Tropical Low 01U had developed to the southwest of Sumatra in Indonesia.[17][18] Over the next few days, the system's low-level circulation centre gradually developed further as the low drifted towards the west. On 30 October, the JTWC began issuing advisories on the system, designating it as Tropical Cyclone 02S. The next day, TCWC Jakarta reported that the low had intensified into a category 1 tropical cyclone on the Australian scale, naming it "Anggrek". Later that day, as the system moved towards the southeast, it entered TCWC Perth's area of responsibility as it further intensified into a category 2 tropical cyclone. Anggrek passed to the east of the Cocos (Keeling) Islands early on 2 November, with the system beginning a weakening trend soon afterwards. On 4 November, TCWC Perth issued the final advisory on the system as Anggrek weakened into a tropical low. The next day, the remnants of Anggrek entered the south-west Indian Ocean as a convective-less circulation center.[19]
Throughout the Cocos (Keeling) Islands, heavy rain and gusty winds were experienced as Cyclone Anggrek passed. Only minor damage was reported, with several trees and power lines brought down. No deaths were reported across the islands. In post-storm analysis, TCWC Perth declassified Anggrek as a tropical cyclone as gale-force winds never extended more than halfway around the system center.[20]
Tropical Cyclone Abele[]
| Category 2 tropical cyclone (Australian scale) | |
| Category 1 tropical cyclone (SSHWS) | |
  | |
| Duration | 3 December (Entered basin) – 4 December |
|---|---|
| Peak intensity | 95 km/h (60 mph) (10-min) 987 hPa (mbar) |
Early on 3 December, TCWC Perth reported that Tropical Cyclone Abele had moved into the Australian Region from the South-West Indian Ocean as a category 2 tropical cyclone.[20][21] As it entered the region the system was located well to the southwest of the Cocos (Keeling) Islands, with the JTWC reporting that the system was equivalent to a category 1 hurricane with 1-minute sustained windspeeds of 120 km/h (75 mph).[21][22] Over the next day Abele weakened further because of cooler sea surface temperatures and increasing vertical wind shear, before it was last noted by both the JTWC and TCWC Perth during 4 December.[20][21][22]
Tropical Low 03U[]
| Tropical low (Australian scale) | |
  | |
| Duration | 15 December – 20 December |
|---|---|
| Peak intensity | 55 km/h (35 mph) (10-min) 989 hPa (mbar) |
On 15 December a monsoonal low developed about 500 km north-west of Exmouth, Western Australia. The system drifted slowly to the south-east. Gales and heavy rain reached areas far from the centre of the system which crossed the coast near Coral Bay on 18 December. However, shortly after landfall the system turned sharply to the south-west and reached the Indian Ocean west of Carnarvon on 19 December. It moved away from the coast and dissipated late on 20 December some 500 km west of Geraldton.[23]
In the catchment basin of the Gascoyne River heavy precipitation fell from 16 to 19 December and triggered one of the worst floods along the Gascoyne River in history. The rain also affected other river basins in the area, such as Wooramel, Murchison, Lyndon-Minilya, and Ashburton rivers. For the period from 16 to 20 December some stations reported up to 300 mm cumulated precipitation which is equivalent to the normal annual rainfall amount. The highest 24 hours rainfall was reported at Carnarvon Airport on 17 December. During that day 207.8 mm fell which set an all-time record since recording began in 1883 with the previous record 119.4 mm set on 24 March 1923.[23]
Preliminary estimates placed damage at A$100 million (US$100.4 million) with at least 2000 head of cattle lost in the flood.[23]
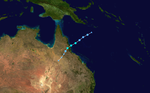
Tropical Cyclone Tasha[]
| Category 1 tropical cyclone (Australian scale) | |
| Tropical storm (SSHWS) | |
  | |
| Duration | 20 December – 25 December |
|---|---|
| Peak intensity | 75 km/h (45 mph) (10-min) 993 hPa (mbar) |
In late December, a low-pressure area was tracked for several days moving westwards towards Queensland. Early on Christmas Day (local time) it strengthened rapidly and was designated Tropical Cyclone Tasha when it was 95 km (59 mi) east northeast of Cairns. The cyclone crossed the coast between Cairns and Innisfail at about 5:30 am, with wind gusts of up to 105 km/h (65 mph) recorded off the coast. Rainfall of about 100 mm was recorded in the space of an hour.[24] Damage from associated flooding was estimated at A$1 billion.[25][26]
Tropical Cyclone Vince[]
| Category 1 tropical cyclone (Australian scale) | |
| Tropical storm (SSHWS) | |
  | |
| Duration | 10 January – 15 January |
|---|---|
| Peak intensity | 75 km/h (45 mph) (10-min) 986 hPa (mbar) |
At midnight on 10 January, the Bureau of Meteorology (BoM) reported that a Tropical Low had developed off the coast of Western Australia.[27] The system gradually intensified and became a Category 1 tropical cyclone on 12 January, receiving the name "Vince".[28] The cyclone was initially expected to reach Category 2 status, but it became less well organised and lost cyclone intensity on 14 January.[29]
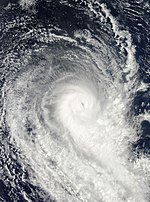
Severe Tropical Cyclone Zelia[]
| Category 4 severe tropical cyclone (Australian scale) | |
| Category 2 tropical cyclone (SSHWS) | |
  | |
| Duration | 12 January – 16 January (Exited basin) |
|---|---|
| Peak intensity | 185 km/h (115 mph) (10-min) 943 hPa (mbar) |
On 12 January, TCWC Brisbane started monitoring Tropical Low 10U that had developed, over the Coral Sea to the northeast of Townsville in Queensland, Australia.[20][30]
Tropical Cyclone Anthony[]
| Category 2 tropical cyclone (Australian scale) | |
| Tropical storm (SSHWS) | |
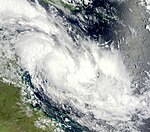 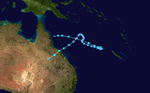 | |
| Duration | 22 January – 31 January
(Exited basin) |
|---|---|
| Peak intensity | 95 km/h (60 mph) (10-min) 989 hPa (mbar) |
During 22 January TCWC Brisbane reported that Tropical Low 11U had developed within the northwestern Coral Sea to the northeast of Cairns, Australia.[20] Over the next day atmospheric convection developed and organised over the systems low level circulation, as it moved southeastwards away from the Queensland Coast under the influence of an upper-level trough of low pressure.[20] The JTWC subsequently initiated advisories on the system early on 23 January and designated it as Tropical Cyclone 09P, before TCWC Brisbane reported that the system had developed into a category 1 tropical cyclone and named it Anthony.[20][31] During that day the system may have become a category 2 tropical cyclone as radar and microwave imagery showed that Anthony had a well defined circulation and was forming a partial eyewall.[20] The system subsequently moved into an area of higher vertical windshear and weakened into a tropical low during 24 January as it moved into the South Pacific basin.[20]
The system moved back into the Australian region during 25 January but remained a tropical low over the next few days, as it moved north-westwards across the Coral Sea as a low level circulation centre with little or no associated convection.[20] During 28 January TCWC Brisbane briefly reported that Anthony had re-intensified into a category 1 tropical cyclone, after wind shear over the system reduced due to a possible Fujiwhara interaction with a secondary circulation to the east of Anthony and Severe Tropical Cyclone Wilma.[20] However, later that day the system turned and started moving towards the north-west as the secondary system moved to its north, which meant that Anthony became sheared again and weakened into a tropical low.[20] The system remained a sheared tropical low until late on 29 January, when convection began to increase and organize as a result of weakening upper atmospheric wind shear.[20] During the next day as Anthony moved towards the southwest and the Queensland coast, the JTWC re-initiated advisories on the system, before reporting that it had peaked with 1-minute sustained wind speeds of 100 km/h (60 mph).[32][33] TCWC Brisbane also reported that the system had re-intensified into a category 1 tropical cyclone during that day, before reporting that it had become a category 2 tropical cyclone with peak 10-minute sustained wind speeds of 100 km/h (60 mph).[20] The system subsequently made landfall on the Queensland east coast near Bowen and rapidly weakened over land.[20]
Ahead of Anthony's landfall on the Queensland east coast, tropical cyclone watches and warnings were issued for the region between Innisfail, St Lawrence and Charters Towers.[20] Townsville and Mackay were pre-emptively declared disaster areas to aid the recovery response, while the ports of Townsville, Mackay, Hay Point and Abbott Point were closed.[20]
Severe Tropical Cyclone Bianca[]
| Category 4 severe tropical cyclone (Australian scale) | |
| Category 2 tropical cyclone (SSHWS) | |
  | |
| Duration | 23 January – 30 January |
|---|---|
| Peak intensity | 175 km/h (110 mph) (10-min) 949 hPa (mbar) |
Early on 21 January TCWC Darwin reported that Tropical Low 12U had developed within the Gulf of Carpentaria.[34] Gradual strengthening took place and on 25 January, the Joint Typhoon Warning Center (JTWC) began monitoring the system as Tropical Cyclone 10P.[35] A few hours later, TCWC Perth upgraded the low into a Category 1 Tropical Cyclone, naming it Bianca.[36] Early on the next day, TCWC Perth further upgraded Bianca to a Category 2 Tropical Cyclone.[37] Intensification continued and late on the same day, TCWC Perth upgraded Bianca into a Category 3 Severe Tropical Cyclone.[38] The system continued to intensify and became a Category 4 severe tropical cyclone on 28 January.[39] On the same day, the system started weakening rapidly and TCWC Perth downgraded Bianca into a Category 3 Severe Tropical Cyclone.[40]
Rain and strong winds were experienced along the Kimberley coast on 25 January. On 26 January, Bianca moved away from Kimberley and weather conditions started to improve.[41] Bianca disrupted operations in Australia's major iron ore port and several oil facilities.[42] In Western Australia, preparations were underway as the system was soon expected to approach land.[43] As soon as Bianca became a category 3 Severe tropical cyclone, strong winds lashed through Pilbara suspending oil and gas production and port facilities.[44] Though Bianca was moving away and the level of risk was going down, coastal communities between Onslow and Exmouth remained on a red alert as the system intensified.[45] On 28 January, according to the media, there was a chance for Bianca to start weakening, as it was moving further south into a colder, high pressure zone.[46]
The last cyclone to track south of Perth was Cyclone Ned in 1989.[47]
Severe Tropical Cyclone Bianca was expected to make landfall around Mandurah as a weak Category 1 or strong Tropical Low late on 30 January. A Cyclone Warning was issued for the area between just north of Jurien Bay and Albany, including Perth. However, the warnings were cancelled on 30 January as Bianca dissipated south of Western Australia in the afternoon of 30 January.[48] The airmass around Bianca was responsible for giving Perth and the Southwest of WA a taste of the tropics with severe thunderstorms, unrelated to Bianca, springing up on 29 January causing damage in the Geraldton region.[49] Two deaths were attributed to damaging severe thunderstorms that formed along the storm's outer rainbands.[50]
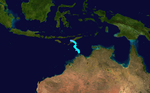
Severe Tropical Cyclone Yasi[]
| Category 5 severe tropical cyclone (Australian scale) | |
| Category 4 tropical cyclone (SSHWS) | |
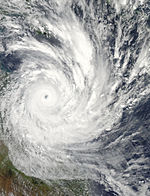  | |
| Duration | 31 January (Entered basin) – 3 February |
|---|---|
| Peak intensity | 205 km/h (125 mph) (10-min) 929 hPa (mbar) |
Yasi entered the Australian region from the South Pacific basin on 31 January. By the time Yasi crossed into the basin, preparations for the storm were under way. Media outlets referred to the storm as "what could be the state's worst cyclone in history." Many feared that the tropical cyclone could cause damage more severe than Cyclone Larry in 2006 and Cyclone Tracy, which nearly destroyed Darwin, in 1974.[51] Thousands of residents in the path of the storm were urged to evacuate by Premier Anna Bligh.[52]
Yasi crossed the Queensland coast near Mission Beach shortly after midnight (local time) on 3 February. At that time, the large destructive core around the eye extended between Innisfail and Cardwell, Queensland.[53] Yasi caused at least $3.6 billion (2011 USD) in damage, becoming the costliest tropical cyclone recorded in the Australian region.[1] Accounting for inflation, Yasi was the second-costliest tropical cyclone in Australia's history, after Cyclone Tracy. One death occurred due to asphyxiation in Ingham.[54]
Tropical Low 15U[]
| Tropical low (Australian scale) | |
| Tropical storm (SSHWS) | |
  | |
| Duration | 8 February – 13 February |
|---|---|
| Peak intensity | 55 km/h (35 mph) (10-min) 996 hPa (mbar) |
A low formed off the Western Australian coast on 8 February and drifted steadily west south west for the next few days.[55] On 11 February, the Bureau of Meteorology identified the system as Tropical Low 15U and began monitoring the system for further development.[56] Later that day, the JTWC began issuing advisories on the system under the name 14S.[57] The storm was expected to reach minimal category 1 cyclone intensity (Australian scale) on 12 February but high shear, cool sea temperatures and poor organisation saw the system stay as a low.[58]
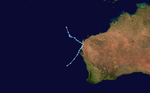
Severe Tropical Cyclone Dianne[]
| Category 3 severe tropical cyclone (Australian scale) | |
| Category 1 tropical cyclone (SSHWS) | |
  | |
| Duration | 14 February – 22 February |
|---|---|
| Peak intensity | 140 km/h (85 mph) (10-min) 960 hPa (mbar) |
Tropical Low 16U developed within a monsoon trough during 14 February, about 405 km (250 mi) to the north of Port Hedland in Western Australia.[59] Over the next few days, the system remained well offshore and was steered drifted towards the west-southwest by a ridge of high pressure while slowly developing further.[59]
A Cyclone watch was issued for the coastal communities between Onslow to Coral Bay.[60] Late on 16 February, the low formed into Tropical Cyclone Dianne whilst 445 km NW of Exmouth.[61] Dianne intensified as expected and was upgraded to a Category 2 cyclone on 18 February whilst slowly moving towards the SSW.[62] On 19 February the system intensified into a Category 3 severe tropical cyclone.[63] By late 21 February the system lost its strength as it moved into colder waters and was downgraded to a Category 1 Tropical Cyclone,[64] and by 22 February it was classified as an ex-Tropical low.[65]
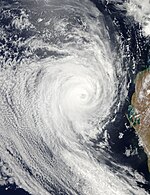
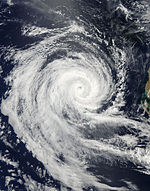
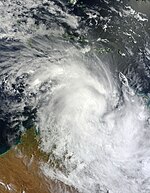
Severe Tropical Cyclone Carlos[]
| Category 3 severe tropical cyclone (Australian scale) | |
| Category 1 tropical cyclone (SSHWS) | |
  | |
| Duration | 14 February – 27 February |
|---|---|
| Peak intensity | 120 km/h (75 mph) (10-min) 969 hPa (mbar) |
On 14 February the Tropical Cyclone Warning Centre (TCWC) in Darwin reported that a tropical low formed near latitude 13.2S, longitude 130.7E, about 40 km (25 mi) west southwest of Batchelor. A severe weather warning was issued for northwest Darwin-Daly District and the Tiwi Islands.[66] Heavy rain pounded the area on 15 February with reports of Marrara recording 179.4 mm (7.06 in) and Darwin International Airport 131.0 mm (5.16 in) of rain.[67] This was later followed by 339.6 mm (13.37 in) of rain in just 24 hours, which is the highest 24-hour rainfall for the city on record.[68]
On 16 February the slow moving system strengthened into Tropical Cyclone Carlos causing localised flooding and damage to homes, with fallen trees.[69] Schools in Darwin, Darwin International Airport and East Arm Wharf were closed.[69] After looping around the Darwin area overnight and back over land the system weakened on 17 February and BOM downgraded it to a Tropical low.[70] A record three-day total of 684.8 mm (26.96 in) rain was recorded at Darwin International Airport due to the lingering of the system.[71]
The system moved slowly southwest on 18 February moving towards the Northern Territory/Western Australian border with a possibility of restrengthening.[72] The community of Daly River received 442 mm (17.4 in) of rainfall.[72] On 19 February the system passed into the Northern Kimberley region. Rainfall totals were not as large as in previous days. Wyndham recorded 90 mm (3.5 in) while Kalumburu recorded 80 mm (3.1 in) of rainfall.[73]
In the early hours of 21 February the system returned to the open waters of the Indian Ocean, causing it to redevelop back into a cyclone.[74] The system was located 75 km (47 mi) northwest of Broome.[75] The cyclone continued to track southwest at a relatively fast pace and produced a squall line that generated four tornadoes in the mining town of Karratha[76] which damaged 38 homes as well as numerous cars, buildings and a school.[77] It also strengthened steadily to become a category 2 cyclone.[78]
On 22 February the system moved parallel to the Pilbara coast. Varanus Island recorded 59 mm (2.3 in) of rainfall and the highest wind gust recorded in the area was 120 km/h (75 mph) at Bedout Island.[77] The system became more organised and on 23 February the record rainfall amount of 283 mm (11.1 in) was recorded at Barrow Island. The strongest gusts of 139 km/h (86 mph) recorded at Varanus Island.[79] The cyclone crossed the North West Cape and lashed Onslow and Exmouth with high winds up to 155 km/h (96 mph) and rain.[80]
As Carlos moved away from the western coast of Australia on 24 February it strengthened into a Severe Tropical Cyclone. Carlos also spun-off a mini tornado to Ellenbrook, Perth, Western Australia on 28 February.[81]
Tropical Low 18U[]
| Tropical low (Australian scale) | |
  | |
| Duration | 23 February – 28 February |
|---|---|
| Peak intensity | 55 km/h (35 mph) (10-min) 992 hPa (mbar) |
On 25 February, the Tropical Cyclone Warning Centre (TCWC) in Perth reported that a tropical low formed estimated to be 75 km (47 mi) west northwest of Kalumburu and 445 km (277 mi) northeast of Derby and moving slowly southwest parallel to the north Kimberly coast.[82] In the early hours of 28 February the tropical low moved inland from King Sound. Heavy rainfall was reported on the Dampier Peninsula east and southeast of Port Hedland, including Telfer and parts of the De Grey catchment.[83] Derby recorded 83 mm (3.3 in) of rain while Camballin received 142 mm (5.6 in) and the aboriginal community of Looma had 105 mm (4.1 in).[84] The tropical low continued moving overland and the BOM issued their final advisory on 28 February.
Tropical Low 23U (Cherono)[]
| Tropical low (Australian scale) | |
  | |
| Duration | 10 March – 14 March (Exited basin) |
|---|---|
| Peak intensity | Winds not specified 1006 hPa (mbar) |
On 10 March TCWC Perth reported that Tropical Low 23U, had developed within TCWC Jakarta's area of responsibility about 1,640 km (1,020 mi) to the east of Jakarta, Indonesia.[85][86] Over the next couple of days the low remained slow moving. On 13 March, the low briefly moved into TCWC Perth's area of responsibility, before crossing 90°E and moving out of the Australian region and into the South-West Indian Ocean. It later developed into Tropical Storm Cherono.
Tropical Low 25U[]
| Tropical low (Australian scale) | |
| Tropical storm (SSHWS) | |
  | |
| Duration | 26 March – 6 April |
|---|---|
| Peak intensity | 55 km/h (35 mph) (10-min) 994 hPa (mbar) |
On 26 March TCWC Darwin reported that Tropical Low 25U had developed in the western Arafura Sea, to the north of the Tiwi Islands.[20][87] Over the next few days the system slowly moved around the Arafura Sea, before TCWC Darwin initiated advisories on the low during 30 March as atmospheric convection surrounding the system organised further.[88][89]
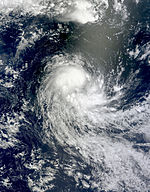
Tropical Cyclone Errol[]
| Category 2 tropical cyclone (Australian scale) | |
| Tropical storm (SSHWS) | |
  | |
| Duration | 12 April – 18 April |
|---|---|
| Peak intensity | 100 km/h (65 mph) (10-min) 986 hPa (mbar) |
During 12 April the Australian Bureau of Meteorology reported that Tropical Low 29U, had developed over the Timor Sea to the south of Timor-Leste.[20][90] Over the next couple of days the system moved southwards towards the Australian state of Kimberly and intensified gradually before it was declared a category 1 tropical cyclone and named Errol by the BoM early on 15 April.[20][90]
Other systems[]
During 15 December, Tropical Low 04U was located to the northeast of Nhulunbuy, though TCWC Darwin did not mention their low in their next bulletin.[91] On 30 December, TCWC Perth started issuing advisories on Tropical Low 06U that had developed inland over the Top End of Western Australia.[92] On 1 January, when 06U had emerged over the Indian Ocean waters, it was forecast that it would intensify into a tropical cyclone, though shear had caused the low to struggle to develop.[93] TCWC Perth issued its final advisory the next day as 06U weakened to a low-pressure area.[94] On 31 January, Tropical Low 13U developed well over in the Indian Ocean.[95] Tropical Low 19U developed over in the southern Gulf of Carpentaria on 26 February, monitored by TCWC Darwin.[96] 19U was last noted on 1 March as it was close the Northern Territory and Queensland border with a pressure of 1000 hPa.[97] During 5 March, Tropical Low 20U briefly developed about 200 km (120 mi) west of Lockhart River, Queensland.[98]
On 7 March, the BoM reported that Tropical Low 21U had developed within the Coral Sea, about 1,000 km (620 mi) to the northwest of Yeppoon, Queensland, Australia.[99] During that day, the low tracked eastwards, and gradually intensified. On 8 March it continued eastwards. Later that day, the low moved out of the Australian region, entered the South Pacific and was assigned the new designation 12F. Tropical Low 22U briefly developed during 11 March over Kimberley associated within the monsoon trough.[100] Tropical Low 26U, located north of Pilbara coast and Tropical Low 27U, over in the 90° east median, developed on 30 March.[101] Both lows did not intensify further and dissipated while last mentioned in the bulletins of TCWC Perth during 3 April, though 27U moved into the South-West Indian Ocean basin and the MFR gave the designation of 08R.[102] On 14 April, Tropical Low 28U developed to the northwest of New Caledonia until it crossed the basin into the South Pacific the next day.[103]
Season effects[]
| Name | Dates | Peak intensity | Areas affected | Damages (AU$) |
Damages (US$) |
Deaths | |||
|---|---|---|---|---|---|---|---|---|---|
| Category | Wind speed (km/h (mph)) |
Pressure (hPa) | |||||||
| Anggrek | 28 October — 4 November | Tropical low | 75 km/h (45 mph) | 995 hPa (29.38 inHg) | Cocos (Keeling) Islands | None | None | None | [17][20] |
| Abele | 3 — 4 December | Category 2 tropical cyclone | 95 km/h (60 mph) | 987 hPa (29.15 inHg) | None | None | None | None | [21] |
| 03U | 15 December — 20 December | Tropical low | 65 km/h (40 mph) | 989 hPa (29.21 inHg) | Western Australia | $100 million | $77 million | None | |
| 04U | 22–24 December | Tropical low | Not specified | Not specified | None | None | None | None | |
| Tasha | 20 — 25 December | Category 1 tropical cyclone | 75 km/h (45 mph) | 993 hPa (29.32 inHg) | Queensland | Unknown | Unknown | 1 | [nb 2] |
| 06U | 30 December — 2 January | Tropical low | 55 km/h (35 mph) | 993 hPa (29.32 inHg) | Northern Territory, Western Australia | None | None | None | |
| 07U | 30 December – 2 January | Tropical low | Not specified | Not specified | None | None | None | None | |
| 08U | 31 December – 2 January | Tropical low | Not specified | Not specified | None | None | None | None | |
| Vince | 10 — 15 January | Category 1 tropical cyclone | 75 km/h (45 mph) | 986 hPa (29.12 inHg) | None | None | None | None | |
| Zelia | 13–16 January | Category 4 severe tropical cyclone | 185 km/h (115 mph) | 943 hPa (27.85 inHg) | None | None | None | None | |
| Anthony | 21 — 30 January | Category 2 tropical cyclone | 95 km/h (60 mph) | 989 hPa (29.21 inHg) | Queensland | Minor | Minor | None | [20] |
| Bianca | 21 — 30 January | Category 4 severe tropical cyclone | 175 km/h (110 mph) | 949 hPa (28.02 inHg) | Northern Territory, Western Australia | Unknown | Unknown | 2 | |
| 13U | 31 January | Tropical low | Not specified | Not specified | None | None | None | None | |
| Yasi | 31 January - 3 February | Category 5 severe tropical cyclone | 205 km/h (125 mph) | 929 hPa (27.43 inHg) | Solomon Islands, Australia | $3.5 billion | $2.69 billion | 1 | |
| 15U | 8–13 February | Tropical low | 55 km/h (35 mph) | 1,000 hPa (29.53 inHg) | None | None | None | None | |
| Dianne | 11–22 February | Category 3 severe tropical cyclone | 140 km/h (85 mph) | 960 hPa (28.35 inHg) | Western Australia | Minimal | Minimal | None | |
| Carlos | 12–27 February | Category 3 severe tropical cyclone | 120 km/h (75 mph) | 969 hPa (28.61 inHg) | Northern Territory, Western Australia | $16 million | $12.3 million | None | |
| 18U | 23–28 February | Tropical low | 55 km/h (35 mph) | 992 hPa (29.29 inHg) | None | None | None | None | |
| 19U | 26 February – 1 March | Tropical low | Not specified | 1,000 hPa (29.53 inHg) | Northern Territory | None | None | None | |
| 20U | 5 March | Tropical low | Not specified | Not specified | None | None | None | None | |
| 21U | 7–8 March | Tropical low | 45 km/h (30 mph) | 1,004 hPa (29.65 inHg) | None | None | None | None | |
| 22U | 10–15 March | Tropical low | Not specified | Not specified | None | None | None | None | |
| 23U | 10–14 March | Tropical low | Not specified | Not specified | None | None | None | None | |
| 25U | 26 March – 6 April | Tropical low | 55 km/h (35 mph) | 994 hPa (29.35 inHg) | None | None | None | None | |
| 26U | 30 March – 1 April | Tropical low | Not specified | 1,006 hPa (29.71 inHg) | None | None | None | None | |
| 27U | 30 March – 1 April | Tropical low | Not specified | 1,006 hPa (29.71 inHg) | None | None | None | None | |
| 28U | 14–15 April | Tropical low | Not specified | Not specified | None | None | None | None | |
| Errol | 14–20 April | Category 2 tropical cyclone | 100 km/h (60 mph) | 986 hPa (29.12 inHg) | Indonesia, Western Australia, Northern Territory | None | None | None | |
| Season aggregates | |||||||||
| 28 systems | 28 October – 20 April | 205 km/h (125 mph) | 929 hPa (27.43 inHg) | $2.78 billion | 4 | ||||
See also[]
| Wikimedia Commons has media related to 2010-11 Australian region cyclone season. |
- Tropical cyclones in 2010 and 2011
- Australian region tropical cyclone
- List of Southern Hemisphere tropical cyclone seasons
- Atlantic hurricane seasons: 2010, 2011
- Pacific hurricane seasons: 2010, 2011
- Pacific typhoon seasons: 2010, 2011
- North Indian Ocean cyclone seasons: 2010, 2011
- 2010–11 South-West Indian Ocean cyclone season
- 2010–11 South Pacific cyclone season
- South Atlantic tropical cyclone
Notes[]
- ^ Number of tropical lows excludes Tropical Low 24U, which was monitored outside of the basin.
- ^ Damage from Tropical Cyclones Tasha and Anthony are not known as they both contributed to the 2010–11 Queensland floods, which caused over A$ 30 billion.
References[]
- ^ a b "Cyclone Yasi to cost insurers A$3.5 billion – forecaster". Reuters. 3 February 2011. Retrieved 5 November 2011.
- ^ a b Saunders, Mark; Lea, Adam (5 May 2010). Extended Range Forecast for Australian-Region Tropical Storm Activity in 2010/11 (PDF) (Report). Tropical Storm Risk Consortium. Retrieved 5 May 2010.
- ^ a b Saunders, Mark; Lea, Adam (6 December 2010). December Forecast Update for Australian-Region Tropical Storm Activity in 2010/11 (PDF) (Report). Tropical Storm Risk Consortium. Retrieved 6 December 2010.
- ^ Saunders, Mark; Lea, Adam (6 July 2010). July Forecast Update for Australian-Region Tropical Storm Activity in 2010/11 (PDF) (Report). Tropical Storm Risk Consortium. Retrieved 6 July 2010.
- ^ Saunders, Mark; Lea, Adam (6 September 2010). September Forecast Update for Australian-Region Tropical Storm Activity in 2010/11 (PDF) (Report). Tropical Storm Risk Consortium. Retrieved 6 September 2010.
- ^ Saunders, Mark; Lea, Adam (9 November 2010). November Forecast Update for Australian-Region Tropical Storm Activity in 2010/11 (PDF) (Report). Tropical Storm Risk Consortium. Retrieved 9 November 2010.
- ^ a b c d "SW Pacific TC guidance for the 2010–11 season". Island Climate Update. National Institute of Water and Atmospheric Research. 26 November 2010. Archived from the original on 11 January 2015. Retrieved 16 November 2014.
- ^ "Zelia consistent with tropical cyclone outlook". National Institute of Water and Atmospheric Research. 18 January 2011. Archived from the original on 11 January 2015. Retrieved 16 November 2014.
- ^ a b c d e f g National Climate Centre (18 October 2010). "2010–2011 Australian tropical cyclone season outlook". Australian Bureau of Meteorology. Retrieved 11 January 2015.
- ^ Strainig, Caroline, ed. (8 October 2010). "BoM warns that cyclone season could be worst in 27 years". mysailing.com.au. Archived from the original on 11 January 2015. Retrieved 11 January 2015.
- ^ a b "Western Australia Seasonal Tropical Cyclone Outlook" (Press release). Australian Bureau of Meteorology. 18 October 2010. Archived from the original on 6 September 2015. Retrieved 11 January 2015.
- ^ "2010/2011 Northern Territory Tropical Cyclone Season Outlook" (Press release). Australian Bureau of Meteorology. Archived from the original on 13 February 2014. Retrieved 11 January 2015.
- ^ "Seasonal Outlook 2010–11 for Queensland and the Coral Sea Region". Australian Bureau of Meteorology. Archived from the original on 6 September 2015. Retrieved 11 January 2015.
- ^ a b c National Climate Centre. "2010–11 South Pacific Tropical Cyclone Season Outlook". Australian Bureau of Meteorology. Archived from the original on 11 January 2015. Retrieved 11 January 2015.
- ^ 2010–11 Predictions of Seasonal Tropical Cyclone Activity in the Australian region (PDF) (Report). City University of Hong Kong. 12 November 2010. Retrieved 7 January 2010.
- ^ http://www.tropicalstormrisk.com/docs/TSRAUSForecastMay2010.pdf
- ^ a b Western Australian Regional Office (2010). Tropical Cyclone Anggrek (Preliminary Tropical Cyclone Report). Australian Bureau of Meteorology. Archived from the original on 2 September 2012. Retrieved 11 January 2015.
- ^ Padgett, Gary (14 December 2010). "Monthly Global Tropical Cyclone Tracks October 2010". Archived from the original on 11 January 2015. Retrieved 11 January 2015.
- ^ "Bulletin for Cyclonic Activity and Significant Tropical Weather in the Southwest Indian Ocean". Météo-France. 5 November 2010. Retrieved 8 December 2015.
- ^ a b c d e f g h i j k l m n o p q r s t u v Auden, Tony (21 June 2011). Tropical Cyclone Anthony: 23 – 31 January 2011 (PDF) (Report). Australian Bureau of Meteorology's Brisbane Tropical Cyclone Warning Centre. Retrieved 13 December 2014.
- ^ a b c d Western Australian Regional Office (2010). Tropical Cyclone Abele (Preliminary Tropical Cyclone Report). Australian Bureau of Meteorology. Archived from the original on 11 January 2015. Retrieved 11 January 2015.
- ^ a b Joint Typhoon Warning Centre (10 May 2011). "Tropical Cyclone 03S (Abele) best track analysis". United States Navy, United States Air Force. Archived from the original on 11 January 2015. Retrieved 11 January 2014.
- ^ a b c "Gascoyne River Flood". Bureau of Meteorology. 2010. Archived from the original on 11 January 2011. Retrieved 21 January 2011.
- ^ Staff Writer (25 December 2010). "Cyclone Tasha hits Queensland coast". ABC. Archived from the original on 31 January 2011. Retrieved 25 December 2010.
- ^ Staff Writer (27 December 2010). "Qld town faces 'worst flood in memory't". ABC. Archived from the original on 28 December 2010. Retrieved 27 December 2010.
- ^ Robertson, Josh; MacDonald, Andrew; Michael, Peter (27 December 2010). "Cyclone Tasha leaves Queensland waterlogged and facing b damages bill". The Courier-Mail. Archived from the original on 28 December 2010.
- ^ "Tropical Low 09U HIGH SEAS WEATHER WARNING". Bureau of Meteorology (Australia). Archived from the original on 11 January 2011. Retrieved 28 January 2011.
- ^ "Tropical Cyclone Technical Bulletin for Tropical Cyclone Vince". Tropical Cyclone Warning Centre, Perth. Archived from the original on 12 January 2011. Retrieved 28 January 2011.
- ^ "High Seas Weather Warning for Former Tropical Cyclone Vince". Tropical Cyclone Warning Centre, Perth. Archived from the original on 14 January 2011. Retrieved 28 January 2011.
- ^ Tropical Cyclone Zelia (Preliminary Tropical Cyclone Report). Australian Bureau of Meteorology. 2011. Archived from the original on 29 January 2015. Retrieved 29 January 2015.
- ^ "JTWC Tropical Cyclone 09P Warning 01". Joint Typhoon Warning Center. Archived from the original on 23 January 2011. Retrieved 28 January 2011.
- ^ "JTWC Tropical Cyclone 09P Warning 07". Joint Typhoon Warning Center. Archived from the original on 30 January 2011. Retrieved 28 January 2011.
- ^ Joint Typhoon Warning Centre (28 December 2011). "Tropical Cyclone 09P (Anthony) best track analysis". United States Navy, United States Air Force. Archived from the original on 22 July 2012. Retrieved 22 July 2012.
- ^ "Tropical Cyclone Formation Potential". Tropical Cyclone Warning Centre Darwin. Archived from the original on 21 January 2011. Retrieved 26 January 2011.
- ^ "JTWC Tropical Cyclone 10S Warning 01". Joint Typhoon Warning Center. Archived from the original on 25 January 2011. Retrieved 26 January 2011.
- ^ "Tropical Cyclone Technical Bulletin for Tropical Cyclone Bianca". Tropical Cyclone Warning Centre, Perth. Archived from the original on 25 January 2011. Retrieved 26 January 2011.
- ^ "Tropical Cyclone Technical Bulletin for Tropical Cyclone Bianca, Category 2". Tropical Cyclone Warning Centre, Perth. Archived from the original on 26 January 2011. Retrieved 26 January 2011.
- ^ "Tropical Cyclone Technical Bulletin for Severe Tropical Cyclone Bianca". Tropical Cyclone Warning Centre, Perth. Archived from the original on 26 January 2011. Retrieved 27 January 2011.
- ^ "TCWC Perth's Tropical Cyclone Advice 36 on Severe Tropical Cyclone Bianca". Tropical Cyclone Warning Centre, Perth. Archived from the original on 28 January 2011. Retrieved 28 January 2011.
- ^ "TCWC Perth Tropical Cyclone Advice 38 for Severe Tropical Cyclone Bianca". Tropical Cyclone Warning Centre, Perth. Archived from the original on 28 January 2011. Retrieved 29 January 2011.
- ^ "Cyclone Bianca moves away from the Kimberley coast". ABC Kimberley. Retrieved 26 January 2011.
- ^ "UPDATE 1-Australia cyclone shuts iron ore port, oil facilities". Thomson Reuters Foundation. 26 January 2011. Archived from the original on 14 August 2012. Retrieved 26 January 2011.
- ^ "Cyclone Bianca closes in on WA north coast". news.com.au. 26 January 2011. Retrieved 26 January 2011.
- ^ "A bit of a blow for Pilbara production". Fairfax Media. 28 January 2011. Retrieved 27 January 2011.
- ^ "Some communities remain on red alert as cyclone Bianca intensifies". ABC News — Western Australia. Retrieved 27 January 2011.
- ^ "The difference between cyclones Alby and Bianca". ABC News. Retrieved 28 January 2011.
- ^ Rimrod, Frank (29 January 2011). "It's not over yet — Perth, Bunbury in Cyclone Bianca's sights". WAToday.
- ^ "Weather News — Cyclone warning cancelled for WA". Weatherzone.com.au. 30 January 2011. Retrieved 15 June 2012.
- ^ "Archived copy". au.news.yahoo.com. Archived from the original on 18 July 2011. Retrieved 13 January 2022.
{{cite web}}: CS1 maint: archived copy as title (link) - ^ Rimrod, Frank (31 January 2011). "Bianca's forerunner brought death and destruction". WAToday. Fairfax Media. Archived from the original on 16 February 2011. Retrieved 16 February 2011.
- ^ Malkin, Bonnie (31 January 2011). "Still reeling from flooding, Queensland braces for worst ever storm". The Telegraph. Archived from the original on 31 January 2011. Retrieved 31 January 2011.
- ^ Newborn, Jaime (31 January 2011). "Premier: Get out before Yasi hits". Daily Mercury. Archived from the original on 31 January 2011. Retrieved 31 January 2011.
- ^ "Tropical Cyclone Advice 25 on Tropical Cyclone Yasi". TCWC Brisbane. Bureau of Meteorology. 2 February 2011. Archived from the original on 2 February 2011. Retrieved 2 February 2011.
- ^ Staff writers (4 February 2011). "Cyclone Yasi claims first victim". The Age. Melbourne. Archived from the original on 3 February 2011. Retrieved 4 February 2011.
- ^ "Tropical Cyclone three-day outlook for the Western Region". Tropical Cyclone Warning Centre, Perth. Archived from the original on 8 February 2011. Retrieved 13 February 2011.
- ^ "Tropical Cyclone Technical Bulletin for Tropical Low 15U". Tropical Cyclone Warning Centre, Perth. Archived from the original on 11 February 2011. Retrieved 13 February 2011.
- ^ "Tropical Cyclone Warning 01 for Tropical Cyclone 14S". Joint Typhoon Warning Center. Archived from the original on 11 February 2011. Retrieved 13 February 2011.
- ^ "Final Tropical Cyclone Technical Bulletin for Tropical Low 15U". Tropical Cyclone Warning Centre, Perth. Archived from the original on 12 February 2011. Retrieved 13 February 2011.
- ^ a b Patterson, Linda (13 June 2011). Severe Tropical Cyclone Dianne (PDF) (Tropical Cyclone Report). Australian Bureau of Meteorology. Archived (PDF) from the original on 11 March 2017. Retrieved 11 March 2017.
- ^ "TROPICAL CYCLONE WATCH — TROPICAL CYCLONE ADVICE NUMBER 1 (16U)". Tropical Cyclone Warning Centre, Perth. Archived from the original on 15 February 2011. Retrieved 15 February 2011.
- ^ "TROPICAL CYCLONE ADVICE NUMBER 6 (16U)". TCWC Perth. Bureau of Meteorology (Perth). 16 February 2011. Archived from the original on 16 February 2011. Retrieved 16 February 2011.
- ^ "TROPICAL CYCLONE ADVICE NUMBER 8 (16U)". TCWC Perth. Bureau of Meteorology (Perth). 17 February 2011. Archived from the original on 17 February 2011. Retrieved 17 February 2011.
- ^ "TROPICAL CYCLONE TECHNICAL BULLETIN (16U)". TCWC Perth. Bureau of Meteorology (Perth). 19 February 2011. Archived from the original on 16 February 2011. Retrieved 19 February 2011.
- ^ "TROPICAL CYCLONE TECHNICAL BULLETIN (16U)". TCWC Perth. Bureau of Meteorology (Perth). 21 February 2011. Archived from the original on 21 February 2011. Retrieved 21 February 2011.
- ^ "TROPICAL CYCLONE TECHNICAL BULLETIN (16U)". TCWC Perth. Bureau of Meteorology (Perth). 22 February 2011. Archived from the original on 22 February 2011. Retrieved 22 February 2011.
- ^ "TROPICAL CYCLONE WATCH — TROPICAL CYCLONE ADVICE NUMBER 1 (17U)". Tropical Cyclone Warning Center, Darwin. Archived from the original on 15 February 2011. Retrieved 15 February 2011.
- ^ Adlam, Nigel (15 February 2011). "Cyclone warning for Darwin and coast". Northern Territory News. News Limited. Archived from the original on 15 February 2011. Retrieved 15 February 2011.
- ^ "Cyclone Carlos bears down on Darwin". Weatherzone. Retrieved 16 February 2011.
- ^ a b Adlam, Nigel (16 February 2011). "Cyclone Carlos on top of Darwin". Northern Territory News. News Limited. Archived from the original on 16 February 2011. Retrieved 16 February 2011.
- ^ "TROPICAL CYCLONE ADVICE NUMBER 15 (17U)". TCWC Darwin. Bureau of Meteorology. 17 February 2012. Archived from the original on 16 February 2011. Retrieved 17 February 2012.
- ^ Dillon, Meagan (18 February 2011). "Wet season almost the wettest wet yet". Northern Territory News. News Limited. Archived from the original on 17 February 2011. Retrieved 18 February 2011.
- ^ a b Heimke, Nadja; Adlam, Nigel (19 February 2011). "Carlos on the move". Northern Territory News. News Limited. Archived from the original on 18 February 2011. Retrieved 19 February 2011.
- ^ Hickey, Paul (20 February 2011). "Cyclone warning for Kimberley coast". Perth Now. News Limited. Archived from the original on 20 February 2011. Retrieved 20 February 2011.
- ^ "TROPICAL CYCLONE ADVICE NUMBER 37 (17U)". TCWC Perth. Bureau of Meteorology. 21 February 2011. Archived from the original on 21 February 2011. Retrieved 20 February 2011.
- ^ Hickey, Paul (21 February 2011). "Flood, storm warnings as cyclone Carlos reforms". Perth Now. News Limited. Archived from the original on 21 February 2011. Retrieved 21 February 2011.
- ^ Community Contributor (21 February 2011). "Karratha town centre hit by tornado". Pilbara Echo. Archived from the original on 21 February 2011. Retrieved 21 February 2011.
{{cite web}}:|author=has generic name (help) - ^ a b Hickey, Paul; AAP (22 February 2011). "Cyclone Carlos losing strength after brushing Karratha". Perth Now. News Limited. Archived from the original on 22 February 2011. Retrieved 22 February 2011.
- ^ "TROPICAL CYCLONE ADVICE NUMBER 43 (17U)". TCWC Perth. Bureau of Meteorology. 21 February 2011. Archived from the original on 21 February 2011. Retrieved 21 February 2011.
- ^ Rickard, Lucy (23 February 2011). "Cyclone Carlos takes aim at Ningaloo tourist destinations". WAToday. Fairfax Media. Archived from the original on 23 February 2011. Retrieved 23 February 2011.
- ^ Hickey, Paul; AAP (23 February 2011). "Onslow, Exmouth blasted by 155 km/h Carlos onslaught". Perth Now. News Limited. Archived from the original on 23 February 2011. Retrieved 23 February 2011.
- ^ "TROPICAL CYCLONE TECHNICAL BULLETIN 24/1815z (17U)". TCWC Perth. Bureau of Meteorology. 24 February 2011. Archived from the original on 24 February 2011. Retrieved 24 February 2011.
- ^ "TROPICAL CYCLONE WATCH — TROPICAL CYCLONE ADVICE NUMBER 1 (18U)". Tropical Cyclone Warning Centre, Perth. Archived from the original on 25 February 2011. Retrieved 25 February 2011.
- ^ Hickey, Paul (27 February 2011). "Big wet, possible cyclone, menace Pilbara". Perth Now. News Limited. Archived from the original on 27 February 2011. Retrieved 27 February 2011.
- ^ Hickey, Paul (28 February 2011). "Big wet, possible cyclone, menace Pilbara". Perth Now. News Limited. Archived from the original on 28 February 2011. Retrieved 28 February 2011.
- ^ Unattributed (10 March 2011). "Tropical Cyclone three-day outlook for the Western Region 2011-03-10". TCWC Perth. Bureau of Meteorology. Archived from the original on 11 March 2011. Retrieved 11 March 2011.
- ^ Unattributed (10 March 2011). "Tropical Cyclone three-day outlook for the Western Region 2011-03-11". TCWC Perth. Bureau of Meteorology. Archived from the original on 11 March 2011. Retrieved 11 March 2011.
- ^ Darwin Regional Forecasting Centre (26 March 2011). "Tropical Cyclone Outlook for the Northern Region, including the Gulf of Carpentaria 26 March 2011". Australian Bureau of Meteorology. Archived from the original on 28 March 2011. Retrieved 29 December 2014.
- ^ Darwin Tropical Cyclone Warning Centre (30 March 2011). "Tropical Cyclone Technical Bulletin: Australia: Northern Region: 30 March 2011: 07:43 UTC". Australian Bureau of Meteorology. Archived from the original on 30 March 2011. Retrieved 29 December 2014.
- ^ Darwin Regional Forecasting Centre (30 March 2011). "Tropical Cyclone Advice Number 1: 30 March 2011: 11:00 CST". Australian Bureau of Meteorology. Archived from the original on 30 March 2011. Retrieved 29 December 2014.
- ^ a b Western Australian Regional Office. Tropical Cyclone Errol (Report). Australian Bureau of Meteorology. Retrieved 3 January 2015.
- ^ https://www.webcitation.org/5v09b0x7F?url=http://www.bom.gov.au/nt/forecasts/tcoutlook.shtml
- ^ "Tropical Low 06U 06Z 30 Dec 2010". Australian Bureau of Meteorology. 30 December 2010. Archived from the original on 30 December 2010.
- ^ "Tropical Low 06U 12Z 1 Jan 2011". Australian Bureau of Meteorology. 1 January 2011. Archived from the original on 1 January 2011.
- ^ "Tropical Low 06U 06Z 2 Jan 2011". Australian Bureau of Meteorology. 2 January 2011. Archived from the original on 2 January 2011.
- ^ "Tropical Cyclone Three-Day Outlook for the Western Region on Monday 31st of January 2011". Australian Government Bureau of Meteorology. 31 January 2011. Archived from the original on 1 February 2011.
- ^ "Tropical Cyclone Three-Day Outlook for Northern Region on Saturday 26th of February 2011". Australian Government Bureau of Meteorology. 26 February 2011. Archived from the original on 26 February 2011.
- ^ "Tropical Cyclone Three-Day Outlook for Northern Region on Tuesday 1st of March 2011". Australian Government Bureau of Meteorology. 1 March 2011. Archived from the original on 1 March 2011.
- ^ "Tropical Cyclone Three-Day Outlook for Coral Sea on Saturday 5th of March 2011". Australian Government Bureau of Meteorology. 5 March 2011. Archived from the original on 5 March 2011.
- ^ https://www.webcitation.org/5x0BfmJmR?url=http://weather.noaa.gov/pub/data/raw/ax/axau21.abrf..txt
- ^ "Tropical Cyclone Three-Day Outlook for the Western Region on Friday 11th of March 2011". Australian Government Bureau of Meteorology. 11 March 2011. Archived from the original on 11 March 2011.
- ^ "Tropical Cyclone Three-Day Outlook for the Western Region on Wednesday 30th of March 2011". Australian Government Bureau of Meteorology. 30 March 2011. Archived from the original on 30 March 2011.
- ^ "Tropical Cyclone Three-Day Outlook for the Western Region on Sunday 3rd of April 2011". Australian Government Bureau of Meteorology. 3 April 2011. Archived from the original on 3 April 2011.
- ^ https://www.webcitation.org/5xy6m6uz6?url=http://weather.noaa.gov/pub/data/raw/ww/wwso21.abrf..txt
External links[]
- World Meteorological Organization
- Bureau of Meteorology (TCWC's Perth, Darwin & Brisbane)
- Tropical Cyclone Warning Center Jakarta
- Joint Typhoon Warning Center (JTWC)
Tropical cyclones of the 2010–11 Australian region cyclone season | ||
|---|---|---|
 | ||
| ||
Warning: Default sort key "2010-11 Australian Region Cyclone Season" overrides earlier default sort key "2010-11 Australian Region Cyclone season".
- Australian region cyclone seasons
- Tropical cyclones in 2010
- Tropical cyclones in 2011