Tropical cyclones in 2011
This article needs additional citations for verification. (August 2020) |
| Tropical cyclones in 2011 | |
|---|---|
 Year summary map | |
| Year boundaries | |
| First system | 03 |
| Formed | January 2, 2011 |
| Last system | Benilde |
| Dissipated | January 4, 2012 |
| Strongest system | |
| Name | Songda |
| Lowest pressure | 920 mbar/hPa; 27.17 inHg |
| Longest lasting system | |
| Name | Philippe |
| Duration | 14 days |
| Year statistics | |
| Total systems | 131 |
| Named systems | 71 |
| Total fatalities | 3,702 total |
| Total damage | $29.86 billion (2011 USD) |

During 2011, tropical cyclones formed within seven different tropical cyclone basins, located within various parts of the Atlantic, Pacific and Indian Oceans. During the year, a total of 131 tropical cyclones had formed this year to date. 71 tropical cyclones had been named by either a Regional Specialized Meteorological Center (RSMC) or a Tropical Cyclone Warning Center (TCWC). Thirty-nine of these named systems eventually intensified into hurricane-equivalent tropical cyclones.
The most active basin in the year was the Western Pacific, which documented 21 named storms. North Atlantic basin documented 19 named storms, continuing the consecutive third-most active season trends from the previous year, due to the 2010–12 La Niña event. Conversely, the Eastern Pacific basin featured slightly more activity than the previous season, with 11 named storms. The least active basin in the year was the North Indian Ocean basin which documented only 2 named storms, the lowest since the 1993 season. Activity across the Southern Hemisphere were almost evenly spread, with the South-West Indian Ocean basin recording 10 tropical cyclones, the Australian region recording 17 tropical cyclones, and the South Pacific basin also recording 10 tropical cyclones, respectively. Three Category 5 tropical cyclones were formed in 2011.
The strongest tropical cyclone of the year was Typhoon Songda, with a minimum central pressure of 920 hPa (mbar). The costliest tropical cyclone of the year was Hurricane Irene, which caused $14.2 billion worth of damage. The deadliest tropical cyclone of the year was Severe Tropical Storm Washi, which killed 2,546 people.
Global atmospheric and hydrological conditions[]
This section is empty. You can help by . (December 2020) |
Summary[]

Systems[]
January[]

During January 2011, a total of 12 tropical cyclones, all of them, formed within the southern hemisphere. No tropical cyclone was observed in the northern hemisphere. Of the systems, 7 further intensified to become named. Out of the systems, Wilma was the most intense tropical cyclone, with a minimum barometric pressure of 935 mbar/hPa.
| Storm name | Dates active | Max wind km/h (mph) |
Pressure (hPa) |
Areas affected | Damage (USD) |
Deaths | Refs |
|---|---|---|---|---|---|---|---|
| 03 | January 2–3 | 55 (35) | 996 | Madagascar | None | None | [1] |
| Vania | January 5–15 | 100 (65) | 973 | Vanuatu, Fiji, New Caledonia, New Zealand | unknown | unknown | |
| 04F | January 5–7 | Not Specified | 1002 | New Caledonia | None | None | |
| Vince | January 10—15 | 75 (45) | 986 | None | None | None | |
| Zelia | January 12—17 | 185 (115) | 943 | New Caledonia, Norfolk Island, New Zealand | None | None | |
| Wilma | January 19–29 | 185 (115) | 935 | Samoan Islands, Tonga, New Zealand | $22 million | 3 | [2] |
| 07F | January 20–22 | 65 (40) | 996 | New Caledonia | None | None | |
| Anthony | January 22–31 | 95 (60) | 989 | Queensland | Minor | None | |
| Bianca | January 23–30 | 175 (110) | 949 | Northern Territory, Western Australia | Unknown | 2 | [3] |
| Yasi | January 26–February 3 | 205 (125) | 929 | Tuvalu, Fiji, Solomon Islands, Vanuatu, Papua New Guinea, Australia | $3.6 billion | 1 | |
| 04 | January 30–31 | 45 (30) | 998 | Réunion | None | None | |
| 13U | January 31 | Not Specified | Not Specified | None | None | None |
February[]

10 systems formed and 5 named storms during February.
| Storm name | Dates active | Max wind km/h (mph) |
Pressure (hPa) |
Areas affected | Damage (USD) |
Deaths | Refs |
|---|---|---|---|---|---|---|---|
| BOB 01 | February 2–3 | 45 (30) | 1002 | Sri Lanka | 297 million | 18 | [4] |
| Zaka | February 5–7 | 95 (60) | 985 | None | None | None | |
| 15U | February 8–13 | 55 (35) | 996 | None | None | None | |
| Bingiza | February 9–17 | 155 (100) | 957 | Comoros, Madagascar | Unknown | 34 | |
| Atu | February 13–24 | 165 (105) | 940 | Vanuatu | Unknown | None | |
| Dianne | February 14–22 | 140 (85) | 960 | Western Australia | Minimal | None | |
| Carlos | February 14–27 | 120 (75) | 969 | Northern Territory, Western Australia | $12.3 million | None | |
| 06 | February 15–18 | 45 (30) | 1000 | None | None | None | |
| 18U | February 23–28 | 55 (35) | 992 | None | None | None | |
| 19U | February 26–March 1 | Not Specified | 1000 | Northern Territory | None | None |
March[]

March was a relatively inactive month in which 11 systems formed, and only 3 received names.
| Storm name | Dates active | Max wind km/h (mph) |
Pressure (hPa) |
Areas affected | Damage (USD) |
Deaths | Refs |
|---|---|---|---|---|---|---|---|
| 20U | March 5 | Not Specified | Not Specified | None | None | None | |
| 21U | March 7–8 | 45 (30) | 1004 | None | None | None | |
| 12F | March 7–9 | 45 (30) | 1002 | Vanuatu | None | None | |
| 22U | March 10–15 | Not Specified | Not Specified | None | None | None | |
| Cherono | March 10–23 | 75 (45) | 993 | Rodrigues Island | None | None | |
| Arani | March 14–16 | 85 (50) | 989 | Brazil | None | None | |
| Bune | March 22 – 29 | 130 (80) | 967 | Fiji | None | None | |
| 25U | March 26–April 6 | 55 (35) | 994 | None | None | None | |
| 08 | March 29–31 | 45 (30) | 1004 | None | None | None | |
| 26U | March 30–April 1 | Not Specified | 1006 | None | None | None | |
| 27U | March 30–April 1 | Not Specified | 1006 | None | None | None |
April[]


| Storm name | Dates active | Max wind km/h (mph) |
Pressure (hPa) |
Areas affected | Damage (USD) |
Deaths | Refs |
|---|---|---|---|---|---|---|---|
| 01W | April 1–4 | 55 (35) | 1004 | None | None | None | |
| Amang | April 3–6 | 55 (35) | 1000 | Mariana Islands | None | None | |
| 14F | April 10–11 | Not Specified | 1005 | Vanuatu | None | None | |
| 09 | April 11–16 | 95 (60) | 985 | None | None | None | |
| 28U | April 14–15 | Not Specified | Not Specified | None | None | None | |
| Errol | April 14–20 | 100 (65) | 986 | Indonesia, Western Australia, Northern Territory | None | None | |
| 15F | April 15–17 | 55 (35) | 999 | None | None | None | |
| 16F | April 28–30 | Not Specified | 1002 | None | None | None |
May[]

May was a mostly inactive month in which only 4 tropical cyclones formed, in which 2 received names.
| Storm name | Dates active | Max wind km/h (mph) |
Pressure (hPa) |
Areas affected | Damage (USD) |
Deaths | Refs |
|---|---|---|---|---|---|---|---|
| Aere | May 5–12 | 75 (45) | 992 | Philippines, Japan | $34.4 million | 48 | |
| 17F | May 10–11 | 55 (35) | 1000 | None | None | None | |
| Songda | May 19–29 | 195 (120) | 920 | Micronesia, Philippines, Japan | $287 million | 17 | |
| TD | May 31–June 1 | Not specified | 1004 | None | None | None |
June[]

| Storm name | Dates active | Max wind km/h (mph) |
Pressure (hPa) |
Areas affected | Damage (USD) |
Deaths | Refs |
|---|---|---|---|---|---|---|---|
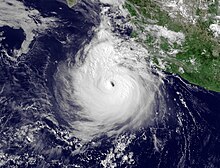
| Adrian | June 7–12 | 220 (140) | 944 | Southwestern Mexico | None | None | |
| Sarika (Dodong) | June 8–11 | 75 (45) | 996 | Philippines, China | $248 million | 28 | |
| ARB 01 | June 11–12 | 45 (30) | 996 | India | None | None | |
| TD | June 14–15 | Not specified | 1004 | China | None | None | |
| Haima (Egay) | June 16–25 | 75 (45) | 985 | Philippines, China, Vietnam, Laos, Thailand | $167 million | 18 | |
| BOB 02 | June 16–23 | 65 (40) | 978 | India | None | 6 | |
| Beatriz | June 19–22 | 150 (90) | 977 | Southwestern and Western Mexico | None | 4 | |
| Meari (Falcon) | June 20–27 | 110 (70) | 970 | Philippines, China, Japan, Korea | $1.24 million | 11 | |
| Arlene | June 28–July 1 | 100 (65) | 993 | Central America, Mexico, Texas, Florida | $223.4 million | 22 |
July[]
| Storm name | Dates active | Max wind km/h (mph) |
Pressure (hPa) |
Areas affected | Damage (USD) |
Deaths | Refs |
|---|---|---|---|---|---|---|---|
| Calvin | July 7–10 | 130 (80) | 984 | None | None | None | |
| Goring | July 8–10 | 45 (30) | 1000 | Taiwan, China | None | None | |
| Ma-on (Ineng) | July 11–24 | 175 (110) | 935 | Northern Mariana Islands, Japan | $50 million | 5 | |
| Tokage (Hanna) | July 13–15 | 65 (40) | 1000 | None | None | None | |
| TD | July 16–17 | Not specified | 1000 | China | None | None | |
| Bret | July 17–22 | 110 (70) | 995 | Bahamas, Bermuda, East Coast of the United States | None | None | |
| Dora | July 18–24 | 250 (155) | 929 | Southwestern Mexico, Western Mexico, Baja California Peninsula, Southwestern United States | Minimal | None | |
| Cindy | July 20–22 | 110 (70) | 994 | Bermuda | None | None | |
| LAND 01 | July 22–23 | 35 (25) | 990 | India | None | None | |
| Nock-ten (Juaning) | July 24–31 | 95 (60) | 985 | Philippines, China, Vietnam, Laos, Thailand | $126 million | 128 | |
| Muifa (Kabayan) | July 25–August 9 | 175 (110) | 930 | Micronesia, Caroline Islands, Philippines, Japan, China, Korea, Russia | $480 million | 22 | |
| Don | July 27–30 | 85 (50) | 997 | Cuba, Yucatán Peninsula, Northeastern Mexico, Texas | None | None | |
| Lando | July 31–August 2 | Not specified | 1002 | Philippines | None | None | |
| Eugene | July 31–August 6 | 220 (140) | 942 | None | None | None |
August[]

August was the most active month of 2011, with 18 systems forming in the month.
| Storm name | Dates active | Max wind km/h (mph) |
Pressure (hPa) |
Areas affected | Damage (USD) |
Deaths | Refs |
|---|---|---|---|---|---|---|---|
| Emily | August 2–7 | 85 (50) | 1003 | Antilles, Florida, Bahamas | $5 million | 5 | |
| Merbok | August 2–9 | 95 (60) | 980 | None | None | None | |
| TD | August 2–4 | 55 (35) | 1008 | Japan | None | None | |
| 13W | August 8–14 | 55 (35) | 1004 | None | None | None | |
| TD | August 8–10 | 55 (35) | 1008 | None | None | None | |
| Franklin | August 12–13 | 75 (45) | 1004 | Bermuda | None | None | |
| Gert | August 13–16 | 100 (65) | 1000 | Bermuda | None | None | |
| Fernanda | August 15–19 | 110 (70) | 992 | None | None | None | |
| Greg | August 16–21 | 140 (85) | 979 | None | None | None | |
| Harvey | August 19–22 | 100 (65) | 994 | Lesser Antilles, Hispaniola, Central America, Mexico | Minimal | 5 | |
| TD | August 20–25 | 55 (35) | 1004 | None | None | None | |
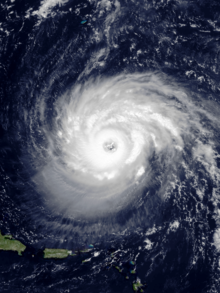
| Irene | August 21–28 | 195 (120) | 942 | Lesser Antilles, Greater Antilles, Turks and Caicos, Bahamas, East Coast of the United States, Vermont, Atlantic Canada | $14.2 billion | 58 | |
| Nanmadol | August 21–31 | 185 (115) | 925 | Philippines, Taiwan, China | $1.49 billion | 38 | |
| Talas | August 23–September 5 | 95 (60) | 970 | Japan | $600 million | 82 | |
| Ten | August 25–26 | 55 (35) | 1006 | None | None | None | |
| Jose | August 26–29 | 75 (45) | 1006 | Bermuda | None | None | |
| Katia | August 29–September 10 | 220 (140) | 942 | Lesser Antilles, East Coast of the United States, Canada, United Kingdom | $157 million | 4 | |
| Eight-E | August 31–September 1 | 55 (35) | 1002 | Southwestern Mexico, Western Mexico | None | None |
September[]


September was a below-average month, with only 16 tropical cyclones forming in that month.
| Storm name | Dates active | Max wind km/h (mph) |
Pressure (hPa) |
Areas affected | Damage (USD) |
Deaths | Refs |
|---|---|---|---|---|---|---|---|
| Unnamed | September 1–3 | 75 (45) | 1002 | None | None | None | |
| Lee | September 2–5 | 95 (60) | 986 | Gulf Coast of the United States, Eastern United States | $2.8 billion | 18 | |
| Noru | September 2–6 | 75 (45) | 990 | None | None | None | |
| Kulap (Nonoy) | September 6–11 | 65 (40) | 1000 | Japan, Korea | None | None | |
| Maria | September 6–16 | 130 (80) | 983 | Lesser Antilles, Bermuda, Newfoundland, Europe | $1.3 million | None | |
| Nate | September 7–11 | 120 (75) | 994 | Mexico | Minimal | 5 | |
| Roke (Onyok) | September 8–22 | 155 (100) | 940 | Japan, Russia, Alaska | $1.2 billion | 13 | |
| TD | September 13–15 | Not specified | 1002 | Taiwan | None | None | |
| Sonca | September 14–20 | 130 (80) | 970 | None | None | None | |
| Ophelia | September 20–October 3 | 220 (140) | 940 | Leeward Islands, Bermuda, Newfoundland | Minimal | None | |
| Hilary | September 21–30 | 230 (145) | 942 | Southwestern Mexico | Minimal | None | |
| BOB 03 | September 22–23 | 45 (30) | 995 | India | Unknown | 42 | |
| Nesat (Pedring) | September 23–30 | 150 (90) | 950 | Philippines, China, Vietnam | $2.12 billion | 98 | |
| Haitang | September 24–27 | 65 (40) | 996 | China, Vietnam, Laos | $20 million | 25 | |
| Philippe | September 24–October 8 | 150 (90) | 976 | Cape Verde | None | None | |
| Nalgae (Quiel) | September 26–October 5 | 175 (110) | 935 | Philippines, China, Vietnam | $250 million | 18 |
October[]

| Storm name | Dates active | Max wind km/h (mph) |
Pressure (hPa) |
Areas affected | Damage (USD) |
Deaths | Refs |
|---|---|---|---|---|---|---|---|
| Jova | October 6–13 | 205 (125) | 955 | Southwestern Mexico, Western Mexico | ≥$204 million | 9 | |
| Irwin | October 6–16 | 155 (100) | 976 | Western Mexico | None | None | |
| Banyan (Ramon) | October 9–14 | 65 (40) | 1002 | Palau, Philippines | $2.1 million | 10 | |
| TD | October 10–13 | Not specified | 1006 | China, Vietnam | None | None | |
| Twelve-E | October 12 | 35 (55) | 1004 | Southwestern Mexico, Central America | Unknown | 30 | |
| BOB 04 | October 19–20 | 55 (35) | 1002 | Bangladesh, Myanmar | 1.64 million | 215 | |
| Rina | October 23–28 | 185 (115) | 966 | Central America, Yucatán Peninsula, Cuba, Florida | $2.3 million | None | |
| Keila | October 29–November 4 | 65 (40) | 996 | Oman, Yemen | $80 million | 14 |
November[]

November was inactive with only 7 tropical cyclones forming, as well as Rolf, a system that formed in the Mediterranean sea.
| Storm name | Dates active | Max wind km/h (mph) |
Pressure (hPa) |
Areas affected | Damage (USD) |
Deaths | Refs |
|---|---|---|---|---|---|---|---|
| ARB 03 | November 6–10 | 55 (35) | 1000 | None | None | None | |
| Rolf | November 6–9 | 85 (50) | 991 | Italy, France, Switzerland, Spain | >$1.25 billion | 12 | |
| 24W | November 7–10 | 45 (30) | 1004 | Vietnam | None | None | |
| Sean | November 8–11 | 100 (65) | 982 | Bermuda | Minimal | 1 | |
| 01F | November 13–16 | Not Specified | 1004 | Fiji | None | None | |
| Kenneth | November 19–25 | 230 (145) | 940 | None | None | None | |
| ARB 04 | November 26–December 1 | 55 (35) | 998 | Lakshadweep, India, Sri Lanka, Maldives | Unknown | 19 |
December[]

| Storm name | Dates active | Max wind km/h (mph) |
Pressure (hPa) |
Areas affected | Damage (USD) |
Deaths | Refs |
|---|---|---|---|---|---|---|---|
| Alenga | December 3–11 | 140 (85) | 972 | None | None | None | |
| 25W | December 4–5 | 45 (30) | 1006 | Brunei, Malaysia | None | None | |
| 02 | December 6–9 | 55 (35) | 998 | Mauritius | None | None | |
| 26W | December 10–14 | 55 (35) | 1004 | Philippines | None | 4 | |
| Washi (Sendong) | December 13–19 | 95 (60) | 992 | Philippines, Micronesia, Palau | $97.8 million | 2,546 | |
| Fina | December 18–23 | 65 (40) | 994 | Papua New Guinea, New Caledonia | None | None | |
| 03 | December 19–23 | 55 (35) | 1000 | Madagascar | None | None | |
| Benilde | December 21–January 4 | 150 (90) | 968 | None | None | None | |
| Grant | December 21–January 2 | 100 (65) | 978 | Northern Territory | Minor | None | |
| TD | December 24 | Not specified | 1002 | None | None | None | |
| Thane | December 25–December 31 | 140 (85) | 969 | India, Sri Lanka | $235 million | 46 | |
| 05U | December 26–28 | Not Specified | Not Specified | None | None | None | |
| 02F | December 28–January 1 | Not Specified | 1002 | Niue, Cook Islands | None | None | |
| TD | December 31–January 1 | Not specified | 1008 | Malaysia | None | None |
Global effects[]
- ^ The sum of the number of systems and fatalities in each basin will not equal the number shown as the total. This is because when systems move between basins, it creates a discrepancy in the actual number of systems and fatalities.
See also[]
Notes[]
1The "strength" of a tropical cyclone is measured by the minimum barometric pressure, not wind speed. Most meteorological organizations rate the intensity of a storm by this figure, so the lower the minimum pressure of the storm, the more intense or "stronger" it is considered to be.
2 Only systems that formed either on or after January 1, 2011 are counted in the seasonal totals.
3 Only systems that formed either before or on December 31, 2011 are counted in the seasonal totals.
4 The wind speeds for this tropical cyclone/basin are based on the IMD Scale which uses 3-minute sustained winds.
5 The wind speeds for this tropical cyclone/basin are based on the Saffir Simpson Scale which uses 1-minute sustained winds.
6The wind speeds for this tropical cyclone are based on Météo-France which uses wind gusts.
References[]
- ^ "WebCite query result". www.webcitation.org. Retrieved 2020-08-24. Cite uses generic title (help)
- ^ "WebCite query result". www.webcitation.org. Retrieved 2020-08-28. Cite uses generic title (help)
- ^ Rimrod, Fran (2011-01-30). "Bianca's forerunner brought death and destruction". The Sydney Morning Herald. Retrieved 2020-08-29.
- ^ "Sri Lanka: Monsoon Flood Update Situation Report 13" (PDF). UN Office for the Coordination of Humanitarian Affairs. ReliefWeb. February 11, 2011. Retrieved August 29, 2020.
External links[]
| Tropical cyclone year articles (2010–2019) |
|---|
| 2010, 2011, 2012, 2013, 2014, 2015, 2016, 2017, 2018, 2019 |
Regional Specialized Meteorological Centers
- US National Hurricane Center – North Atlantic, Eastern Pacific
- Central Pacific Hurricane Center – Central Pacific
- Japan Meteorological Agency – NW Pacific
- India Meteorological Department – Bay of Bengal and the Arabian Sea
- Météo-France – La Reunion – South Indian Ocean from 30°E to 90°E
- Fiji Meteorological Service – South Pacific west of 160°E, north of 25° S
Tropical Cyclone Warning Centers
- Meteorology, Climatology, and Geophysical Agency of Indonesia – South Indian Ocean from 90°E to 141°E, generally north of 10°S
- Australian Bureau of Meteorology (TCWC's Perth, Darwin & Brisbane) – South Indian Ocean & South Pacific Ocean from 90°E to 160°E, generally south of 10°S
- Papua New Guinea National Weather Service – South Pacific Ocean from 141°E to 160°E, generally north of 10°S
- Meteorological Service of New Zealand Limited – South Pacific west of 160°E, south of 25°S
![]() This article incorporates public domain material from websites or documents of the National Weather Service.
This article incorporates public domain material from websites or documents of the National Weather Service.
- Tropical cyclones by year