Tropical cyclones in 2019
This article needs additional citations for verification. (December 2020) |
| Tropical cyclones in 2019 | |
|---|---|
 Year summary map | |
| Year boundaries | |
| First system | Mona |
| Formed | December 28, 2018 |
| Last system | Sarai |
| Dissipated | January 2, 2020 |
| Strongest system | |
| Name | Halong |
| Lowest pressure | 905 mbar/hPa; 26.72 inHg |
| Longest lasting system | |
| Name | Oma |
| Duration | 15 days |
| Year statistics | |
| Total systems | 150 |
| Named systems | 102 |
| Total fatalities | 2,096 total |
| Total damage | > $60.87 billion (2019 USD) |

During 2019, tropical cyclones formed within seven different tropical cyclone basins, located within various parts of the Atlantic, Pacific and Indian Oceans. During the year, a total of 150 systems formed with 102 of these developing further and were named by the responsible warning centre. The strongest tropical cyclone of the year was Typhoon Halong, which was estimated to have a minimum barometric pressure of 905 hPa (26.72 inHg), Halong also has the highest wind-speed, with 1-minute sustained wind speed of 305 kilometres per hour (190 mph).
Similar to the previous year, 2019 was above average in terms of the number of storms. The most active basin in the year was the Western Pacific, which documented 29 named systems. The Eastern Pacific had an average season, although many of the storms were rather weak and short-lived, therefore the number of hurricanes was the least since 2010 (7). The North Atlantic hurricane season experienced an above average number of tropical storm intensity systems, numbering 18, though most were rather weak and short-lived, especially late in the season. In the North Indian Ocean basin it was extremely active, breaking many records. This included Cyclone Kyarr, the second-strongest Arabian Sea Cyclone on record and one of the strongest cyclone ever in the North Indian Ocean. Activity across the southern hemisphere's three basins – South-West Indian, Australian, and South Pacific – was fairly significant, with the regions recording 25 named storms altogether, with the most intense Southern Hemisphere cyclone of the year, Cyclone Ambali from the Southwest Indian Ocean basin peaking at 155 miles per hour (249 km/h) and 930 millibars. Eight Category 5 tropical cyclones were formed in 2019.
The deadliest tropical cyclone of the year was Intense Tropical Cyclone Idai in the South-West Indian Ocean, which killed at least 1,303 people in Mozambique, Malawi, Zimbabwe, and Madagascar and the costliest tropical cyclone of the year was Typhoon Hagibis in the Western Pacific Ocean, which caused more than $15 billion in damage after striking Japan.
Global atmospheric and hydrological conditions[]
This section needs expansion. You can help by . (December 2020) |
There is a previous El Niño episode continuing from last year, and new El Niño episode started this year, lasting until 2020.[1][2]
Summary[]

North Atlantic Ocean[]

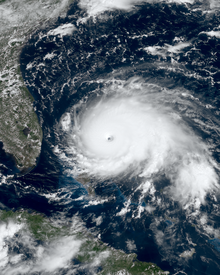
The North Atlantic Ocean experienced their fourth-most active season on record, tied with 1969, at 18 named storms. Most of the storms were weak and short-lived, possibly because of moderately high wind shear that persisted throughout the season. Sea surface temperatures, however, were quite high for tropical cyclone development. Saharan dust counts were fairly sedate throughout the month of September. Andrea, Melissa, and Rebekah were the only storms to become subtropical storms throughout some portion of their lives (Andrea and Rebekah were subtropical for their whole lives). The North Atlantic basin featured a record fifth consecutive year for tropical or subtropical development before the month of June, which the record continues when Tropical Storms Arthur and Bertha form on May 16 and 27, 2020, yet marking the sixth year of tropical development before the season actually starts. The 2019 Atlantic hurricane season featured 20 tropical depressions, 18 named storms, 6 hurricanes, and 3 major hurricanes with 2 as Category 5 hurricanes.[3] Hurricane Dorian was the strongest tropical cyclone for the basin in 2019. Dorian peaked with a strength of 185 miles per hour, and peaked at an intensity of 910 hPa/mbar.[4] Dorian is the record-tying strongest landfalling Atlantic hurricane. The record is tied with the Great 1935 Labor Day hurricane. The accumulated cyclone energy (ACE) index value for the individual basin is 132 units, which is only dubbed "above normal", despite the high count of named storms of 18.
Eastern & Central Pacific Ocean[]

The Eastern portions of the Pacific Ocean was only moderately active, likely because of a weakening El Niño trend that started in late July. The 2019 Pacific hurricane season featured 21 tropical depressions, 19 named storms, 7 hurricanes, and 4 major hurricanes. The first tropical depression didn't form until June 25; which is the latest start on record, since reliable records were kept in 1971, that a first tropical cyclone ever formed. Alvin, the first tropical storm of the season, did eventually become the first hurricane of the 2019 Pacific hurricane season. Barbara, the strongest hurricane of the basin in 2019, was short-lived. However, Barbara did eventually undergo rapid intensification and peaked as a high end Category 4 hurricane on the modern-day Saffir–Simpson Hurricane Wind Scale. Barbara encountered large portions of wind shear and weakened very rapidly. Barbara's remnants did eventually reach Hawaii, but little to no damage was reported. No hurricanes formed in August. It wasn't until September 1 that the next hurricane formed; Juliette; a high-end Category 3 major hurricane. Tropical Storm Akoni was the first storm of the Central Pacific, as well as the second time the name has been used; the first usage was in 1982. Hurricane Kiko was the longest-lived Pacific hurricane of 2019 that tracked mostly over open waters. Lorena was the most serious hurricane of the season, but minor damage was reported. Tropical Storm Narda did make small impacts in Mexico, but they weren't too serious. Tropical Storm Ema was the second and last storm of the Central Pacific. Tropical Depression Twenty-One-E concluded the season when it dissipated on November 17. The total ACE in the basin is 97.9875 units, which is considered "near normal".
Western Pacific Ocean[]

The Western Pacific typhoon region was fairly above average. It was the costliest Pacific typhoon season on record, breaking the record set by the previous year. the 2019 Pacific typhoon season featured 51 tropical depressions, 29 tropical storms, 17 typhoons, and 5 (unofficial) super typhoons, with 4 attaining Category 5 status. Typhoon Wutip was a rare February Category 5 super typhoon. No other storms strengthened to typhoons until Typhoon Francisco formed in early August. Typhoon Lekima followed it, which later caused extensive damage in South China. Many more tropical storms and typhoons followed. Typhoon Hagibis was the costliest typhoon of the season and on record, inflicting US$15 billion after making landfall on Japan as a Category 1 typhoon. (unadjusted for 2020 inflation). Typhoon Halong became the most intense storm of the season, as well as the most intense of the whole year, peaking at 905 hPa. Typhoons Kammuri and Phanfone wreaked major havoc in the Philippines in December 2019; Kammuri with its Category 4 landfall, and Phanfone with its high death toll as a prolonged Category 2 typhoon. The accumulated cyclone energy (ACE) index of this season amounted to 269 units, which is considered "above normal".
North Indian Ocean[]

The season was the most active North Indian Ocean cyclone season ever recorded in terms of cyclonic storms, though the 1992 season saw more tropical storms according to the Joint Typhoon Warning Center. The season featured 12 depressions, 11 deep depressions, 8 cyclonic storms, a record 6 severe cyclonic storms, a record 6 very severe cyclonic storms, a record 3 extremely severe cyclonic storms, and 1 super cyclonic storm, Kyarr, the first since Cyclone Gonu in 2007. Additionally, it was also the third-costliest season recorded in the North Indian Ocean, only behind the 2020 and 2008 seasons.
Amid a weak El Niño event, the season's first named storm, Pabuk, entered the basin on January 4, becoming the earliest-forming cyclonic storm of the North Indian Ocean on record, tying with the 2014 season. The second cyclonic storm of the season, Fani, formed on April 26. Fani became an extremely severe cyclonic storm on April 30, reaching the equivalent of Category 5 status on the Saffir–Simpson scale, then made landfall in India killing 89 people between Odisha and Bangladesh; Fani caused $8.1 billion in damage.
In early June, a strong pulse of the Madden–Julian oscillation (MJO) led to the development of the third cyclonic storm, Vayu, which formed June 10 in the Arabian Sea near the Maldives. The storm subsequently intensified into a very severe cyclonic storm on June 12, after moving northwestward towards northwestern India and Pakistan. No tropical cyclones formed in the month of July. Deep Depression BOB 03 formed on August 7 before impacting East India and Bangladesh. In late September, Deep Depression ARB 02 formed near Gujarat and intensified into the fourth cyclonic storm of the season, Hikaa. Cyclonic Storm Kyarr formed on October 24 and three days later became the first super cyclonic storm since Cyclone Gonu in 2007. The sixth cyclonic storm and a record-breaking fifth very severe cyclonic storm, Cyclone Maha, formed on October 30 after Kyarr dissipated on November 1. Soon afterward, on November 6, the remnants of Severe Tropical Storm Matmo crossed the Southeast Asia overland and again consolidated into a depression. It further rapidly intensified into Very Severe Cyclonic Storm Bulbul. Three more Deep Depressions formed in Arabian Sea in quick succession early in the month of December, of which one strengthened into the eighth cyclone of the season, Cyclone Pawan, which made landfall in Somalia on December 6.
The high amount of activity in the Arabian Sea was related to the strongest Indian Ocean Dipole in 60 years, in which the waters are warmer in the western Indian Ocean than the eastern.[5]
Tropical cyclones have been recorded in the North Indian Ocean since 1891. The 2019 season was the first since 1902 that experienced the development of six severe cyclonic storms out of eight cyclonic storms; in 1902, five cyclonic storms formed and four of them became severe cyclonic storms.[6] The season has also produced the most accumulated cyclone energy in this basin on record.
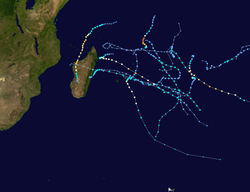
South-West Indian Ocean[]

January–June[]
The 2018–19 South-West Indian Ocean cyclone season was the costliest and the most active season ever recorded since reliable records began in 1967. Additionally, it is also the deadliest cyclone season recorded in the South-West Indian Ocean, surpassing the 1891–92 season, in which the 1892 Mauritius cyclone devastated the island of Mauritius.[7] Two moderate tropical storms formed at the start of this year, Desmond and Eketsang. Five more intense tropical cyclones formed during February and March: Funani, Gelena, Haleh, Idai, and Joaninha.[8][9] In addition, Savannah crossed into the basin from the Australian basin as an intense tropical cyclone in March. Of these storms, all of them but Haleh and Savannah produced impacts on land, with Idai causing at least 1,303 deaths and leaving at least 2,262 people missing, and causing US$2.2 billion in damages in Mozambique, Zimbabwe, Malawi, and Madagascar. The season set a new record of nine intense tropical cyclones, the largest number since the start of reliable satellite coverage in 1967, surpassing the 2006–07 season.
July–December[]
The 2019–20 South-West Indian Ocean cyclone season was a slightly above-average season in tropical cyclone and subtropical cyclone formation west of 90°E. The season officially began on 15 November, however, the formation of the first system—Zone of Disturbed Weather 01—occurred on 22 July 2019 (which failed to organize into a tropical depression), well before the official start of the season. This was the earliest start to a season since the 2016–17 season. For the second consecutive year in a row, the first system formed before the official start of the season. Afterwards, three storms formed in the month of December: Tropical Cyclone Belna on 2 December, which brought flooding and strong wind to northwestern Madagascar, Very Intense Tropical Cyclone Ambali, which formed a day later and became the first very intense tropical cyclone in the basin since Fantala in 2016, and Tropical Cyclone Calvinia which stalled near Mauritius and brought heavy rain and moderate flooding to the island nation towards the end of the month, crossing into 2020.
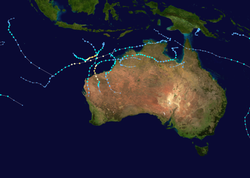
Australian region[]

January–June[]
The 2018–19 Australian region cyclone season was an average season that saw the formation of 11 tropical cyclones, six of which intensified further to become severe tropical cyclones. The season officially began on 1 November 2018 and concluded on 30 April 2019; however, as evidenced by Tropical Low Liua in September 2018 and Tropical Cyclones Lili and Ann in May 2019, tropical cyclones can form at any time of the year. As such, any system existing between 1 July 2018 and 30 June 2019 would count towards the season total.
This was the first Australian tropical cyclone season since 2014–15 to feature at least six severe tropical cyclones. It was also the third season in a row to begin prior to the official commencement date of 1 November, in this instance with the development of Tropical Low Liua on 26 September 2018. The most active month was December 2018, with a total of seven tropical lows existing in the region at some time during the month. The three strongest storms of the season—Veronica, Trevor and Savannah—all developed in March 2019, and together affected all three of the Bureau of Meteorology's Australian sub-regions as severe tropical cyclones. Overall, a total of five tropical cyclones existed within each of the three sub-regions throughout the season, representing an above-average season for both the Eastern Region and the Northern Region, but a below-average season for the Western Region. The season concluded much later than usual, and well after the official ending date of 30 April. Two tropical cyclones developed during May—Lili in the eastern Indonesian archipelago and Ann in the Coral Sea—both of which made landfall as tropical lows after weakening from tropical cyclone intensity. At its peak, Ann was a Category 2 tropical cyclone, and was the strongest storm to form in the Australian region during May since Severe Tropical Cyclone Rhonda in 1997. In total, eight systems were named by the BOM during the season, with two named by the BMKG and one by the FMS.
July–December[]
The 2019–20 season was a below average tropical cyclone season for the waters surrounding Australia between longitudes 90°E and 160°E. A total of eight tropical cyclones formed during the season, which represents the region's least active season since the 2016–17 season. Three systems intensified further into severe tropical cyclones, and three systems made landfall within the region at tropical cyclone intensity.
The season had an unusually late start with the first system, Blake, forming in early January, well after the official start of the season. Blake would later make landfall in northwestern Australia and soon degenerate afterwards. At the same time, Claudia, another tropical cyclone, formed. It persisted for two weeks and reached category 3 on the Australian tropical cyclone scale before dissipating west of Australia. Later that month, a tropical low formed and lasted for a week before dissipating in late January without been named. Three other tropical lows formed in late January and early February. One of them dissipated later. Another one of them has been moving in and out of the Australian region. It was designated 06F by the Fiji Meteorological Service. The third one intensified into Cyclone Damien. In late February, 2 new tropical lows formed, and were named Esther and Ferdinand. Esther didn't strengthen much, but Ferdinand went on to become a Category 3 severe tropical cyclone, equivalent to a Category 2 Atlantic hurricane.
South Pacific Ocean[]


January–June[]
This section needs expansion. You can help by . (December 2020) |
July – December[]
The 2019–20 season was a slightly above-average season in which tropical cyclones formed within the South Pacific Ocean to the east of 160°E. The season has been near-average in terms of activity, with eight tropical cyclones and four severe tropical cyclones forming during the season.
The season began with the arrival of Tropical Depression 01F on November 22, near the Solomon Islands, which would later become Tropical Cyclone Rita. Rita would then peak as a Category 3 on the Australian scale. Tropical Disturbance 02F was designated sometime later, but didn't last long after that. Sarai formed on December 23, lasting into the new year before finally ceasing to exist on January 2. Not too long after that, Tino formed and affected eastern Fiji and the surrounding area before dissipating. On January 24, a depression formed and dissipated the next day without been named. In early February, another low originally in the Australian region crossed the 160th meridian east and emerged in the South Pacific. It strengthened into severe tropical cyclone Uesi and affected New Caledonia and New Zealand. In mid-February four disturbances formed, 07F, 08F, 09F and 10F. 07F & 08F dissipated before becoming tropical depressions but the other 2 strengthened into tropical cyclones Vicky and Wasi. In mid March, Gretel entered the basin. It dissipated shortly afterwards. In early April, Harold also entered the basin from the Australian region. It rapidly intensified into a Category 5 Severe tropical cyclone as it impacted Vanuatu.
South Atlantic Ocean[]
There are two systems that formed during this year, Iba and Jaguar. Iba was the first tropical storm to develop in the basin since Anita in 2010, as well as the first fully tropical system to be named from the Brazilian naming list,[10] while Jaguar was a subtropical storm that failed to develop.
Mediterranean Ocean[]
Two medicanes formed in this year, Scott and Trudy (Detlef).
Systems[]
January[]

The month of January was inactive, with only eight tropical cyclones forming, of which five were named. However, Tropical Storm Pabuk[11] was the earliest-forming tropical storm of the western Pacific Ocean on record, breaking the previous record held by Typhoon Alice in 1979. Pabuk killed 10 people in Vietnam, Thailand and Malaysia, causing $151 million (US$2019) in damage.[12] Moderate Tropical Storm Eketsang killed 27 people in Madagascar in late-January.
| Storm name | Dates active | Max wind km/h (mph) |
Pressure (hPa) |
Areas affected | Damage (USD) |
Deaths | Refs |
|---|---|---|---|---|---|---|---|
| Mona | December 28, 2018 – January 9 | 95 (60) | 985 | Solomon Islands, Fiji, Tonga | Minimal | None | |
| Pabuk | December 31, 2018 – January 7 | 85 (50) | 994 | Natuna Islands, Vietnam, Malaysia, Thailand, Myanmar, Andaman Islands | $151 million | 10 | [13][14] |
| 01W (Amang) | January 4–22 | 55 (35) | 1004 | Kiribati, Marshall Islands, Caroline Islands, Philippines | $4.11 million | 9 | [15] |
| 11U | January 15–23 | Unspecified | 1004 | Java | None | None | |
| Desmond | January 17–22 | 65 (40) | 995 | Mozambique, Madagascar | Unknown | None | |
| Riley | January 19–30 | 120 (75) | 974 | Maluku Islands, East Timor, West Australia | None | None | |
| 13U | January 21–25 | 55 (35) | 999 | Cape York Peninsula | None | None | |
| Eketsang | January 22–24 | 75 (45) | 993 | Madagascar | Unknown | 27 |
February[]

The month of February was inactive, with only ten tropical cyclones forming, of which seven were named. However, Typhoon Wutip became the most-intense typhoon recorded in the month of February.[16][17]
| Storm name | Dates active | Max wind km/h (mph) |
Pressure (hPa) |
Areas affected | Damage (USD) |
Deaths | Refs |
|---|---|---|---|---|---|---|---|
| Funani | February 3–10 | 195 (120) | 940 | Rodrigues | None | None | |
| 06F | February 3–9 | 65 (40) | 994 | Wallis and Futuna, Samoan Islands | None | None | |
| Gelena | February 4–14 | 205 (125) | 942 | Madagascar, Mauritius, Rodrigues | $1.02 million | None | |
| Oma | February 7–22 | 130 (80) | 974 | Vanuatu, New Caledonia, Solomon Islands, Queensland, New South Wales | $51 million | 1 | |
| Neil | February 8–10 | 65 (40) | 994 | Wallis and Futuna, Fiji, Tonga | None | None | |
| 08F | February 10–13 | Unspecified | 996 | Fiji, Tonga | None | None | |
| 10F | February 11–13 | Unspecified | 996 | Wallis and Futuna, Fiji | None | None | |
| Wutip (Betty) | February 18 – March 2 | 195 (120) | 920 | Caroline Islands, Guam | $3.3 million | None | |
| Pola | February 23 – March 2 | 165 (105) | 950 | Wallis and Futuna, Fiji, Tonga | None | None | |
| Haleh | February 28 – March 7 | 175 (110) | 945 | None | None | None |
March[]

Ten tropical cyclones formed in the month of March, including six named tropical cyclones. A total of five systems strengthened into the equivalent of at least a Category 3 major hurricane on the Saffir Simpson hurricane wind scale (SSHWS)—the first such occurrence since September 2018. The month featured Cyclone Idai, which is currently the deadliest tropical cyclone of the year, responsible for 1,007 deaths in southern Africa.[18] Idai was also the costliest cyclone in the South-West Indian Ocean basin, inflicting more than $2 billion (USD) in damages.[19] Tropical Storm Iba became the first tropical cyclone to develop in the South Atlantic since Anita in 2010.
| Storm name | Dates active | Max wind km/h (mph) |
Pressure (hPa) |
Areas affected | Damage (USD) |
Deaths | Refs |
|---|---|---|---|---|---|---|---|
| Idai | March 4–16 | 195 (120) | 940 | Mozambique, Malawi, Madagascar, Zimbabwe | ≥$2 billion | 1,303 | [19][20] |
| 15U | March 6–11 | Unspecified | 1007 | Maluku Islands | None | None | |
| Savannah | March 7–20 | 175 (110) | 951 | Bali, Java, Christmas Island, Cocos (Keeling) Islands | >$7.5 million | 10 | |
| TL | March 13–14 | Unspecified | Unspecified | None | None | None | |
| 03W (Chedeng) | March 14–19 | Unspecified | 1006 | Palau, Philippines | $23,000 | None | |
| Trevor | March 15–26 | 175 (110) | 950 | Papua New Guinea, Queensland, Northern Territory | $710 thousand | None | |
| Veronica | March 18–31 | 215 (130) | 928 | Timor, Western Australia | $1.2 billion | None | [21] |
| Joaninha | March 18–30 | 185 (115) | 939 | Rodrigues | None | None | |
| Iba | March 23–28 | 85 (55) | 1006 | Brazil | None | None | |
| TL | March 31 – April 3 | Unspecified | 1005 | Southeastern Papua New Guinea | None | None |
April[]

April was an inactive month with six cyclones forming, of which four were named. Cyclone Kenneth became the most intense tropical cyclone to make landfall in Mozambique on record.[22] Kenneth killed 48 people, of which 41 were killed in the country of Mozambique.[23] Cyclone Fani struck parts of India and Bangladesh, killing 72 people in Odisha,[24] 17 people in Bangladesh,[25] and 8 in Uttar Pradesh.[26]
| Storm name | Dates active | Max wind km/h (mph) |
Pressure (hPa) |
Areas affected | Damage (USD) |
Deaths | Refs |
|---|---|---|---|---|---|---|---|
| Wallace | April 1–16 | 120 (75) | 980 | Eastern Indonesia, Northern Territory, East Timor, Western Australia, Cocos (Keeling) Islands | None | None | |
| 22U | April 5–15 | 65 (40) | 1006 | New Guinea, Queensland, Northern Territory, Western Australia | None | None | |
| Kenneth | April 21–29 | 215 (130) | 934 | Seychelles, Madagascar, Comoros, Mozambique, Tanzania, Malawi | >$100 million | 50 | [23] |
| Lorna | April 21 – May 1 | 150 (90) | 964 | None | None | None | |
| TL | April 21–26 | 55 (35) | 1003 | Sumatra, Cocos (Keeling) Islands | None | None | |
| Fani | April 26 – May 4 | 215 (130) | 932 | Sri Lanka, Odisha, Andhra Pradesh, East India, Bangladesh, Bhutan | $8.12 billion[27][28] | 89 | [24][25][26] |
May[]

May was a relatively inactive month with eight tropical cyclones forming. Four of these tropical cyclones reached the required intensity threshold to receive official names. Cyclone Lili developed at the beginning of the Australian region off-season, and struck East Timor and Indonesia's Maluku Islands, with rainfall-induced flooding causing minor damage to infrastructure and residential property. Cyclone Ann, another off-season Australian system, developed into a strong tropical storm on the SSHWS, and made landfall in Far North Queensland as a tropical low. Ann was the strongest Australian cyclone to develop in May since Rhonda in 1997. A subtropical storm named Jaguar formed in the South Atlantic, marking the second South Atlantic cyclone of the year, the first time two have occurred in the same year since 2016. The formation of the short-lived Subtropical Storm Andrea to the southwest of Bermuda began the Atlantic hurricane season early for the fifth year in a row.
| Storm name | Dates active | Max wind km/h (mph) |
Pressure (hPa) |
Areas affected | Damage (USD) |
Deaths | Refs |
|---|---|---|---|---|---|---|---|
| Lili | May 4–11 | 75 (45) | 997 | Eastern Indonesia, East Timor, Top End, Kimberley | Moderate | None | |
| TD | May 7–8 | Unspecified | 1006 | Yap Islands, Palau | None | None | |
| TD | May 7–15 | Unspecified | 1004 | Caroline Islands | None | None | |
| Ann | May 7–18 | 95 (60) | 993 | Solomon Islands, New Caledonia, Southern Papua New Guinea, Queensland, Top End, Eastern Indonesia, East Timor | None | None | |
| TD | May 10–11 | Unspecified | 1006 | Yap Islands, Palau | None | None | |
| 12F | May 16–21 | 55 (35) | 1002 | None | None | None | |
| Jaguar | May 20–22 | 65 (40) | 1010 | Brazil | None | None | |
| Andrea | May 20–21 | 65 (40) | 1006 | Bermuda | None | None |
June[]

June was an inactive month in terms of the number of tropical cyclones formed, with only four systems occurring in total. June 1 also marked the official commencement of the Atlantic hurricane season. After the year's longest period without any cyclone activity, the first system in the Arabian Sea for the 2019 North Indian Ocean cyclone season formed on June 10. Named Vayu, the system intensified into a high-end very severe cyclonic storm on the Indian scale, equivalent to a minimal Category 3 major hurricane on the SSHWS. Late in the month, Hurricane Alvin became the first tropical cyclone of the Eastern Pacific hurricane season, marking the latest start to the season since reliable records began in 1971. A tropical depression briefly reached tropical storm intensity near Japan on 27 June, and was named Sepat. The cyclone was the first tropical storm to form in the western Pacific in four months.
| Storm name | Dates active | Max wind km/h (mph) |
Pressure (hPa) |
Areas affected | Damage (USD) |
Deaths | Refs |
|---|---|---|---|---|---|---|---|
| Vayu | June 10–19 | 150 (90) | 978 | Northern Maldives, Lakshadweep, Western India, Southeastern Pakistan | >$140 thousand | 8 | [29][30][31] |
| Sepat (Dodong) | June 17–28 | 75 (45) | 992 | Caroline Islands, Japan | None | None | |
| TD | June 26 | 55 (35) | 1000 | Ryukyu Islands, South Korea, Japan | None | None | |
| Alvin | June 25–29 | 120 (75) | 992 | Clarion Island | None | None | |
| 04W (Egay) | June 26 – July 1 | 55 (35) | 1006 | Caroline Islands, Palau | None | None | |
| Barbara | June 30 – July 6 | 250 (155) | 930 | None | None | None |
July[]

The month of July was the third most active month in terms of total tropical cyclones and in terms of named storms in the year, with thirteen tropical cyclones forming, of which nine were named, behind August. Among these storms, Hurricane Barry made landfall between Midwestern United States and Southeastern United States as tropical storm, causing US$500 million in damages and one person was indirectly killed by the storm.
| Storm name | Dates active | Max wind km/h (mph) |
Pressure (hPa) |
Areas affected | Damage (USD) |
Deaths | Refs |
|---|---|---|---|---|---|---|---|
| Mun | July 1–4 | 65 (40) | 992 | Hainan, South China, Paracel Islands, Vietnam, Laos | $240 thousand | 2 | |
| Cosme | July 6–8 | 85 (50) | 1001 | None | None | None | |
| Barry | July 11–15 | 120 (75) | 991 | Midwestern United States, Southeastern United States, Gulf Coast of the United States, Arkansas, Oklahoma, Great Lakes region, Northeastern United States | ≥ $600 million | 0 (1) | [32][33] |
| Four-E | July 12–14 | 55 (35) | 1006 | None | None | None | |
| Danas (Falcon) | July 12–21 | 85 (50) | 985 | Yap Islands, Philippines, Taiwan, Ryukyu Islands, East China, Japan, Korean Peninsula, North China, Russian Far East, Kuril Islands | $6.4 million | 6 | |
| Goring | July 17–19 | 55 (35) | 996 | Philippines, Taiwan, Ryukyu Islands | None | None | |
| Dalila | July 22–25 | 65 (40) | 1005 | Panama, Costa Rica, Nicaragua | None | None | |
| Three | July 22–23 | 50 (30) | 1013 | Bahamas | None | None | |
| 01 | July 22–24 | 45 (30) | 1001 | None | None | None | |
| Nari | July 24–27 | 65 (40) | 998 | Bonin Islands, Japan | None | None | |
| Erick | July 27 – August 5 | 215 (130) | 952 | Hawaii | None | None | |
| Flossie | July 28 – August 6 | 130 (80) | 990 | Hawaii | None | None | |
| Wipha | July 30 – August 3 | 85 (50) | 985 | Paracel Islands, Hainan, South China, Vietnam, Laos | $56.3 million | 27 |
August[]
The month of August was the second-most active of the year with eighteen tropical cyclones forming, with fourteen being named, out of all the cyclones, Hurricane Dorian in the Atlantic was the strongest to form and the second deadliest of the month, with 84 confirmed deaths, and Typhoon Lekima became the second most costliest storm in Chinese history (behind Typhoon Fitow of 2013), as well as the deadliest storm of the month, with 105 fatalities.
| Storm name | Dates active | Max wind km/h (mph) |
Pressure (hPa) |
Areas affected | Damage (USD) |
Deaths | Refs |
|---|---|---|---|---|---|---|---|
| Francisco | August 1–7 | 130 (80) | 970 | Japan, Korean Peninsula | Unknown | 2 | |
| Lekima (Hanna) | August 2–14 | 195 (120) | 925 | Caroline Islands, Philippines, Ryukyu Islands, Taiwan, China, Korean Peninsula, Russian Far East | $9.28 billion | 105 | [34][35][36][37] |
| Gil | August 3–5 | 65 (40) | 1006 | None | None | None | |
| Krosa | August 5–16 | 155 (100) | 950 | Mariana Islands, Japan, Korean Peninsula, Russian Far East | $20.3 million | 3 | |
| BOB 03 | August 6–11 | 55 (35) | 988 | East India, Bangladesh | Unknown | 3 | |
| TD | August 6–8 | 55 (35) | 996 | Philippines | None | None | |
| Henriette | August 12–13 | 70 (45) | 1005 | Central America, Southwestern Mexico, Revillagigedo Islands, Baja California Peninsula | None | None | |
| TD | August 17–18 | Unspecified | 1006 | None | None | None | |
| TD | August 19 – 21 | Unspecified | 1004 | Ryukyu Islands, Taiwan, East China | None | None | |
| Bailu (Ineng) | August 20–27 | 95 (60) | 985 | Philippines, Taiwan, South China | $28.2 million | 3 | |
| Chantal | August 21–24 | 65 (40) | 1009 | Southeastern United States | None | None | |
| Ivo | August 21–25 | 100 (65) | 992 | Revillagigedo Islands, Baja California Peninsula, Northwestern Mexico | None | None | |
| Dorian | August 24 – September 12 | 295 (185) | 910 | Leeward Islands, Barbados, Virgin Islands, Puerto Rico, The Bahamas, Southeastern United States. Atlantic Canada, | $5.1 billion | 84 | [38][39][40][41] |
| Podul (Jenny) | August 25–31 | 85 (50) | 992 | Yap, Philippines, Vietnam, Laos, Thailand, Cambodia | $2.35 million | 16 | |
| Erin | August 26–29 | 65 (40) | 1005 | Eastern United States | Minimal | None | [42] |
| Faxai | August 30 – September 10 | 155 (100) | 955 | Wake Island, Japan | $10 billion | 3 | |
| Kajiki (Kabayan) | August 30 – September 7 | 65 (45) | 996 | Philippines, South China, Vietnam, Laos | $12.9 million | 6 | |
| Lingling (Liwayway) | August 31 – September 7 | 165 (105) | 940 | Philippines, Ryukyu Islands | $236 million | 8 |
September[]

The month of September was the most active of the year with twenty-five tropical cyclones forming, with seventeen being named. Out of all the cyclones, Hurricane Lorenzo in the Atlantic is the most intense of the month and become one of the largest and most powerful category 5 hurricanes on record for the central tropical Atlantic in the satellite era.[43] Tropical Storm Fernand caused heavy flooding in Northwest Mexico, killing one person and causing at least $213 million in damage. The activity of the month in the Eastern Pacific became a record-tying most active in the month between 1966, 1992, 1994, 1997 and 2005 forming six named storms in the basin. Severe Tropical Storm (later Typhoon) Tapah (Nimfa) worsened the flooding situation in the Philippines. No tropical cyclones were formed in South Atlantic.
| Storm name | Dates active | Max wind km/h (mph) |
Pressure (hPa) |
Areas affected | Damage (USD) |
Deaths | Refs |
|---|---|---|---|---|---|---|---|
| Juliette | September 1–7 | 205 (125) | 953 | None | None | None | |
| TD | September 1–4 | 55 (35) | 998 | Philippines | None | None | |
| Fernand | September 3–5 | 85 (50) | 1000 | Northwestern Mexico, Southern Texas | $383 million | 1 | [44][45] |
| Gabrielle | September 3–10 | 100 (65) | 995 | Cape Verde, British Isles | None | None | |
| Akoni | September 4–6 | 65 (40) | 1004 | None | None | None | |
| TD | September 4–5 | Unspecified | 1006 | Caroline Islands | None | None | |
| TD | September 7–10 | 55 (35) | 1000 | Ryukyu Islands | None | None | |
| Marilyn | September 7–10 | 55 (35) | 998 | Caroline Islands, Philippines | None | None | |
| Kiko | September 12–25 | 215 (130) | 950 | None | None | None | |
| Humberto | September 13–20 | 205 (125) | 951 | Hispaniola, Cuba, Bahamas, Southeastern United States, Bermuda | 25 million | 1 | |
| Peipah | September 13–16 | 65 (40) | 1000 | Mariana Islands | None | None | |
| TD | September 15 | Unspecified | 996 | None | None | None | |
| TD | September 17–20 | Unspecified | 1000 | None | None | None | |
| Tapah (Nimfa) | September 17–23 | 120 (75) | 970 | Philippines | None | None | |
| Lorena | September 17–22 | 140 (85) | 987 | Southwestern Mexico, Western Mexico, Revillagigedo Islands, Baja California Peninsula | None | None | |
| Mario | September 17–23 | 100 (65) | 992 | None | None | None | |
| Jerry | September 17–25 | 165 (105) | 971 | Leeward Islands, Puerto Rico | None | None | |
| Imelda | September 17–21 | 75 (45) | 1003 | Southwestern United States, Texas, Louisiana, Oklahoma, Arkansas | $5 billion | 5 | |
| TD | September 17 | Unspecified | 1004 | Philippines | None | None | |
| Karen | September 22–27 | 75 (45) | 1002 | Windward Islands, Trinidad and Tobago, Venezuela, U.S. Virgin Islands, British Virgin Islands, Puerto Rico | $3.5 million | None | |
| Hikaa | September 22–26 | 140 (85) | 978 | Gujarat, Oman | None | None | |
| Lorenzo | September 23 – October 2 | 260 (160) | 925 | West Africa, Cape Verde, Eastern United States, Azores, British Isles, France | ≥$362 million | 19 | |
| Mitag (Onyok) | September 25 – October 3 | 140 (85) | 965 | Mariana Islands, Taiwan, Japan, East China, South Korea | None | None | |
| Narda | September 28 – October 1 | (85) 50 | 998 | Western Mexico, Southwestern Mexico | None | None | |
| Land 01 | September 29 – October 1 | Unspecified | Unspecified | Gujarat | None | None |
October[]

The month of October as fairly active, with formation of Typhoon Hagibis, made landfall in Tokyo, Japan, becoming the worst typhoon in Japanese history since Ida in 1958. Hurricane Pablo became the easternmost Atlantic storm to ever strengthen into a hurricane, breaking Hurricane Vince's record.
| Storm name | Dates active | Max wind km/h (mph) |
Pressure (hPa) |
Areas affected | Damage (USD) |
Deaths | Refs |
|---|---|---|---|---|---|---|---|
| TD | October 1–3 | Unspecified | 1010 | None | None | None | |
| Hagibis | October 4–13 | 195 (120) | 915 | Mariana Islands, South Korea, Japan, Russian Far East | $15 billion | 95 | |
| Melissa | October 11–14 | 100 (65) | 995 | Mid-Atlantic States, New England, Nova Scotia, | None | None | |
| Ema | October 12–14 | 85 (50) | 1003 | None | None | None | |
| Fifteen | October 14–16 | 55 (35) | 1006 | West Africa, Cape Verde | None | None | |
| Neoguri (Perla) | October 15–21 | 140 (85) | 992 | None | None | None | |
| Octave | October 17–19 | 75 (45) | 1004 | None | None | None | |
| Bualoi | October 18–25 | 185 (115) | 935 | None | None | None | |
| Nestor | October 18–19 | 95 (60) | 996 | Central America, Mexico, Southeastern United States | >$150 million | 0 (3) | |
| Priscilla | October 20–21 | 65 (40) | 1004 | Western Mexico | >$3 million | None | |
| Kyarr | October 24 – November 1 | 240 (150) | 922 | Gujarat, Iran, Pakistan, Oman | None | None | |
| Scott | October 24–26 | 75 (45) | 1004 | Egypt, Israel | Unknown | None | |
| Olga | October 25–26 | 65 (40) | 998 | United States Gulf Coast | >$100 million | 1 | |
| Pablo | October 25–28 | 130 (80) | 977 | Azores | None | None | |
| Matmo | October 28 – November 1 | 100 (60) | 992 | Vietnam | >$53 million | None | |
| Maha | October 30 – November 7 | 185 (115) | 956 | India | None | None | |
| Rebekah | October 30 – November 1 | 75 (45) | 987 | Azores | None | None |
November[]

The month of November was relatively inactive, with only ten tropical cyclones forming. However, Typhoon Halong became the strongest storm of the year, peaking with a minimum central pressure of 905 millibars. Bulbul caused extensive damage in West Bengal during the early period of the month, with damage estimates likely exceeding over US$2.5 billion. Typhoon Nakri, far earlier in the month, and Typhoon Kammuri, near the end of the month, both lashed parts of the Philippines with heavy rainfall and strong wind, killing 34 people in the country in total. Additionally, Tropical Cyclone Rita became the first cyclone of the 2019–20 South Pacific cyclone season.
| Storm name | Dates active | Max wind km/h (mph) |
Pressure (hPa) |
Areas affected | Damage (USD) |
Deaths | Refs |
|---|---|---|---|---|---|---|---|
| Halong | November 2–9 | 215 (130) | 905 | None | None | None | |
| Nakri (Quiel) | November 4–11 | 120 (75) | 980 | Philippines | >$40 million | 22 | |
| Bulbul | November 5–11 | 155 (100) | 980 | Andaman and Nicobar Islands, East India, Bangladesh | ≥$2.6 billion | 38 | [46][47][48][49][50] |
| Trudy (Detlef) | November 10–11 | 80 (50) | 998 | Algeria, Spain, Italy | Unknown | 1 | |
| Fengshen | November 10–18 | 155 (100) | 965 | Marshall Islands, Northern Mariana Islands | None | None | |
| Kalmaegi (Ramon) | November 11–21 | 120 (75) | 980 | Philippines | None | None | |
| Raymond | November 15–17 | 85 (50) | 1000 | Revillagigedo Islands, Baja California Peninsula | None | None | |
| Twenty-One-E | November 16–18 | 55 (35) | 1006 | Southwest Mexico | None | None | |
| Fung-wong (Sarah) | November 19–24 | 100 (65) | 990 | Philippines | None | None | |
| Sebastien | November 19–25 | 100 (65) | 994 | Leeward Islands | None | None | |
| TD | November 22–23 | Not specified | 1010 | None | None | None | |
| Rita | November 22–27 | 120 (75) | 978 | Solomon Islands, Vanuatu | None | None | |
| Kammuri (Tisoy) | November 24 – December 6 | 165 (105) | 950 | Caroline Islands, Mariana Islands, Philippines | $116 million | 12 | |
| TD | November 26–29 | 55 (35) | 1002 | Mariana Islands | None | None | |
| TD | November 29 – December 1 | 55 (35) | 1002 | Caroline Islands | None | None |
December[]

The month of December was only slightly active, with nine tropical cyclones forming but only six tropical cyclones being named. However, Ambali became the strongest storm of the month, peaking with a minimum central pressure of 930 millibars and maximum sustained winds of 160 miles per hour (260 km/h), thus becoming the first very intense tropical cyclone and Category 5 in the Saffir-Simpson Hurricane Wind Scale in the basin since Fantala in 2016 while also becoming the first named cyclone of the 2019–20 South-West Indian Ocean cyclone season. Adding to the season, Cyclone Belna formed and made a destructive landfall in northwestern Madagascar, killing 9 people. Additionally, before becoming the last typhoon of the 2019 Pacific typhoon season, Typhoon Phanfone made a devastating landfall in the Philippines on Christmas Eve causing over ₱3,39 billion (US$67.2 million) in damage and leaving 50 people in the nation dead.
| Storm name | Dates active | Max wind km/h (mph) |
Pressure (hPa) |
Areas affected | Damage (USD) |
Deaths | Refs |
|---|---|---|---|---|---|---|---|
| Belna | December 2–11 | 185 (115) | 955 | Seychelles, Mayotte, Comoros, Madagascar | > $25 million | 9 | |
| Pawan | December 2–7 | 75 (45) | 999 | Somalia | Unknown | 1 | |
| ARB 07 | December 3–5 | 95 (60) | 1002 | Tamil Nadu | Unknown | 25 | |
| Ambali | December 3–8 | 220 (140) | 930 | None | None | None | |
| ARB 08 | December 8–10 | 55 (35) | 1004 | Socotra, Somalia | None | None | |
| 02F | December 19–23 | Unspecified | 999 | None | None | None | |
| Phanfone (Ursula) | December 19–29 | 175 (110) | 970 | Caroline Islands, Philippines | $67.2 million | 50 | |
| Sarai | December 23 – January 2, 2020 | 110 (70) | 972 | Fiji, Tonga, Niue, Southern Cook Islands | $2.3 million | 2 | |
| Calvinia | December 27 – January 1, 2020 | 120 (75) | 973 | Mauritius, Rodrigues | Unknown | None |
Global effects[]
- ^ The sum of the number of systems in each basin will not equal the number shown as the total. This is because when systems move between basins, it creates a discrepancy in the actual number of systems.
- ^ The sum of the number of fatalities in each basin will not equal the number shown as the total. This is because when systems move between basins, it creates a discrepancy in the actual number of fatalities.
See also[]
- Tropical cyclones by year
- List of earthquakes in 2019
- Tornadoes of 2019
- 2019 wildfire season
Notes[]
1 Only systems that formed either on or after January 1, 2019 are counted in the seasonal totals.
2 Only systems that formed either before or on December 31, 2019 are counted in the seasonal totals.
3 The wind speeds for this tropical cyclone/basin are based on the IMD Scale which uses 3-minute sustained winds.
4 The wind speeds for this tropical cyclone/basin are based on the Saffir Simpson Scale which uses 1-minute sustained winds.
5The wind speeds for this tropical cyclone are based on Météo-France which uses gust winds.
References[]
- ^ Brian Donegan (14 March 2019). "El Niño Conditions Strengthen, Could Last Through Summer". The Weather Company. Retrieved 15 March 2019.
- ^ "El Niño is over, NOAA says". Al.com. 8 August 2019. Retrieved 5 September 2019.
- ^ "2019 Atlantic Hurricane Season". www.nhc.noaa.gov. Retrieved 2021-01-25.
- ^ "Hurricane Dorian (2019)" (PDF). nhc.noaa.gov.
- ^ Masters, Jeff (October 28, 2019). "Tropical Cyclone Kyarr (150-mph Winds): Arabian Sea's 2nd Strongest Storm on Record". Scientific American Blog Network.
- ^ "IMD – Press Release". Archived from the original on 2019-11-04.
- ^ Masters, Jeff. "Africa's Hurricane Katrina: Tropical Cyclone Idai Causes an Extreme Catastrophe". Weather Underground. Retrieved 23 March 2019.
- ^ "Cyclone Idai damages estimated at $2 billion: World Bank". Yahoo Finance. 12 April 2019. Retrieved 1 May 2019.
- ^ Lynsey Chutel (16 April 2019). "One month later: Cyclone Idai's devastation by the numbers". Quartz Africa. Retrieved 1 May 2019.
- ^ "WARNING NR 208/2019". Marine Meteorological Service. 24 March 2019. Archived from the original on 24 March 2019. Retrieved 24 March 2019.
- ^ Olarn, Kocha (5 January 2019). "Storm kills 3 in Thailand, moves into Andaman Sea". CNN. Retrieved 2019-04-09.
- ^ "Pabuk leaves 4 dead, billions of Baht in damage – Thailand". ReliefWeb. Retrieved 2019-04-09.
- ^ Olarn, Kocha (5 January 2019). "Storm Kills 3 in Thailand, moves into Andaman Sea". CNN. CNN. Retrieved 26 January 2019.
- ^ Wright, Pam. "Tropical Storm Pabuk Makes First on Record Southern Thailand January Landfall; Two Killed, Thousands Evacuated". The Weather Channel. The Weather Channel. Retrieved 26 January 2019.
- ^ Dalizon, Alfred. "Landslide buried 7 treasure hunters in Agusan del Norte". Journal Online. People's Journal. Retrieved 26 January 2019.
- ^ "Wutip 2019 – Hurricane And Typhoon Updates". blogs.nasa.gov. Retrieved 2019-04-09.
- ^ Matthew Cappucci (February 25, 2019). "The strongest February typhoon on record packs 180 mph gusts, sideswiping Guam". The Washington Post. Retrieved May 21, 2019.
- ^ Leahy, Stephen (2019-03-19). "Why Cyclone Idai was so destructive". Environment. Retrieved 2019-04-09.
- ^ a b "Resources stretched as Cyclone Kenneth piles misery on Mozambique". Reliefweb. 27 April 2019. Retrieved 27 April 2019.
- ^ "Hundreds feared dead after Cyclone Idai". BBC News. 18 March 2019. Retrieved 18 March 2019.
- ^ Osental, Duffie (5 April 2019). "Insurers on standby as cyclone looms off Western Australia coast". Insurance Business America. Retrieved 5 April 2019.
- ^ Brandon Miller (25 April 2019). "Cyclone Kenneth: Thousands evacuated as Mozambique is hit with the strongest storm in its history". Cable News Network. Retrieved 25 April 2019.
- ^ a b Mutsaka, Farai. "Mozambique church a refuge for Muslim cyclone survivors". SF Gate. The Associated Press. Retrieved 1 May 2019.
- ^ a b "Number Of Dead From Cyclone Fani Rises To 29 In Odisha". NDTV. 5 May 2019. Retrieved 5 May 2019.
- ^ a b "Cyclone Fani: 14 killed in 8 districts". Dhaka Tribune. 4 May 2019. Retrieved 4 May 2019.
- ^ a b "Lightning kills 8 in Uttar Pradesh". New Indian Express. 3 May 2019. Retrieved 5 May 2019.
- ^ "Andhra Pradesh pegs loss due to Cyclone Fani at ₹58.62 crore". The Hindu. 5 May 2019. Retrieved 5 May 2019.
- ^ "Fani storm loss estimated at Tk 536 crore". Banglanews24.com. 9 May 2019. Retrieved 9 May 2019.
- ^ "Rains and strong winds hit Mumbai; 1 killed, 2 injured as portion of cladding collapses at Churchgate Railway Station". Mumbai Mirror. 12 June 2019. Archived from the original on 14 June 2019. Retrieved 14 June 2019.
- ^ Saiyed, Kamal; Mohanty, Aishwarya (13 June 2019). "Gujarat: Six killed, 2 injured in 3 districts ahead of Vayu landfall". The Indian Express. Archived from the original on 14 June 2019. Retrieved 14 June 2019.
- ^ Waqar Bhatti, M. (15 June 2019). "Elderly man apparently dies due to heat stroke as weathermen predicts another very hot, humid day on Sunday". The News International. Archived from the original on 16 June 2019. Retrieved 16 June 2019.
- ^ Adams, Char (July 15, 2019). "Good Samaritans Form Human Chain to Rescue Swimmers from Rip Current in Florida". PEOPLE.com. Retrieved 2019-07-18.
- ^ Global Catastrophe Recap: July 2019 (PDF) (Report). AON. August 1, 2019. Retrieved August 16, 2019.
- ^ "Typhoon Lekima leaves 45 dead, 16 missing in China". China.org.cn. 12 August 2019. Retrieved 12 August 2019.
- ^ "Typhoon Lekima: 45 dead, one million displaced in China". The Week.
- ^ BeijingAugust 12, Press Trust of India; August 12, 2019UPDATED; Ist, 2019 17:32. "Typhoon Lekima: 45 killed, over a million displaced in China". India Today.CS1 maint: numeric names: authors list (link)
- ^ Daily, Reuters via Zhejiang (August 12, 2019). "'Like a horse with an extremely fierce temper': Typhoon Lekima kills 44 in China". ABC News.
- ^ "Bahamas official warns people to prepare for the 'unimaginable' as hurricane death toll rises to 30". CNN. 6 September 2019. Retrieved 2019-09-06.
- ^ Connolly, Kevin (September 5, 2019). "6 Florida Deaths Linked to Hurricane Dorian". www.mynews13.com. News 13. Retrieved 2019-09-06.
- ^ Puleo, Mark; Mitchell, Chaffin (August 29, 2019). "While Puerto Rico avoids direct hit, Virgin Islands take significant blow from Dorian". AccuWeather. Retrieved September 6, 2019.
- ^ "WATCH: North Carolina reports 1st death from Hurricane Dorian". PBS NewsHour. Public Broadcasting Service-us. 2019-09-04. Retrieved 2019-09-06.
- ^ "Post-tropical storm Erin drenches parts of Nova Scotia, washes out rural roads". CBC News. August 30, 2019.
- ^ Jack Beven (September 26, 2019). Hurricane Lorenzo Discussion Number 16 (Report). National Hurricane Center. Retrieved September 26, 2019.
- ^ "Minuto a minuto: Fernand azota Monterrey con lluvias torrenciales y deja un muerto". Infobae. September 4, 2019. Retrieved September 7, 2019.
- ^ "Fernand provocó daños por 7.500 millones de pesos en Nuevo León". Infobae. September 7, 2019. Retrieved September 8, 2019.
- ^ "Cyclone Bulbul kills 102 in West Bengal, 2.73 lakh families affected in the state". Times of India. November 10, 2019. Retrieved November 10, 2019.
- ^ "Cyclone Bulbul claims 13 lives, leaves a trail of destruction in Bangladesh". bdnews24.com. November 10, 2019. Retrieved November 11, 2019.
- ^ "Cyclone Bulbul: Bodies of missing nine fishermen recovered from Meghna river". The Daily Star. 11 November 2019. Retrieved 11 November 2019.
- ^ "Cyclone Bulbul: Bodies Of 4 Missing Fishermen Found Off Bengal Coast". NDTV. November 11, 2019. Retrieved November 11, 2019.
- ^ "Initial Estimates Suggest Damages Worth ₹19,000 Crore Due to Cyclone Bulbul in West Bengal". The Weather Channel. 13 November 2019. Retrieved 13 November 2019.
External links[]
| Tropical cyclone year articles (2010–2019) |
|---|
| 2010, 2011, 2012, 2013, 2014, 2015, 2016, 2017, 2018, 2019 |
Regional Specialized Meteorological Centers
- US National Hurricane Center – North Atlantic, Eastern Pacific
- Central Pacific Hurricane Center – Central Pacific
- Japan Meteorological Agency – NW Pacific
- India Meteorological Department – Bay of Bengal and the Arabian Sea
- Météo-France – La Reunion – South Indian Ocean from 30°E to 90°E
- Fiji Meteorological Service – South Pacific west of 160°E, north of 25° S
Tropical Cyclone Warning Centers
- Meteorology, Climatology, and Geophysical Agency of Indonesia – South Indian Ocean from 90°E to 141°E, generally north of 10°S
- Australian Bureau of Meteorology (TCWC's Perth, Darwin & Brisbane) – South Indian Ocean & South Pacific Ocean from 90°E to 160°E, generally south of 10°S
- Papua New Guinea National Weather Service – South Pacific Ocean from 141°E to 160°E, generally north of 10°S
- Meteorological Service of New Zealand Limited – South Pacific west of 160°E, south of 25°S
![]() This article incorporates public domain material from websites or documents of the National Weather Service.
This article incorporates public domain material from websites or documents of the National Weather Service.
- Tropical cyclones in 2019
- Tropical cyclones by year
- 2019 Atlantic hurricane season
- 2019 Pacific hurricane season
- 2019 Pacific typhoon season
- 2019 North Indian Ocean cyclone season
- 2018–19 Australian region cyclone season
- 2019–20 Australian region cyclone season
- 2018–19 South Pacific cyclone season
- 2019–20 South Pacific cyclone season
- 2018–19 South-West Indian Ocean cyclone season
- 2019–20 South-West Indian Ocean cyclone season
- 2019-related lists