2019–20 Australian region cyclone season
| 2019–20 Australian region cyclone season | |
|---|---|
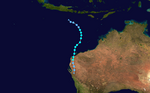
 Season summary map | |
| Seasonal boundaries | |
| First system formed | 4 January 2020 |
| Last system dissipated | 23 May 2020 |
| Strongest storm | |
| Name | Damien |
| • Maximum winds | 155 km/h (100 mph) (10-minute sustained) |
| • Lowest pressure | 955 hPa (mbar) |
| Seasonal statistics | |
| Tropical lows | 19 |
| Tropical cyclones | 9 |
| Severe tropical cyclones | 3 |
| Total fatalities | 28 |
| Total damage | $4.3 million (2020 USD) |
| Related articles | |
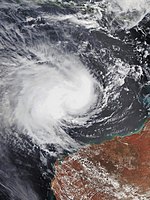
The 2019–20 Australian region cyclone season was a below average tropical cyclone season for the waters surrounding Australia between longitudes 90°E and 160°E. The season officially began on 1 November 2019 and ended on 30 April 2020; however, tropical cyclones can form at any time of year, as evidenced by Tropical Cyclone Mangga during May 2020. As such, any system existing between 1 July 2019 and 30 June 2020 would count towards the season total. The season featured the region's second-latest start on record (behind only the 1986–87 season), with the formation of the first tropical low only occurring on 4 January 2020. A total of eight tropical cyclones formed during the season, which represents the region's least active season since the 2016–17 season. Three systems intensified further into severe tropical cyclones, and three systems made landfall within the region at tropical cyclone intensity. A total of 28 fatalities were caused, either directly or indirectly, as a result of impacts from the season's systems. Severe Tropical Cyclone Damien, the strongest of the year, became the strongest tropical cyclone to strike Western Australia's Pilbara Region since Cyclone Christine in 2013.
During the season, tropical cyclones were officially monitored by the Australian Bureau of Meteorology (BOM), the Meteorology, Climatology, and Geophysical Agency (BMKG), and the National Weather Service of Papua New Guinea. The United States' Joint Typhoon Warning Center (JTWC) and other national agencies such as the Fiji Meteorological Service (FMS), the Meteorological Service of New Zealand (MetService), and Météo-France at La Réunion also monitored parts of the basin during the season.
Seasonal forecasts[]
| Source/Record | Tropical Cyclone |
Severe Tropical Cyclone |
Ref | |
|---|---|---|---|---|
| Record high: | 21 | 12 | ||
| Record low: | 3 | 0 | ||
| Average (1969–70 – 2018–19): | 9-13 | — | [1] | |
| NIWA October (135°E—120°W) | 9-12 | 4 | [2] | |
| Region | Average number |
Chance of more |
Chance of less |
Actual activity |
| Overall (90°E–160°E) |
11 | 35% | 65% | 9 |
| Western region (90°E–125°E) |
7 | 43% | 57% | 5 |
| Northwestern sub-region (105°E–130°E) |
5 | 39% | 61% | 4 |
| Northern region (125°E–142.5°E) |
3 | 36% | 64% | 2 |
| Eastern region (142.5°E–160°E) |
4 | 43% | 57% | 2 |
| Western South Pacific (142.5°E—165°E) |
4 | 54% | 46% | 0 |
| Eastern South Pacific (165°E—120°W) |
7 | 41% | 59% | 0 |
| Source: BOM's Season Outlooks for Tropical Cyclones[1][3] | ||||
Ahead of the cyclone season formally starting on 1 November, the BoM, Fiji Meteorological Service (FMS), New Zealand's MetService and National Institute of Water and Atmospheric Research (NIWA) and various other Pacific Meteorological services, all contributed towards the Island Climate Update tropical cyclone outlook that was released during October 2019.[2] The outlook called for a near-average number of tropical cyclones for the 2019–20 season, with nine to twelve named tropical cyclones, predicted to occur between 135°E and 120°W, compared to an average of just over 10.[2] At least four of the tropical cyclones were expected to intensify further and become severe tropical cyclones, while it was noted that a Category 5 severe tropical cyclone could occur during the season.[2]
In addition to contributing towards the Island Climate Update outlook, the BoM issued seven seasonal forecasts for various parts of the Australian region and South Pacific basin.[1][3] For the entire Australian region between 90°E–160°E, the BoM predicted that the season would feature, a below-average amount of systems with only a 35% chance of more tropical cyclones.[1] The BoM also thought that their self defined Western and Eastern regions, would both have a 57% chance of fewer tropical cyclones than normal developing.[1] Their northern region and northwestern subregion would also see fewer tropical cyclones than normal, with only a 36% and 39% chance of more tropical cyclones than average.[1] The BoM also issued two seasonal forecasts for their self-defined eastern and western regions of the South Pacific Ocean.[3] They predicted that the Western region between 142.5°E and 165°E, had a 54% chance of seeing activity above its average of 4 tropical cyclones. The BoM also predicted that the Eastern Region between 165°E and 120°W, had a 41% chance of seeing activity above its average of 7 tropical cyclones.[3]
The outlooks accounted for the effects of various major Australian climate drivers, namely the El Niño–Southern Oscillation (ENSO) and the Indian Ocean Dipole (IOD). The BOM noted that sea surface temperature anomalies across the equatorial Pacific Ocean had been characteristic of a neutral ENSO phase since April. The international climate models utilised by the BOM also indicated that the neutral conditions would likely persist until at least February.[1] A neutral ENSO phase typically has little influence on the Australian climate.[4] Warmer than average sea surface temperatures in the central and western tropical Indian Ocean and cooler waters near Indonesia and northern Australia, indicating a positive IOD phase, had also persisted since May.[5] The temperature difference increased throughout the year, and at the beginning of October, the BOM noted that the sea surface temperature anomaly of +1.76 °C was the highest observed value on record (since 2001).[6] The anomaly continued to increase rapidly after this, with the value reaching +2.15 °C a fortnight (two weeks or fourteen days) later.[4] The record-strength positive IOD contributed to the development of a region of higher than normal atmospheric pressure across northern Australia during September, after having remained near neutral throughout winter. The BOM noted that these factors also contributed to the tropical cyclone season outlook.[1]
Season summary[]

The season had an unusually late start with the first system, Blake, forming in early January, well after the official start of the season. Blake would later make landfall in northwestern Australia and soon degenerate afterwards. At the same time, Claudia, another tropical cyclone, formed. It persisted for two weeks and reached category 3 on the Australian tropical cyclone scale before dissipating west of Australia. Later that month, a tropical low formed and lasted for a week before dissipating in late January without been named. Three other tropical lows formed in late January and early February. One of them dissipated later. Another one of them has been moving in and out of the Australian region. It was designated 06F by the Fiji Meteorological Service. The third one intensified into Cyclone Damien. In late February, 2 new tropical lows formed, and were named Esther and Ferdinand. Esther didn't strengthen much, but Ferdinand went on to become a Category 3 severe tropical cyclone, equivalent to a Category 2 Atlantic Hurricane. Then in the month of March and April, two cyclones namely Gretel and Harold formed in the Coral Sea and both of them exited the basin towards the South Pacific Ocean where it intensified further. The season continued into May where two lows formed in the region of TCWC Jakarta where the latter one was named as Mangga which became the strongest Extratropical cyclone to hit Western Australia such late in the season. The season concluded on 23 May with the Extratropical transition of Cyclone Mangga.
Systems[]
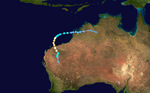
Tropical Cyclone Blake[]
| Category 1 tropical cyclone (Australian scale) | |
| Tropical storm (SSHWS) | |
  | |
| Duration | 4 January – 8 January |
|---|---|
| Peak intensity | 75 km/h (45 mph) (10-min) 986 hPa (mbar) |
During 4 January, the BOM reported that Tropical Low 02U had started to develop within a monsoon trough, about 750 km (465 mi) north-northwest of Broome.[7] Citing considerable rotation extending into the mid troposphere, well-established dual-channel outflow and warm sea surface temperatures, the JTWC assessed the system as having a moderate chance of attaining tropical cyclone intensity within the following 24 hours.[8] The system gradually gathered strength in the favourable environment as it tracked slowly towards the south-southwest,[9] leading the JTWC to issue a Tropical Cyclone Formation Alert at 03:30 UTC the following day.[10] The BOM indicated that sustained gale-force winds had developed on the western side of the tropical low at 15:00 UTC,[11] and the system was designated as Tropical Cyclone 06S by the JTWC a few hours later.[12] Gales fully encircled the system by 00:00 UTC on 6 January, prompting the BOM to upgrade the low to a Category 1 tropical cyclone on the Australian scale, the first of the season. The system was given the official name Blake by the BOM.[13] Blake began to intensify steadily after being upgraded into a tropical cyclone, attaining 10-minute sustained winds of 75 km/h (45 mph) and one-minute sustained winds of 105 km/h (65 mph) within a few hours.[14][15] Soon afterwards, however, the system's development stalled due to land interaction with the nearby coastline of Western Australia.[15] The cyclone made landfall on Dampier Peninsula just before 09:00 UTC, approximately 85 km (55 mi) north of Broome.[16] Blake turned to the southwest and re-emerged over the Indian Ocean at 15:00 UTC; however, the system's structure had deteriorated significantly while the centre was over land.[17][18] As the weakened cyclone continued over water towards the southwest, paralleling the coastline, low vertical wind shear allowed an area of deep convection to gradually redevelop over the system on 7 January.[19] Blake made its final landfall just to the west of the Wallal Downs cattle station on Eighty Mile Beach at approximately 17:00 UTC at minimal Category 1 intensity. Within an hour of crossing the coast, the system weakened to a tropical low.[20] The JTWC discontinued advisories at 00:00 UTC on 8 January as the system moved farther inland;[21] however, the system maintained tropical storm intensity until 12 hours later.
Severe Tropical Cyclone Claudia[]
| Category 3 severe tropical cyclone (Australian scale) | |
| Category 2 tropical cyclone (SSHWS) | |
  | |
| Duration | 5 January – 18 January |
|---|---|
| Peak intensity | 150 km/h (90 mph) (10-min) 963 hPa (mbar) |
On 4 January, the BOM noted the formation of a weak tropical low over Indonesia's Maluku Islands.[22] In the ensuing days, the tropical low tracked slowly southeastwards across the Arafura Sea, towards the Gulf of Carpentaria. Significant development was hampered by strong vertical wind shear; however, very warm sea surface temperatures of up to 32 °C (90 °F) allowed the low to gradually increase in organisation.[23] On 7 January, shortly after the low passed near Cape Wessel in the Northern Territory, the BOM published their first forecast track map for the system, and issued a tropical cyclone watch for the northern coastline of Arnhem Land.[24] On the next day, the JTWC issued a Tropical Cyclone Formation Alert on the system as it began to organize just northwest of the Gove Peninsula.[25] As the system remained disorganized, the JTWC cancelled the first Tropical Cyclone Formation Alert, but later issued another one on 10 January as it re-organized itself, following land interaction with the Top End.[citation needed] It was later upgraded to a tropical cyclone by the BOM as it was northeast of Kalumburu, receiving the name Claudia on 11 January.[26] On the next day, the system was upgraded to a category 2 tropical cyclone. Several hours later, following a decrease in wind shear, Claudia's structure quickly improved, with the storm acquiring hurricane-force winds. It was then upgraded by the BOM to a severe tropical cyclone, during this intensification spell.[27]
The storm continued intensifying, indicated by an improvement of the storm's structure over the proceeding hours. The storm eventually reached its peak intensity with 1-minute sustained winds of 90 mph (145 km/h) and 969 millibars with a small, ragged eye forming on microwave imagery on 13 January. Despite this, a decrease in sea surface temperatures as it quickly accelerated eastwards caused the storm to rapidly weaken throughout 14 January, indicated by a loss of deep convection near the storm's center. The next evening on 15 January, the BOM issued their last advisory on Claudia as it began to weaken.[28] Claudia dissipated as a tropical low on 17 January.[29]
When the system was still a tropical low on 10 January, portions of the Top End received unusually large amounts of rainfall due to the system's slow movement. Darwin received 45 mm (1.7 inches) of rain, Noonamah received 56 mm (2.2 inches of rain, Pirlangimpi received 80.8 mm (3.1 inches) of rain, Charles Point received 151 mm (5.9 inches) of rain, and Dum In Mirrie Island received a staggering 410 mm (16.1 inches) of rain as a result of the system.[30]
Tropical Low 04U[]
| Tropical low (Australian scale) | |
  | |
| Duration | 23 January – 30 January |
|---|---|
| Peak intensity | Winds not specified 998 hPa (mbar) |
On 24 January, the BOM noted that a weak tropical low had formed inland over the northeastern Northern Territory, near Cresswell Downs. Embedded in a low-pressure trough stretching across northern Australia and into the South Pacific Ocean, the tropical low remained slow-moving over the ensuing days.[31] After meandering just south of the Gulf of Carpentaria, the system moved offshore at about 12:00 UTC on 27 January, just to the southeast of Mornington Island.[32] This allowed atmospheric convection to develop, and the central atmospheric pressure deepened to 998 hPa (29.47 inHg) at 18:00 UTC.[33] The system's period over water proved short-lived, however, and the tropical low moved into the Gulf Country of northern Queensland a few hours later.[34] On 29 January, the tropical low began to track rapidly southwestwards towards central Australia,[35] causing the system's convection to degrade due to interaction with the dry Australian outback. The tropical low dissipated near Alice Springs in the southern Northern Territory the following day.
Persisting thunderstorms associated with the low brought long-lived heavy rainfall throughout much of Gulf Country in northern Queensland, due to the storm's abnormally slow movement. The town of Townsville received over 320 mm (12 inches) of rain, breaking the previous daily rainfall record in the town of 190 mm (7 inches). An apartment building was reported to have "severely flooded" near the same town.[36] A peak 475 mm (18.7 inches) rainfall total was recorded at the Ayr DPI Research Station in northern Queensland, as a result of the low.[37]
Severe Tropical Cyclone Damien[]
| Category 3 severe tropical cyclone (Australian scale) | |
| Category 2 tropical cyclone (SSHWS) | |
  | |
| Duration | 3 February – 9 February |
|---|---|
| Peak intensity | 155 km/h (100 mph) (10-min) 955 hPa (mbar) |
As a monsoon trough began to develop over parts of central northern Australia on 2 February 2020, the BOM noted that an inland tropical low had formed over the Northern Territory, within the monsoon trough.[38] On 4 February, it emerged over the eastern Indian Ocean, and the JTWC labelled the system as Invest 92S. A Tropical Cyclone Formation Alert was promptly issued early the following day by the JTWC as convection began to steadily develop near the centre.[39] The next day, the JTWC issued its first advisory on the system as a tropical storm. Several hours later, the BOM followed suit, upgrading the storm to a Category 1 tropical cyclone and giving it the name Damien. Damien strengthened into a Category 3 (Australian scale) cyclone and within 48 hours hit western Australia. At that time, it was of equal intensity to a Category 2 hurricane on the Saffir–Simpson scale. On February 9, it dissipated.
In preparation for Damien, the Australian Bureau of Meteorology issued a red alert from Whim Creek to Mardie stretching south to Millstream, and a yellow alert from Port Hedland to Whim Creek extending southwards to Wittenoom. Evacuation centres were set up in Karratha and South Hedland. An urban search and rescue team was also stationed in Port Hedland.[40] Damien brought gale-force winds, torrential rain, and floods to Western Australia when it made landfall near Karratha on 8 February. Wind gusts exceeding 205 km/h (125 mph) were recorded near the landfall point. Over 230 mm (9.1 in) of rain fell in Karratha and Roebourne from 8–9 February.[41] The Department of Fire and Emergency Services received more than 100 calls for assistance.[42] Around 9,500 customers in the Pilbara region lost power. Besides downing power lines, strong winds also toppled several trees and caused some buildings to lose their roofs.[43] Karratha Airport was forced to close on the morning of 10 February after the terminal sustained damage and lost power; the airport reopened in the afternoon.[44] It was the strongest tropical cyclone to cross the Western Australia coast since Cyclone Christine in 2013.
Tropical Low Uesi[]
| Tropical low (Australian scale) | |
| Subtropical storm (SSHWS) | |
  | |
| Duration | 4 February – 14 February (Exited basin) (Out of basin on 5–13 February) |
|---|---|
| Peak intensity | 95 km/h (60 mph) (10-min) 976 hPa (mbar) |
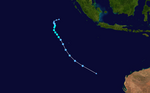
On 26 January, a low-pressure system formed to the east of the Solomon Islands, centred within a very long low-pressure trough stretching from Western Australia to the central South Pacific Ocean.[45][46] The low-pressure system tracked generally towards the west over the following days, moving into the Australian region from the South Pacific basin on 27 January.[47] On 3 February, a few days after the low-pressure trough had evolved into a monsoon trough,[48] the BOM noted that the low-pressure system had developed into a tropical low.[49] At the time, the atmospheric environment was assessed as being unfavourable for tropical cyclogenesis; however, the BOM indicated that conditions were likely to become more conducive over the following week.[49] The system moved eastwards onto the boundary of the region—the 160th meridian east—at approximately 06:00 UTC on 4 February,[50] before returning to the Australian region proper later that day.[51] By 06:00 UTC on 5 February, however, the system had moved eastwards out of the Australian region once again.[52] The system later intensified into a tropical cyclone while tracking southwards in the South Pacific basin, and was named Uesi by the Fiji Meteorological Service (FMS). Uesi reached peak intensity as a Category 3 severe tropical cyclone to the northwest of New Caledonia.
After it began to weaken on 12 February, the FMS passed official responsibility for Uesi back to the BOM at 12:00 UTC, despite the system still being located in the South Pacific basin.[53] At this time, Uesi adopted a south-southwestwards track towards the Australian region, and began to experience an increase in northwesterly vertical wind shear.[53] The cyclone's convective structure rapidly deteriorated in the increasingly hostile environment, and Uesi's low-level circulation centre soon became exposed from the central dense overcast.[53] However, despite the decreasing sea surface temperatures and the effects of wind shear and strong upper-level winds, Uesi maintained strong winds in its low-level core.[54] At 00:00 UTC on 13 February, the tropical cyclone commenced extratropical transition while approaching the Australian region, and was downgraded to a storm-force tropical low.[54][55] Ex-Tropical Cyclone Uesi re-entered the Australian region just before 15:00 UTC with sustained winds of 95 km/h (60 mph) and a central barometric pressure of 979 hPa (28.91 inHg).[56][57]
The BOM issued a tropical cyclone warning for Australian Tasman Sea territory of Lord Howe Island at 06:00 UTC on 12 February in anticipation of Uesi generating destructive winds while passing nearby.[58] A BOM forecaster noted that the island could conceivably experience winds of up to 155 km/h (95 mph) in association with the system, a fact he described as "quite extraordinary", given that winds of 120 km/h (75 mph) are only observed on the island once every ten years on average.[59] The system made its closest approach to the island at 18:00 UTC on 13 February, passing just 20 km (10 mi) to the southeast as a storm-force extratropical cyclone.[60] A few hours prior, a maximum wind gust of 154 km/h (96 mph) was observed at Windy Point and a gust of 124 km/h (77 mph) was recorded at Lord Howe Island Airport.[61][62] Minor damage to buildings and vegetation was reported across the island; however, no substantial losses were incurred.[63] As Uesi tracked further south, the BOM cancelled the tropical cyclone warning for the island at 06:00 UTC on 14 February.[64] Uesi generated powerful waves and swells along the coast of southeastern Australia while tracking through the Tasman Sea, with hazardous surf warnings issued by the BOM for beaches along the entire New South Wales coast, as well as for the Gold Coast, Sunshine Coast and Fraser Island in Queensland.[65][66] On 15 February, a man drowned and a woman was hospitalised with laceration injuries after they were overcome by the dangerous surf conditions at Bondi Beach in Sydney.[67] Uesi exited the Australian region for the final time on 15 February,[68] and tracked towards the South Island of New Zealand.
Tropical Cyclone Esther[]
| Category 1 tropical cyclone (Australian scale) | |
| Tropical storm (SSHWS) | |
  | |
| Duration | 21 February – 5 March |
|---|---|
| Peak intensity | 75 km/h (45 mph) (10-min) 988 hPa (mbar) |
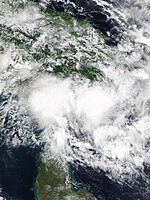
A tropical low was reported to have formed by the BOM in the Gulf of Carpentaria on 21 February.[69] The tropical low quickly organized over the pursuing days, showing significant bursts of convection to the north of its centre. The low was eventually upgraded into a Category 1 tropical cyclone, being given the name Esther on 23 February. Moving quickly south, Esther eventually made its first landfall on Mornington Island around 20:30 UTC, where a peak 988 mb pressure reading was recorded.[70] Esther retained its intensity despite the land interaction, and make its second and final landfall near the Northern Territory–Queensland border 6 hours later at 2:00 UTC, 24 February.[71] Weakening below tropical storm intensity quickly after landfall. Esther was declared to have become a Ex-Tropical Cyclone about 2 hours later.[citation needed] Continuing to move further inland under the influence of a subtropical ridge, Esther's remnants shifted in a more westerly direction. Esther's convection and structure however stayed consistent far inland and led to the JTWC noting a low possibility of regeneration as it moved west towards the Eastern Indian Ocean.[72] Over the proceeding days, Esther's remnant low was given a medium chance of re-development over land. As a result of the brown ocean effect, Esther's convection steadily re-developed over land on 27 February as it drew moisture from the nearby water. A Tropical Cyclone Formation Alert was then issued for the system's remnants that same day as it was now likely to briefly emerge over the Joseph Bonaparte Gulf. However, by the next day, Esther was deemed not likely to emerge overseas contrary to forecast and the TCFA was cancelled while its convection weakened yet again. On 29 February, the TCFA was re-issued as Esther's center skirted the northeastern Kimberley coast. On 1 March, the TCFA was once again cancelled as the system began moving further inland. As it did so, convection decreased rapidly. The remnants persisted for 4 days, before finally dissipating in the Australian desert.
Rainfall from Ex-Tropical Cyclone Esther caused much welcome rainfall to normally dry areas across the Northern Territory, where some flooding was reported. As much as 258 mm (10.15 inches) of rain fell at the cattle stations Eva Downs Station and 107 mm (4.21 inches) at Anthony Lagoon Station.[73] In preparation for severe thunderstorms associated with the cyclone's remnants, Flood Warnings and Watches were issued across much of the Top End (including Darwin) throughout Esther's passage.[74]
Severe Tropical Cyclone Ferdinand[]
| Category 3 severe tropical cyclone (Australian scale) | |
| Category 3 tropical cyclone (SSHWS) | |
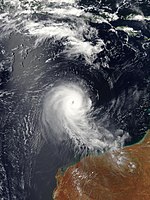  | |
| Duration | 22 February – 1 March |
|---|---|
| Peak intensity | 155 km/h (100 mph) (10-min) 960 hPa (mbar) |
At around 23:00 UTC on 22 February, the BOM reported that a tropical low had developed within a low-pressure trough over the far-eastern Indian Ocean.[75] Located approximately 285 km (175 mi) south-southwest of Indonesia's Sumba island, the system remained slow-moving initially, before adopting a track towards the southwest on 23 February.[76][77] The tropical low developed rapidly in a favourable environment for intensification characterised by abundant atmospheric moisture, sea surface temperatures in excess of 30 °C (86 °F), low vertical wind shear and strong outflow in the upper troposphere.[77][78] The tropical low's convective structure improved considerably during the night, and the JTWC upgraded the system to a tropical storm on the Saffir–Simpson hurricane wind scale (SSHWS) at 18:00 UTC.[78] The BOM followed suit at 00:00 UTC on 24 February, officially upgrading the system to a Category 1 tropical cyclone on the Australian scale and assigning the name Ferdinand.[79]
Ferdinand continued to track slowly southwestwards while gradually intensifying, before turning towards the south at 12:00 UTC.[80] Despite deep convection continuing to develop near the centre of the cyclone throughout the day and into the evening, the system was not able to consistently maintain cold cloud top temperatures.[81] In the diurnally favourable overnight period, however, increased deep convection began to wrap around the centre, and an intermittent eye feature emerged on enhanced infrared satellite imagery. The small size of Ferdinand's wind field allowed the system to strengthen rapidly into a Category 3 severe tropical cyclone on the Australian scale at 00:00 UTC on 25 February.[82] Ferdinand was also upgraded to Category 1 on the SSHWS by the JTWC at this time.[83] The rapid intensification phase continued throughout the day as deep convection bloomed around the system's warming eye and rapidly consolidating eyewall structure. Ferdinand strengthened to Category 2 intensity on the SSHWS just six hours later.[84] The BOM reported that Ferdinand peaked in intensity at around 18:00 UTC as a high-end Category 3 severe tropical cyclone on the Australian scale, with estimated maximum 10-minute sustained winds of 155 km/h (95 mph) and a central barometric pressure of 960 hPa (28.35 inHg).[85][86] At the time, the JTWC assessed the system as a maximal Category 2 tropical cyclone on the SSHWS, with estimated one-minute sustained winds of 175 km/h (110 mph).[87] Despite being a strong tropical cyclone, no rain or wind impacts were observed in Western Australia due to Ferdinand's highly compact wind field, with sustained gale-force winds extending only 95 km (60 mi) from the circulation centre.[85]
Around this time, Ferdinand's equatorward outflow channel began to be affected by outflow from the approaching Ex–Tropical Cyclone Esther, located approximately 1890 km (1175 mi) to the east, over the Northern Territory.[87] During 26 February, a layer of peripheral dry air in the lower troposphere also started becoming entrained into the system's circulation.[88] The combined effects of these atmospheric changes caused Ferdinand to begin to weaken quickly. The previously well-defined eye became indiscernible on satellite imagery, and deep convection began to reduce in coverage around the system.[89] Ferdinand weakened to Category 1 on the SSHWS at 00:00 UTC the following day, and the BOM downgraded the system to Category 2 on the Australian scale six hours later.[90][91] Under the steering influence of a mid-level ridge located to the southeast, Ferdinand began tracking towards the west-northwest, and then westwards, on 27 February.[92][93] After being downgraded to a tropical storm on the SSHWS at 12:00 UTC,[94] Ferdinand's rate of weakening slowed considerably, with the system maintaining a relatively constant intensity throughout the overnight period despite dry air wrapping entirely around the cyclone.[95][96]
Tropical Low 09U[]
| Tropical low (Australian scale) | |
| Tropical storm (SSHWS) | |
  | |
| Duration | 9 March – 13 March |
|---|---|
| Peak intensity | 75 km/h (45 mph) (10-min) 997 hPa (mbar) |
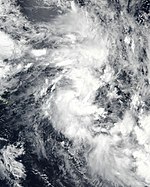
During early March, a monsoon trough began to develop over the eastern Indian Ocean as a pulse of the Madden–Julian Oscillation moved into the Maritime Continent, bringing increased cloudiness and convective activity to Australian longitudes.[97][98][99] On 9 March, the BOM reported that a tropical low had begun to form to the south of Java, embedded within the monsoon trough.[100][101] The atmospheric environment was assessed as being broadly unfavourable for tropical cyclogenesis; however, the BOM noted that there was a small possibility of the system briefly reaching tropical cyclone strength over the following days.[100] The tropical low steadily organised as it tracked southwards, with deep convection developing over the low-level circulation centre and the minimum atmospheric pressure falling to 999 hPa (29.50 inHg) by 18:00 UTC on 10 March.[102] Around the same time, the JTWC issued a Tropical Cyclone Formation Alert, citing the system's improving structure, sustained winds near gale force detected by a satellite's scatterometer instrument, and environmental conditions they assessed as being favourable for intensification.[103]
At 06:00 UTC on 11 March, the JTWC determined that a small area of sustained gale-force winds had developed under the deep convection in the southern semicircle of the circulation, and hence classified the system as Tropical Storm 21S. Low vertical wind shear, warm sea surface temperatures and a good poleward outflow channel were forecast to remain sufficient to support the system's intensity in the short term.[104] Weakening soon commenced, however, as the limited deep convection became sheared to the east, leaving the low-level circulation centre fully exposed. The entrainment of cold, dry air into the circulation contributed further to the weakening trend,[105] and the central atmospheric pressure began to rise.[106] The system fell below tropical storm intensity by 00:00 UTC on 12 March as it tracked southwestwards towards the coast of Western Australia.[107] Despite classifying the system as a tropical low, the BOM issued a severe weather warning for a small coastal stretch of the Pilbara and Gascoyne regions, warning of the possibility of sustained gale-force winds and heavy rainfall from the system.[108] The tropical low made landfall on the eastern coast of the Exmouth Gulf in the early hours of 13 March (local time), and began tracking towards the south.[109][110] The system moved generally parallel to the western coast of Western Australia until dissipating as a tropical system by 21:00 UTC on 14 March,[111] roughly 400 km (250 mi) northwest of Perth.[112]
During 11 March, the tropical low passed to the west of Rowley Shoals, a group of coral reefs centred approximately 315 km (195 mi) west-northwest of Broome. Imperieuse Reef recorded maximum 10-minute sustained winds of 59 km/h (37 mph) and a gust to 74 km/h (46 mph) at around 02:00 UTC as the system was located nearby.[113] Sustained gale-force winds were later observed on the far western Pilbara coast and nearby islands as the tropical low approached on 12 March. Barrow Island recorded 10-minute sustained winds of 76 km/h (47 mph) and a gust to 91 km/h (57 mph) at 09:00 UTC,[114] and Thevenard Island experienced sustained winds of up to 74 km/h (46 mph) and a gust of 102 km/h (63 mph).[115] The town of Onslow also recorded a short period of sustained gales, reaching 67 km/h (42 mph).[116]
Tropical Cyclone Gretel[]
| Category 1 tropical cyclone (Australian scale) | |
| Tropical storm (SSHWS) | |
  | |
| Duration | 10 March – 14 March (Exited basin) |
|---|---|
| Peak intensity | 75 km/h (45 mph) (10-min) 990 hPa (mbar) |
On 8 March, the BOM noted that a strong pulse of the Madden–Julian Oscillation was located in the Maritime Continent, generating increased rainfall and cloudiness, and elevating the risk of tropical cyclone formation in the waters to the north of Australia.[99] A monsoon trough developed across the Arafura Sea the following day,[117] and by 00:00 UTC on 10 March, the BOM reported that a tropical low had formed in the area.[118] Originally located approximately 250 km (155 mi) west-northwest of Weipa,[118] the tropical low began tracking southeastwards over the following days, making landfall at Aurukun on the western coast of Cape York Peninsula as a very weak system on the morning of 11 March.[119] The tropical low re-emerged over water by 12:00 UTC on 11 March, and began to track east-southeastwards across the Coral Sea.[120]
Initially forecast to develop steadily and reach tropical cyclone strength near Willis Island by the evening of 13 March,[120] the system instead struggled to form a defined centre of circulation within a broad and complex area of low pressure.[121] Eventually, a dominant circulation centre began to coalesce underneath a bloom of deep convection on the northern side of the low-pressure area, at which time the tropical low began to accelerate towards the east-southeast.[121] The system intensified steadily thereafter, acquiring sustained gale-force winds in the northern semicircle by 12:00 UTC on 14 March. The BOM upgraded the system to a tropical cyclone three hours later, and named the storm Gretel.[122] By this time, however, the system was quickly approaching the eastern boundary of the Australian cyclone region, leaving only a short period of time for further intensification within the basin. Gretel crossed into the South Pacific cyclone region just after 18:00 UTC on 14 March as a Category 1 tropical cyclone on the Australian scale, with maximum 10-minute sustained winds of 75 km/h (45 mph) and a central barometric pressure of 990 hPa (29.23 inHg).[123][124]
The interaction between the developing tropical low and a high-pressure ridge positioned along the Queensland east coast generated a strong pressure gradient on the western side of the system.[121] As a result, exposed sections of North Queensland's east coast and the nearby reefs and islands experienced strong winds, despite being located a considerable distance from the tropical low itself. In particular, the airport on Hamilton Island recorded several days of sustained near-gale to gale-force winds, peaking at 78 km/h (48 mph) at 17:40 UTC on 12 March, with a maximum gust of 104 km/h (65 mph) observed one hour prior.[125] Hamilton Island also received 175.0 millimetres (6.89 in) of rainfall in the 72 hours to 23:00 UTC on 12 March, including 46.0 millimetres (1.81 in) in a 46-minute period on the morning of 11 March.[125]
Tropical Low 11U[]
| Tropical low (Australian scale) | |
  | |
| Duration | 31 March – 3 April |
|---|---|
| Peak intensity | 55 km/h (35 mph) (10-min) 999 hPa (mbar) |
A low-pressure trough developed to the north of Australia during late March, associated with an increase in easterly winds from the Coral Sea.[126] On 29 March, the BOM noted that a tropical low had begun to form within the trough, centred over the Torres Strait, near the southwestern coast of Papua New Guinea.[127] Upon its formation, the tropical low was given the identifier code 11U by the BOM. The system meandered slowly towards the east-northeast over the ensuing days, passing into the area of responsibility of the Papua New Guinea National Weather Service.[128] Despite tracking through a favourable environment, land interaction prevented any significant intensification from occurring, with the tropical low's circulation remaining broad and the deep convection fragmented.[129] The system attained its peak intensity on the morning of 2 April, with maximum 10-minute sustained winds of 55 km/h (35 mph), and a minimum central pressure of 999 hPa (29.50 inHg). The tropical low dissipated on 3 April while over water in the Gulf of Papua.[130]
Tropical Cyclone Harold[]
| Category 1 tropical cyclone (Australian scale) | |
| Tropical storm (SSHWS) | |
  | |
| Duration | 1 April – 2 April (Exited basin) |
|---|---|
| Peak intensity | 65 km/h (40 mph) (10-min) 998 hPa (mbar) |
On 1 April, a tropical low formed within a monsoon trough, centered between the Solomon Islands and the eastern coast of Papua New Guinea.[131] The environment was highly conducive for intensification, with the presence of dual-channel upper outflow, low vertical wind shear and warm sea surface temperatures.[132] The tropical low organised rapidly as it tracked towards the east-southeast over the Solomon Sea, developing tightly curved convective banding and exceeding intensity estimates from several sources, including numerical weather prediction products, the Dvorak technique and some satellite-based analyses.[133] The BOM upgraded the system to a Category 1 tropical cyclone on the Australian scale at 06:00 UTC on 2 April, and named it Harold.[134] Development slowed over the following hours, with the system maintaining low-end Category 1 winds while approaching the eastern border of the Australian cyclone region.[135] At around 21:00 UTC, Harold crossed into the South Pacific cyclone region just to the south of Guadalcanal in the Solomon Islands, and the Fiji Meteorological Service assumed responsibility for the system.[136]
Tropical Low Jeruto[]
| Tropical low (Australian scale) | |
  | |
| Duration | 10 April – 13 April (Exited basin) |
|---|---|
| Peak intensity | 55 km/h (35 mph) (10-min) 1006 hPa (mbar) |
On 9 April, satellite scatterometer data indicated the presence of a broad low pressure circulation in the central Indian Ocean, near the western edge of the Australian region.[137] The following day, the BOM reported that the system had developed into a weak tropical low, centred within a low pressure trough.[138][139] The system remained mostly stationary for the next several days as low vertical wind shear, warm sea surface temperatures and good divergence in the upper troposphere allowed convection to develop over the tropical low.[140][141] The low-level circulation began to consolidate into a more circular structure by 12 April,[142] centred approximately 515 km (320 mi) to the west-northwest of the Cocos Islands.[141] Around this time, the tropical low assumed a more consistent course towards the southwest, and crossed over the 90th meridian east into the South-West Indian Ocean cyclone region late on 13 April.[143][144][145] The system was classified as Tropical Depression 12 by Météo-France's La Réunion office shortly thereafter,[144] and later strengthened into Moderate Tropical Storm Jeruto.[146]
The tropical low and its associated low-pressure trough generated light rainfall in the Cocos Islands while located nearby. The airport on West Island received 17.6 millimetres (0.69 in) of rain on 10–13 April.[147] Maximum 10-minute sustained winds of 44 km/h (27 mph), gusting to 57 km/h (35 mph), were also observed for a short period on 14 April.[148]
Tropical Depression[]
| Tropical depression (Australian scale) | |
  | |
| Duration | 3 May – 10 May |
|---|---|
| Peak intensity | 55 km/h (35 mph) (10-min) 1004 hPa (mbar) |
During late April, a strong pulse of the Madden–Julian oscillation (MJO) tracked eastwards across the equatorial Indian Ocean, and approached Australian longitudes by early May. The presence of the MJO enhanced convective activity in the region, generating areas of increased cloudiness and rainfall across the Maritime Continent.[149] On 1 May, a low-pressure system formed west of Indonesia's Mentawai Islands, centred within a low-pressure trough near the Equator.[150] The system tracked east-southeastwards towards Sumatra over the following days, and on 3 May, the BOM reported that it had developed into a tropical low.[151] Situated approximately 305 km (190 mi) southwest of the Sumatran coastal city of Bengkulu, the system was located within the area of responsibility of TCWC Jakarta, who classified it as a tropical depression.[152] The depression began to track southwards on 4 May,[152] and soon began to show signs of organisation, with intermittent deep convection developing over the low-level circulation centre.[153] Citing a favourable environment for intensification, including very low vertical wind shear, anomalously warm sea surface temperatures and a good poleward outflow channel, the JTWC issued a Tropical Cyclone Formation Alert for the system on 5 May.[153] This was later cancelled as the depression tracked westwards into an area of increasing vertical wind shear.[154] The depression continued westwards over the following days without intensification, passing to the north of the Cocos Islands, and dissipated by 10 May.[155][156]
As the system developed near Indonesia as a tropical depression on 5 May, TCWC Jakarta issued an extreme weather warning for southern Sumatra, western Java, the Bangka Belitung Islands and other nearby islands.[152] The areas were warned to expect moderate to heavy rainfall and strong winds, as well as wave heights reaching 4 m (13 ft) in Indian Ocean waters off the south coast and in the Sunda Strait.[157]
Tropical Cyclone Mangga[]
| Category 1 tropical cyclone (Australian scale) | |
| Tropical storm (SSHWS) | |
  | |
| Duration | 19 May – 23 May |
|---|---|
| Peak intensity | 65 km/h (40 mph) (10-min) 995 hPa (mbar) |
After being mostly indiscernible for the preceding week, the Madden–Julian Oscillation (MJO) redeveloped over the central equatorial Indian Ocean during mid May, and began to track towards the Maritime Continent. The return of an active pulse of the MJO led to an increase in cloudiness and convective activity across the region, and also contributed to the formation of twin cyclones, with the other being Super Cyclonic Storm Amphan in the Bay of Bengal.[158] On 19 May, the BOM noted that a low-pressure system centred with a low-pressure trough in the far northwestern part of the basin had developed into an off-season tropical low.[159][160] Situated approximately 790 km (490 mi) southwest of Padang in Sumatra, the system was located within the area of responsibility of TCWC Jakarta.[160] Environmental conditions were assessed as favourable for tropical cyclogenesis by Météo-France and the JTWC, with warm sea surface temperatures, low vertical wind shear, sufficient moisture in the mid troposphere, and a good poleward outflow channel.[161][162] Citing these conditions, the JTWC issued a Tropical Cyclone Formation Alert for the system early on 20 May.[163]
As the tropical low tracked slowly towards the southwest, the previously fragmented deep convection began to consolidate over the centre of the broad low-level circulation.[163][164] Owing to the development of gale-force westerly winds to the north of the system by the afternoon of 20 May, the JTWC upgraded the system to a tropical storm at 03:00 UTC the following day.[164] The tropical low soon adopted a track towards the south-southeast under the influence of a high-pressure ridge to the northeast.[165] Despite being located within an otherwise favourable environment for development, the system's low level circulation remained broad and weakly defined as moderate easterly vertical wind shear hampered the development of persistent deep convection near the centre.[165] Supported by strong upper-level outflow, a burst of deep convection began to bloom near the centre of the struggling tropical low at around 12:00 UTC,[166] at which point TCWC Jakarta upgraded the system to a Category 1 tropical cyclone on the Australian scale, assigning the name Mangga.[167]
Due to the potential of the tropical low to generate for moderate to heavy rainfall, TCWC Jakarta issued an extreme weather warning for the southwestern coast of Sumatra and the westernmost part of Java on 21 May.[168][169] Wave heights were also forecast to reach 6 m (20 ft) in Indian Ocean waters near the Mentawai Islands and the southwestern coasts of Sumatra and Java, and up to 4 m (13 ft) in the Sunda Strait and other areas.[169] Severe weather warnings were later issued for the entire western area of Western Australia as the remnants of the low combined with a passing cold front to bringing damaging winds, raised dust and heavy rain in what was described as a "once in a decade" storm.[170] Over 60,000 properties lost power in south-western Western Australia, particularly in Perth, Geraldton, Kalgoorlie and Margaret River. A wind gust of 132 km/h was reported at Cape Leeuwin.[171]
Other systems[]
A weak tropical low began to develop over the eastern Indian Ocean within a low-pressure trough on 31 January, approximately 460 km (285 mi) east-northeast of the Cocos Islands and 500 km (310 mi) west of Christmas Island.[172] The system tracked slowly towards the south-southwest over the following days with little development.[173] The system began to gradually decay as it neared the Cocos Islands, and it dissipated as a tropical low by 4 February.[174]
Increased winds were observed in the vicinity of the tropical low in the Cocos Islands, with a maximum wind gust of 44 km/h (27 mph) recorded at the local airport at 01:29 UTC on 2 February.[175] In addition, 28.8 millimetres (1.13 in) of rainfall fell on Christmas Island from 31 January to 2 February on the eastern side of the tropical low.[176]
Late on 6 February, the BOM noted that a tropical low had developed within a low-pressure trough near the Australian region's western border, approximately 200 km (125 mi) west of the Cocos Islands.[177] The tropical low remained nearly stationary over the central Indian Ocean for the next few days with little development,[178] before dissipating late on 8 February.[179]
The Cocos Islands received 34.4 millimetres (1.35 in) of rainfall during the 48 hours to 03:00 UTC on 8 February when the tropical low was located nearby, as well as a maximum wind gust to 39 km/h (24 mph) at 01:44 UTC on 8 February.[180][181] An extended rainfall total of 108.0 millimetres (4.25 in) was recorded on the islands during the five days to 03:00 UTC on 10 February as a result of the slow-moving low-pressure system and its associated trough.[180]
The BOM indicated that a tropical low had developed on the western border of the Australian region over the central Indian Ocean at 06:00 UTC on 13 February.[182] The tropical low was located in a concentrated area of convection being enhanced by the monsoon trough established across the South-West Indian Ocean cyclone region.[183] Within twelve hours, the tropical had moved westwards out of the Australian region,[184] where Météo-France's office on La Réunion assessed the system as having a low probability of intensification into a tropical cyclone.[183]
In the midst of an active pulse of the Madden–Julian oscillation over the tropical western Pacific Ocean, the BOM noted that a tropical low had formed within a low-pressure trough over the northeastern Coral Sea on 15 February.[185][186][187] The slow-moving system was assessed as having a very low probability of developing into a tropical cyclone in the short term.[186] The tropical low attained a minimum barometric pressure of 1002 hPa before moving into the South Pacific cyclone region by 17 February,[188] where the system was designated as Tropical Disturbance 08F by the Fiji Meteorological Service.
Ex-Tropical Cyclone Irondro entered the Australian region at 06:00 UTC on 6 April, located approximately 2,575 km (1,600 mi) to the west-northwest of Perth.[189] Upon entering the region, the Bureau of Meteorology estimated the system's central pressure as 993 hPa (29.32 inHg).[190] At this time, the JTWC assessed the system as a low-end tropical storm, with maximum one-minute sustained winds of 75 km/h (45 mph). The system had commenced extratropical transition around the time of entering the region due to the effects of hostile vertical wind shear and sea surface temperatures decreasing below 25 °C (77 °F).[191] Ex-Irondro was downgraded to a remnant low by 18:00 UTC.[192]
Storm names[]
Bureau of Meteorology[]
The Australian Bureau of Meteorology monitors all tropical cyclones within the region, and assigns names to tropical cyclones that form outside of the areas of responsibility of TCWC Jakarta and TCWC Port Moresby. The names for the 2019–20 season are listed below:
|
|
TCWC Jakarta[]
The tropical cyclone warning centre in Jakarta monitors tropical cyclones from the Equator to 11°S and between the longitudes 90°E and 145°E. If a tropical depression reach tropical cyclone strength within TCWC Jakarta's area of responsibility, it will be assigned the next name from the following list:[193][194]
|
|
TCWC Port Moresby[]
Tropical cyclones that develop between the Equator and 11°S, between 151°E and 160°E, are assigned names by the tropical cyclone warning centre in Port Moresby, Papua New Guinea. Tropical cyclone formation in this area is rare, and no cyclones have been named in it since 2007.[195] As names are assigned in a random order the whole list is shown below:
|
|
Others[]
If a tropical cyclone enters the Australian region from the South Pacific basin (east of 160°E), it will retain the name assigned to it by the Fiji Meteorological Service (FMS) or MetService. Similarly, if a tropical cyclone enters the Australian region from the South-West Indian Ocean cyclone region (west of 90°E), it will retain the name assigned to it on behalf of Météo-France La Réunion by the Sub-Regional Tropical Cyclone Advisory Centres in Mauritius or Madagascar. This season, the following systems were named in this manner:
- Uesi (named by FMS)
- Irondro (named by Météo-France)
- Jeruto (named by Météo-France)
Notably, Irondro was the next named cyclone to appear in the region after Harold with the alphabetical sequencing purely coincidental in nature.
Retirement[]
Later in 2020, the Bureau of Meteorology retired the names Damien and Harold, replacing them and Declan and Heath respectively due to the damage caused by both systems in Western Australia and the South Pacific respectively.[196] The name Mangga was also retired from the Jakarta TCWC and replaced with the name Pisang for the next list, also due to damage caused in Western Australia.[196]
Season effects[]
| Name | Dates | Peak intensity | Areas affected | Damage (US$) |
Deaths | |||
|---|---|---|---|---|---|---|---|---|
| Category | Wind speed (km/h (mph)) |
Pressure (hPa) | ||||||
| Blake | 4–8 Jan. | Category 1 tropical cyclone | 75 (45) | 986 | Western Australia | Minor | 0 | |
| Claudia | 5–18 Jan. | Category 3 severe tropical cyclone | 140 (85) | 969 | Eastern Indonesia, Top End, Kimberley | None | 0 | |
| 04U | 23–30 Jan. | Tropical low | Not specified | 998 | Northern Territory, Queensland | None | 0 | |
| TL | 31 Jan. – 4 Feb. | Tropical low | Not specified | 1007 | Cocos Islands, Christmas Island | None | 0 | |
| Damien | 3–9 Feb. | Category 3 severe tropical cyclone | 155 (100) | 955 | Northern Territory, Western Australia | $4.3 million | 0 | [197] |
| Uesi | 4–14 Feb. | Tropical low | 95 (60) | 976 | Solomon Islands, Vanuatu, New Caledonia, Lord Howe Island, South East Queensland, New South Wales, New Zealand | Minor | 1 | [67] |
| TL | 6–8 Feb. | Tropical low | Not specified | 1007 | Cocos Islands | None | 0 | |
| TL | 13 Feb. | Tropical low | Not specified | 1009 | None | None | 0 | |
| 08F | 15–17 Feb. | Tropical low | Not specified | 1002 | Solomon Islands | None | 0 | |
| Esther | 21 Feb. – 5 Mar. | Category 1 tropical cyclone | 75 (45) | 988 | Australia | None | 0 | |
| Ferdinand | 22 Feb. – 1 Mar. | Category 3 severe tropical cyclone | 155 (100) | 960 | Lesser Sunda Islands | None | 0 | |
| 09U | 9–13 Mar. | Tropical low | 75 (45) | 997 | Western Indonesia, Western Australia | None | 0 | |
| Gretel | 10–14 Mar. | Category 1 tropical cyclone | 75 (45) | 990 | Top End, New Guinea, Queensland, New Caledonia |
None | 0 | |
| 11U | 31 Mar. – 3 Apr. | Tropical low | 55 (35) | 999 | New Guinea, Cape York Peninsula | None | 0 | |
| Harold | 1–2 Apr. | Category 1 tropical cyclone | 65 (40) | 997 | Papua New Guinea, Solomon Islands | Unknown | 27 | [198] |
| Irondro | 6 Apr. | Category 1 tropical cyclone | 65 (40) | 994 | None | None | 0 | |
| Jeruto | 10–13 Apr. | Tropical low | 55 (35) | 1006 | Cocos Islands | None | 0 | |
| TD | 3–10 May | Tropical depression | 55 (35) | 1004 | Western Indonesia, Christmas Island, Cocos Islands | None | 0 | |
| Mangga | 19–23 May | Category 1 tropical cyclone | 65 (40) | 995 | Western Indonesia, Cocos Islands, Christmas Island, Western Australia | Minor | 0 | |
| Season aggregates | ||||||||
| 19 systems | 4 Jan. – 23 May | 155 (100) | 955 | Unknown | 28 | |||
See also[]
- Australian region tropical cyclone
- Tropical cyclones in 2019, 2020
- List of Southern Hemisphere tropical cyclone seasons
- Atlantic hurricane seasons: 2019, 2020
- Pacific hurricane seasons: 2019, 2020
- Pacific typhoon seasons: 2019, 2020
- North Indian Ocean cyclone seasons: 2019, 2020
- 2019–20 South-West Indian Ocean cyclone season
- 2019–20 South Pacific cyclone season
References[]
- ^ Jump up to: a b c d e f g h "Australian Tropical Cyclone Outlook for 2019 to 2020". Australian Bureau of Meteorology. 11 October 2019. Archived from the original on 14 October 2019. Retrieved 14 October 2019.
- ^ Jump up to: a b c d Southwest Pacific Tropical Cyclone Outlook - October 2019 (Report). National Institute of Water and Atmospheric Research. 11 October 2019. Retrieved 11 October 2019.
- ^ Jump up to: a b c d "South Pacific Tropical Cyclone Outlook for 2019 to 2020". Australian Bureau of Meteorology. 11 October 2019. Retrieved 11 October 2019.
- ^ Jump up to: a b "ENSO Wrap-Up: Overview". Australian Bureau of Meteorology. 15 October 2019. Archived from the original on 15 October 2019. Retrieved 17 October 2019.
- ^ "ENSO Wrap-Up: Indian Ocean". Australian Bureau of Meteorology. 1 October 2019. Archived from the original on 1 October 2019. Retrieved 14 October 2019.
- ^ "ENSO Wrap-Up: Overview". Australian Bureau of Meteorology. 1 October 2019. Archived from the original on 1 October 2019. Retrieved 17 October 2019.
- ^ "Western Region Tropical Cyclone Outlook". Australian Bureau of Meteorology. 4 January 2020. Archived from the original on 4 January 2020. Retrieved 4 January 2020.
- ^ "Significant Tropical Weather Advisory for the Indian Ocean (91S)". United States Joint Typhoon Warning Center. 4 January 2020. Archived from the original on 4 January 2020. Retrieved 4 January 2020.
- ^ "Tropical Low 02U Forecast Track Map #4 (00Z)". Australian Bureau of Meteorology. 5 January 2020. Archived from the original on 5 January 2020. Retrieved 5 January 2020.
- ^ "Tropical Cyclone Formation Alert (06S)". United States Joint Typhoon Warning Center. 5 January 2020. Archived from the original on 5 January 2020. Retrieved 5 January 2020.
- ^ "Tropical Low 02U Forecast Track Map #8 (15Z)". Australian Bureau of Meteorology. 5 January 2020. Archived from the original on 5 January 2020. Retrieved 5 January 2020.
- ^ "Tropical Cyclone 06S Warning #1 (18Z)". United States Joint Typhoon Warning Center. 5 January 2020. Archived from the original on 5 January 2020. Retrieved 5 January 2020.
- ^ "Tropical Cyclone Blake Forecast Track Map #11 (00Z)". Australian Bureau of Meteorology. 6 January 2020. Archived from the original on 6 January 2020. Retrieved 6 January 2020.
- ^ "Tropical Cyclone Blake Forecast Track Map #13 (06Z)". Australian Bureau of Meteorology. 6 January 2020. Archived from the original on 6 January 2020. Retrieved 6 January 2020.
- ^ Jump up to: a b "Tropical Cyclone 06S Warning #3 (06Z)". United States Joint Typhoon Warning Center. 6 January 2020. Archived from the original on 6 January 2020. Retrieved 6 January 2020.
- ^ "Tropical Cyclone Blake Forecast Track Map #14 (09Z)". Australian Bureau of Meteorology. 6 January 2020. Archived from the original on 6 January 2020. Retrieved 6 January 2020.
- ^ "Tropical Cyclone Blake Forecast Track Map #16 (15Z)". Australian Bureau of Meteorology. 6 January 2020. Archived from the original on 6 January 2020. Retrieved 6 January 2020.
- ^ "Tropical Cyclone Blake Technical Bulletin #3 (18Z)". Australian Bureau of Meteorology. 6 January 2020. Archived from the original on 6 January 2020. Retrieved 6 January 2020.
- ^ "Tropical Cyclone Blake Technical Bulletin #4 (00Z)". Australian Bureau of Meteorology. 7 January 2020. Archived from the original on 7 January 2020. Retrieved 7 January 2020.
- ^ "Tropical Cyclone Blake Forecast Track Map #25 (18Z)". Australian Bureau of Meteorology. 7 January 2020. Archived from the original on 7 January 2020. Retrieved 7 January 2020.
- ^ "Tropical Cyclone 06S Warning #10 (00Z)". United States Joint Typhoon Warning Center. 8 January 2020. Archived from the original on 8 January 2020. Retrieved 8 January 2020.
- ^ "Northern Region Tropical Cyclone Outlook". Australian Bureau of Meteorology. 4 January 2020. Archived from the original on 4 January 2020. Retrieved 4 January 2020.
- ^ "Significant Tropical Weather Advisory for the Pacific Ocean (06Z)". United States Joint Typhoon Warning Center. 6 January 2020. Archived from the original on 6 January 2020. Retrieved 6 January 2020.
- ^ "Tropical Low 03U Forecast Track Map #1 (00Z)". Australian Bureau of Meteorology. 7 January 2020. Archived from the original on 7 January 2020. Retrieved 7 January 2020.
- ^ "Tropical Cyclone Formation Alert (07S)". United States Joint Typhoon Warning Center. 8 January 2020. Archived from the original on 8 January 2020. Retrieved 8 January 2020.
- ^ "Tropical Cyclone Advice Number 31". Bureau of Meteorology. 11 January 2020. Archived from the original on 11 January 2020. Retrieved 11 January 2020.
- ^ "Severe Tropical Cyclone Claudia Forecast Track Map". Bureau of Meteorology. 12 January 2020. Archived from the original on 12 January 2020. Retrieved 12 January 2020.
- ^ "Ex-TC Claudia Forecast Track". Australian Bureau of Meteorology. Archived from the original on 15 January 2020. Retrieved 15 January 2020.
- ^ "Western Area High Seas Forecast". Australian Bureau of Meteorology. 17 January 2020. Archived from the original on 18 January 2020. Retrieved 18 January 2020.
- ^ Aisthorpe, Judith; Perera, Alicia (10 January 2020). "Darwin cops a drenching as the Big Wet arrives ... and there may still be more to come". Northern Territory News. Retrieved 11 January 2020.
- ^ "Australian Region MSLP Analysis Chart (00Z)". Australian Bureau of Meteorology. 26 January 2020. Archived from the original on 26 January 2020. Retrieved 28 January 2020.
- ^ "Australian Region MSLP Analysis Chart (12Z)". Australian Bureau of Meteorology. 27 January 2020. Archived from the original on 27 January 2020. Retrieved 28 January 2020.
- ^ "Australian Region MSLP Analysis Chart (18Z)". Australian Bureau of Meteorology. 27 January 2020. Archived from the original on 27 January 2020. Retrieved 28 January 2020.
- ^ "Northern Region Tropical Cyclone Outlook". Australian Bureau of Meteorology. 28 January 2020. Archived from the original on 28 January 2020. Retrieved 28 January 2020.
- ^ "Australian Region MSLP Analysis Chart (18Z)". Australian Bureau of Meteorology. 29 January 2020. Archived from the original on 29 January 2020. Retrieved 31 January 2020.
- ^ "Rain record broken near Townsville as a monsoonal low tracks across Queensland's north-west". ABC News (Australia). 28 January 2020. Retrieved 1 February 2020.
- ^ "Weekly Rainfall Update for 7 days to 9 am 28 January 2020". Bureau of Meteorology (BOM). 28 January 2020. Retrieved 1 February 2020.
- ^ "Northern Region Tropical Cyclone Outlook". Australian Bureau of Meteorology. 2 February 2020. Archived from the original on 2 February 2020. Retrieved 2 February 2020.
- ^ "Tropical Cyclone Formation Alert". Joint Typhoon Warning Center. Retrieved 5 February 2020.
- ^ "Cyclone Damien intensifies off WA coast as Karratha braces for impact on Saturday". ABC News. 8 February 2020. Retrieved 9 February 2020.
- ^ Moussalli, Isabel; Shine, Rhiannon (9 February 2020). "Tropical Cyclone Damien brings flooding, gale-force winds and storm surges to WA's north". ABC News. Retrieved 9 February 2020.
- ^ "Tropical Cyclone Damien brings rain, gale force winds to WA's Pilbara". ABC News. 9 February 2020. Retrieved 9 February 2020.
- ^ Hickey, Phil (9 February 2020). "Cyclone Damien: Pilbara residents survey damage as cyclone tears off roofs, uproots trees". The West Australian. Retrieved 9 February 2020.
- ^ "Karratha Airport damaged by Cyclone". Australian Aviation. 10 February 2020. Retrieved 13 February 2020.
- ^ "Australian Region MSLP Chart (00Z)". Australian Bureau of Meteorology. 26 January 2020. Archived from the original on 26 January 2020. Retrieved 3 February 2020.
- ^ "Pacific Ocean MSLP Chart (00Z)". Australian Bureau of Meteorology. 26 January 2020. Archived from the original on 26 January 2020. Retrieved 3 February 2020.
- ^ "Australian Region MSLP Analysis Chart (12Z)". Australian Bureau of Meteorology. 27 January 2020. Archived from the original on 27 January 2020. Retrieved 3 February 2020.
- ^ "Australian Region MSLP Analysis Chart (06Z)". Australian Bureau of Meteorology. 31 January 2020. Archived from the original on 31 January 2020. Retrieved 3 February 2020.
- ^ Jump up to: a b "Eastern Region Tropical Cyclone Outlook". Australian Bureau of Meteorology. 3 February 2020. Archived from the original on 3 February 2020. Retrieved 3 February 2020.
- ^ "North Eastern Area High Seas Forecast (06Z)". Australian Bureau of Meteorology. 4 February 2020. Archived from the original on 4 February 2020. Retrieved 4 February 2020.
- ^ "North Eastern Area High Seas Forecast (18Z)". Australian Bureau of Meteorology. 4 February 2020. Archived from the original on 5 February 2020. Retrieved 5 February 2020.
- ^ "North Eastern Area High Seas Forecast (06Z)". Australian Bureau of Meteorology. 5 February 2020. Archived from the original on 5 February 2020. Retrieved 5 February 2020.
- ^ Jump up to: a b c "Tropical Cyclone Uesi Technical Bulletin #3 (12Z)". Australian Bureau of Meteorology. 12 February 2020. Archived from the original on 12 February 2020. Retrieved 12 February 2020.
- ^ Jump up to: a b "Tropical Cyclone Uesi Technical Bulletin #5 (00Z)". Australian Bureau of Meteorology. 13 February 2020. Archived from the original on 13 February 2020. Retrieved 13 February 2020.
- ^ "South Eastern Area High Seas Forecast (06Z)". Australian Bureau of Meteorology. 13 February 2020. Archived from the original on 13 February 2020. Retrieved 13 February 2020.
- ^ "Tropical Cyclone Uesi Forecast Track Map #15 (15Z)". Australian Bureau of Meteorology. 13 February 2020. Archived from the original on 13 February 2020. Retrieved 13 February 2020.
- ^ "Australian Region MSLP Analysis Chart (12Z)". Australian Bureau of Meteorology. 13 February 2020. Archived from the original on 13 February 2020. Retrieved 13 February 2020.
- ^ "Tropical Cyclone Uesi BOM Forecast Track Map #4 (06Z)". Australian Bureau of Meteorology. 12 February 2020. Archived from the original on 12 February 2020. Retrieved 12 February 2020.
- ^ Hair, Jonathan; Kidd, Jessica; Thomas, Sarah (13 February 2020). "Cyclone Uesi set to hit Lord Howe Island, bringing 150kph gale-force winds and large swells". ABC News. Archived from the original on 13 February 2020. Retrieved 13 February 2020.
- ^ "Tropical Cyclone Uesi Forecast Track Map #16 (18Z)". Australian Bureau of Meteorology. 13 February 2020. Archived from the original on 13 February 2020. Retrieved 13 February 2020.
- ^ "Lord Howe Island (Windy Point) Daily Weather Observations". Australian Bureau of Meteorology. 15 February 2020. Archived from the original on 15 February 2020. Retrieved 15 February 2020.
- ^ "Lord Howe Island Airport Daily Weather Observations". Australian Bureau of Meteorology. 15 February 2020. Archived from the original on 15 February 2020. Retrieved 15 February 2020.
- ^ "Storms to hit Sydney over weekend as Lord Howe Island endures ex-cyclone Uesi". The Guardian. 14 February 2020. Retrieved 15 February 2020.
- ^ "Tropical Cyclone Uesi Forecast Track Map #20 (06Z)". Australian Bureau of Meteorology. 14 February 2020. Archived from the original on 14 February 2020. Retrieved 14 February 2020.
- ^ Ward, Mary; Bungard, Matt (13 February 2020). "'Quite calm': Lord Howe Island residents await Uesi's arrival". The Sydney Morning Herald. Nine Entertainment Co. Archived from the original on 13 February 2020. Retrieved 13 February 2020.
- ^ Dakin, Rebecca (13 February 2020). "HAZARDOUS SURF | All Gold Coast beaches closed today". myGC.com.au. Archived from the original on 13 February 2020. Retrieved 13 February 2020.
- ^ Jump up to: a b "Swimmer drowns at Bondi Beach". news.com.au. 15 February 2020. Archived from the original on 15 February 2020. Retrieved 15 February 2020.
- ^ "South Eastern Area High Seas Forecast (18Z)". Australian Bureau of Meteorology. 15 February 2020. Archived from the original on 16 February 2020. Retrieved 16 February 2020.
- ^ "Northern Region Tropical Cyclone Outlook". Australian Bureau of Meteorology. 21 February 2020. Archived from the original on 21 February 2020. Retrieved 21 February 2020.
- ^ "Cyclone Esther hits Australia, making landfall between Queensland, Northern Territory". 7News (Australia). 23 February 2020. Retrieved 26 February 2020.
- ^ "Tropical Cyclone Esther makes landfall in Gulf of Carpentaria". ABC News (Australia). 24 February 2020. Retrieved 26 February 2020.
- ^ "Feb. 26, 2020 – NASA Tracking Ex-Tropical Cyclone Esther's March". NASA Blogs. Retrieved 26 February 2020.
- ^ "Ex-cyclone Esther bringing heavy rains to the north and could loop towards the middle of Australia, says BOM". ABC News (Australia). Retrieved 27 February 2020.
- ^ "Ex-Tropical Cyclone Esther Brings Damaging Wind and Rain to Darwin, Australia". news.com.au.
- ^ "Western Region Tropical Cyclone Outlook (23Z)". Australian Bureau of Meteorology. 22 February 2020. Archived from the original on 23 February 2020. Retrieved 23 February 2020.
- ^ "Tropical Cyclone Ferdinand Forecast Track Map #1 (00Z)". Australian Bureau of Meteorology. 23 February 2020. Archived from the original on 23 February 2020. Retrieved 23 February 2020.
- ^ Jump up to: a b "Tropical Cyclone Ferdinand Technical Bulletin #4 (18Z)". Australian Bureau of Meteorology. 23 February 2020. Archived from the original on 23 February 2020. Retrieved 23 February 2020.
- ^ Jump up to: a b "Tropical Cyclone 20S (Ferdinand) Warning #1 (18Z)". Joint Typhoon Warning Center. Naval Meteorology and Oceanography Command. 23 February 2020. Archived from the original on 23 February 2020. Retrieved 23 February 2020.
- ^ "Tropical Cyclone Ferdinand Forecast Track Map #5 (00Z)". Australian Bureau of Meteorology. 24 February 2020. Archived from the original on 24 February 2020. Retrieved 24 February 2020.
- ^ "Tropical Cyclone Ferdinand Forecast Track Map #9 (00Z)". Australian Bureau of Meteorology. 25 February 2020. Archived from the original on 25 February 2020. Retrieved 25 February 2020.
- ^ "Tropical Cyclone Ferdinand Technical Bulletin #8 (18Z)". Australian Bureau of Meteorology. 24 February 2020. Archived from the original on 25 February 2020. Retrieved 25 February 2020.
- ^ "Tropical Cyclone Ferdinand Technical Bulletin #9 (00Z)". Australian Bureau of Meteorology. 25 February 2020. Archived from the original on 25 February 2020. Retrieved 25 February 2020.
- ^ "Tropical Cyclone 20S (Ferdinand) Forecast Track Map #6 (00Z)". Joint Typhoon Warning Center. Naval Meteorology and Oceanography Command. 25 February 2020. Archived from the original on 24 February 2020. Retrieved 25 February 2020. Alt URL
- ^ "Tropical Cyclone 20S (Ferdinand) Warning #7 (06Z)". Joint Typhoon Warning Center. Naval Meteorology and Oceanography Command. 25 February 2020. Archived from the original on 25 February 2020. Retrieved 25 February 2020.
- ^ Jump up to: a b "Tropical Cyclone Ferdinand Technical Bulletin #12 (18Z)". Australian Bureau of Meteorology. 25 February 2020. Archived from the original on 25 February 2020. Retrieved 25 February 2020.
- ^ "Tropical Cyclone Ferdinand Technical Bulletin #13 (00Z)". Australian Bureau of Meteorology. 26 February 2020. Archived from the original on 26 February 2020. Retrieved 26 February 2020.
- ^ Jump up to: a b "Tropical Cyclone 20S (Ferdinand) Warning #9 (18Z)". Joint Typhoon Warning Center. Naval Meteorology and Oceanography Command. 25 February 2020. Archived from the original on 25 February 2020. Retrieved 25 February 2020.
- ^ "Tropical Cyclone 20S (Ferdinand) Warning #11 (06Z)". Joint Typhoon Warning Center. Naval Meteorology and Oceanography Command. 26 February 2020. Archived from the original on 26 February 2020. Retrieved 26 February 2020.
- ^ "Tropical Cyclone Ferdinand Technical Bulletin #16 (18Z)". Australian Bureau of Meteorology. 26 February 2020. Archived from the original on 26 February 2020. Retrieved 26 February 2020.
- ^ "Tropical Cyclone 20S (Ferdinand) Warning #14 (00Z)". Joint Typhoon Warning Center. Naval Meteorology and Oceanography Command. 27 February 2020. Archived from the original on 27 February 2020. Retrieved 27 February 2020.
- ^ "Tropical Cyclone Ferdinand Technical Bulletin #18 (06Z)". Australian Bureau of Meteorology. 27 February 2020. Archived from the original on 27 February 2020. Retrieved 27 February 2020.
- ^ "Tropical Cyclone Ferdinand Forecast Track Map #20 (18Z)". Australian Bureau of Meteorology. 27 February 2020. Archived from the original on 28 February 2020. Retrieved 28 February 2020.
- ^ "Tropical Cyclone 20S (Ferdinand) Warning #15 (06Z)". Joint Typhoon Warning Center. Naval Meteorology and Oceanography Command. 27 February 2020. Archived from the original on 27 February 2020. Retrieved 27 February 2020.
- ^ "Tropical Cyclone 20S (Ferdinand) Forecast Track Map #16 (12Z)". Joint Typhoon Warning Center. Naval Meteorology and Oceanography Command. 27 February 2020. Archived from the original on 27 February 2020. Retrieved 27 February 2020. Alt URL
- ^ "Tropical Cyclone 20S (Ferdinand) Warning #17 (18Z)". Joint Typhoon Warning Center. Naval Meteorology and Oceanography Command. 27 February 2020. Archived from the original on 28 February 2020. Retrieved 28 February 2020.
- ^ "Tropical Cyclone Ferdinand Technical Bulletin #21 (00Z)". Australian Bureau of Meteorology. 28 February 2020. Archived from the original on 28 February 2020. Retrieved 28 February 2020.
- ^ "South East Asia MSLP Analysis Chart (00Z)". Australian Bureau of Meteorology. 6 March 2020. Archived from the original on 6 March 2020. Retrieved 9 March 2020.
- ^ "Weekly Tropical Climate Note". Australian Bureau of Meteorology. 3 March 2020. Archived from the original on 9 March 2020. Retrieved 9 March 2020.
- ^ Jump up to: a b "Severe Weather Update: Monsoon trough and tropical low, 8 March 2020". YouTube (Video). Bureau of Meteorology. 8 March 2020. Retrieved 9 March 2020.
- ^ Jump up to: a b "Western Region Tropical Cyclone Outlook". Australian Bureau of Meteorology. 9 March 2020. Archived from the original on 9 March 2020. Retrieved 9 March 2020.
- ^ "South East Asia Gradient Level Wind Analysis (00Z)". Australian Bureau of Meteorology. 9 March 2020. Archived from the original on 9 March 2020. Retrieved 9 March 2020.
- ^ "Western Area High Seas Forecast (18Z)". Australian Bureau of Meteorology. 10 March 2020. Archived from the original on 11 March 2020. Retrieved 11 March 2020.
- ^ "Tropical Cyclone Formation Alert (16Z)". Joint Typhoon Warning Center. Naval Meteorology and Oceanography Command. 10 March 2020. Archived from the original on 11 March 2020. Retrieved 11 March 2020.
- ^ "Tropical Cyclone 21S Warning #1 (06Z)". Joint Typhoon Warning Center. Naval Meteorology and Oceanography Command. 11 March 2020. Archived from the original on 11 March 2020. Retrieved 11 March 2020.
- ^ "Tropical Cyclone 21S Warning #3 (18Z)". Joint Typhoon Warning Center. Naval Meteorology and Oceanography Command. 11 March 2020. Archived from the original on 11 March 2020. Retrieved 11 March 2020.
- ^ "Western Area High Seas Forecast (18Z)". Australian Bureau of Meteorology. 11 March 2020. Archived from the original on 11 March 2020. Retrieved 11 March 2020.
- ^ "Tropical Cyclone 21S Operational Track File". United States Naval Research Laboratory. 12 March 2020. Retrieved 12 March 2020.
- ^ "Severe Weather Warning for Damaging Winds and Heavy Rainfall (15Z)". Australian Bureau of Meteorology. 12 March 2020. Archived from the original on 12 March 2020. Retrieved 12 March 2020.
- ^ "Severe Weather Warning for Damaging Winds and Heavy Rainfall (21Z)". Australian Bureau of Meteorology. 12 March 2020. Archived from the original on 13 March 2020. Retrieved 13 March 2020.
- ^ "Gascoyne District Forecast (21Z)". Australian Bureau of Meteorology. 13 March 2020. Archived from the original on 14 March 2020. Retrieved 14 March 2020.
- ^ "Lower West District Forecast (21Z)". Australian Bureau of Meteorology. 14 March 2020. Archived from the original on 15 March 2020. Retrieved 15 March 2020.
- ^ "Australian Region MSLP Analysis Chart (18Z)". Australian Bureau of Meteorology. 14 March 2020. Archived from the original on 14 March 2020. Retrieved 15 March 2020.
- ^ "Rowley Shoals Weather Observations". Australian Bureau of Meteorology. 11 March 2020. Archived from the original on 11 March 2020. Retrieved 11 March 2020.
- ^ "Barrow Island Airport Weather Observations". Australian Bureau of Meteorology. 12 March 2020. Archived from the original on 12 March 2020. Retrieved 12 March 2020.
- ^ "Thevenard Island Weather Observations". Australian Bureau of Meteorology. 13 March 2020. Archived from the original on 13 March 2020. Retrieved 13 March 2020.
- ^ "Onslow Airport Weather Observations". Australian Bureau of Meteorology. 13 March 2020. Archived from the original on 13 March 2020. Retrieved 13 March 2020.
- ^ "Australian Region MSLP Analysis Chart (12Z)". Australian Bureau of Meteorology. 9 March 2020. Archived from the original on 9 March 2020. Retrieved 10 March 2020.
- ^ Jump up to: a b "Northern Region Tropical Cyclone Outlook". Australian Bureau of Meteorology. 10 March 2020. Archived from the original on 10 March 2020. Retrieved 10 March 2020.
- ^ "Tropical Cyclone Gretel Forecast Track Map #1 (06Z)". Australian Bureau of Meteorology. 11 March 2020. Archived from the original on 11 March 2020. Retrieved 11 March 2020.
- ^ Jump up to: a b "Tropical Cyclone Gretel Forecast Track Map #2 (12Z)". Australian Bureau of Meteorology. 11 March 2020. Archived from the original on 11 March 2020. Retrieved 11 March 2020.
- ^ Jump up to: a b c "Tropical Cyclone Gretel Technical Bulletin #1 (00Z)". Australian Bureau of Meteorology. 13 March 2020. Archived from the original on 13 March 2020. Retrieved 13 March 2020.
- ^ "Tropical Cyclone Gretel Forecast Track Map #15 (15Z)". Australian Bureau of Meteorology. 14 March 2020. Archived from the original on 14 March 2020. Retrieved 14 March 2020.
- ^ "Tropical Cyclone Gretel Technical Bulletin #8 (18Z)". Australian Bureau of Meteorology. 14 March 2020. Archived from the original on 14 March 2020. Retrieved 14 March 2020.
- ^ "Tropical Cyclone Gretel Forecast Track Map #17 (00Z)". Australian Bureau of Meteorology. 15 March 2020. Archived from the original on 15 March 2020. Retrieved 15 March 2020.
- ^ Jump up to: a b "Hamilton Island Airport Weather Observations". Australian Bureau of Meteorology. 13 March 2020. Archived from the original on 13 March 2020. Retrieved 13 March 2020.
- ^ "Weekly Tropical Climate Note". Australian Bureau of Meteorology. 24 March 2020. Archived from the original on 24 March 2020. Retrieved 29 March 2020.
- ^ "Eastern Region Tropical Cyclone Outlook". Australian Bureau of Meteorology. 29 March 2020. Archived from the original on 29 March 2020. Retrieved 29 March 2020.
- ^ "Eastern Region Tropical Cyclone Outlook". Australian Bureau of Meteorology. 2 April 2020. Archived from the original on 2 April 2020. Retrieved 2 April 2020.
- ^ "Significant Tropical Weather Advisory for the Pacific Ocean (06Z)". Joint Typhoon Warning Center. Naval Meteorology and Oceanography Command. 2 April 2020. Archived from the original on 2 April 2020. Retrieved 2 April 2020.
- ^ "Tropical Cyclone Best Track Database". Australian Bureau of Meteorology. 22 September 2020. Retrieved 22 September 2020.
- ^ "Tropical Cyclone Harold Forecast Track Map #1 (03Z)". Australian Bureau of Meteorology. 2 April 2020. Archived from the original on 2 April 2020. Retrieved 2 April 2020.
- ^ "Significant Tropical Weather Advisory for the Pacific Ocean". Joint Typhoon Warning Center. Naval Meteorology and Oceanography Command. 1 April 2020. Archived from the original on 2 April 2020. Retrieved 2 April 2020.
- ^ "Tropical Cyclone Harold Technical Bulletin #1 (06Z)". Australian Bureau of Meteorology. 2 April 2020. Archived from the original on 2 April 2020. Retrieved 2 April 2020.
- ^ "Tropical Cyclone Harold Forecast Track Map #2 (06Z)". Australian Bureau of Meteorology. 2 April 2020. Archived from the original on 2 April 2020. Retrieved 2 April 2020.
- ^ "Tropical Cyclone Harold Technical Bulletin #4 (00Z)". Australian Bureau of Meteorology. 3 April 2020. Archived from the original on 5 July 2013. Retrieved 3 April 2020.
- ^ "Tropical Cyclone Harold Forecast Track Map #4 (00Z)". Australian Bureau of Meteorology. 3 April 2020. Archived from the original on 3 April 2020. Retrieved 3 April 2020.
- ^ "Tropical Cyclone Activity Bulletin for the South-West Indian Ocean" (PDF). Météo-France La Réunion (in French). 10 April 2020. Retrieved 11 April 2020.
- ^ "Western Region Tropical Cyclone Outlook". Australian Bureau of Meteorology. 10 April 2020. Archived from the original on 10 April 2020. Retrieved 10 April 2020.
- ^ "South East Asia MSLP Analysis Chart (00Z)". Australian Bureau of Meteorology. 10 April 2020. Archived from the original on 10 April 2020. Retrieved 10 April 2020.
- ^ "Western Region Tropical Cyclone Outlook". Australian Bureau of Meteorology. 13 April 2020. Archived from the original on 13 April 2020. Retrieved 13 April 2020.
- ^ Jump up to: a b "Significant Tropical Weather Advisory for the Indian Ocean (11Z)". Joint Typhoon Warning Center. Naval Meteorology and Oceanography Command. 12 April 2020. Archived from the original on 12 April 2020. Retrieved 12 April 2020.
- ^ "Tropical Cyclone Activity Bulletin for the South-West Indian Ocean" (PDF). Météo-France La Réunion (in French). 12 April 2020. Retrieved 12 April 2020.
- ^ "Western Area High Seas Forecast (18Z)". Australian Bureau of Meteorology. 13 April 2020. Archived from the original on 14 April 2020. Retrieved 14 April 2020.
- ^ Jump up to: a b "Tropical Depression 12 Analysis Bulletin #1 (06Z)" (PDF). Météo-France La Réunion. 14 April 2020. Retrieved 14 April 2020.
- ^ "Western Region Tropical Cyclone Outlook". Australian Bureau of Meteorology. 14 April 2020. Archived from the original on 14 April 2020. Retrieved 14 April 2020.
- ^ "Tropical Cyclone Jeruto Analysis Bulletin #3 (06Z)" (PDF). Météo-France La Réunion. 15 April 2020. Retrieved 15 April 2020.
- ^ "Cocos Islands Airport Daily Rainfall Data". Australian Bureau of Meteorology. 14 April 2020. Archived from the original on 14 April 2020. Retrieved 14 April 2020.
- ^ "Cocos Islands Airport Weather Observations". Australian Bureau of Meteorology. 14 April 2020. Archived from the original on 14 April 2020. Retrieved 14 April 2020.
- ^ "Weekly Tropical Climate Note". Australian Bureau of Meteorology. 28 April 2020. Archived from the original on 28 April 2020. Retrieved 3 May 2020.
- ^ "South-East Asia MSLP Analysis Chart (00Z)". Australian Bureau of Meteorology. 1 May 2020. Archived from the original on 1 May 2020. Retrieved 3 May 2020.
- ^ "Western Region Tropical Cyclone Outlook". Australian Bureau of Meteorology. 3 May 2020. Archived from the original on 3 May 2020. Retrieved 3 May 2020.
- ^ Jump up to: a b c "Tropical Depression 96S Forecast Track Map (06Z)". Indonesian Agency for Meteorology, Climatology and Geophysics. 5 May 2020. Archived from the original on 5 May 2020. Retrieved 5 May 2020.
- ^ Jump up to: a b "Tropical Cyclone Formation Alert (0230Z)". Joint Typhoon Warning Center. Naval Meteorology and Oceanography Command. 5 May 2020. Archived from the original on 5 May 2020. Retrieved 5 May 2020.
- ^ "Tropical Cyclone 96S Formation Alert Cancellation (00Z)". Joint Typhoon Warning Center. Naval Meteorology and Oceanography Command. 6 May 2020. Archived from the original on 6 May 2020. Retrieved 6 May 2020.
- ^ "Western Region Tropical Cyclone Outlook". Australian Bureau of Meteorology. 9 May 2020. Archived from the original on 9 May 2020. Retrieved 9 May 2020.
- ^ "Western Region Tropical Cyclone Outlook". Australian Bureau of Meteorology. 10 May 2020. Archived from the original on 10 May 2020. Retrieved 10 May 2020.
- ^ "Tropical Depression 96S Information Bulletin (06Z)". Indonesian Agency for Meteorology, Climatology and Geophysics (in Indonesian). 5 May 2020. Archived from the original on 5 May 2020. Retrieved 5 May 2020.
- ^ "Weekly Tropical Climate Note". Australian Bureau of Meteorology. 19 May 2020. Archived from the original on 19 May 2020. Retrieved 20 May 2020.
- ^ "South-East Asia MSLP Analysis Chart (00Z)". Australian Bureau of Meteorology. 19 May 2020. Archived from the original on 19 May 2020. Retrieved 20 May 2020.
- ^ Jump up to: a b "Western Region Tropical Cyclone Outlook". Australian Bureau of Meteorology. 19 May 2020. Archived from the original on 19 May 2020. Retrieved 19 May 2020.
- ^ "Tropical Cyclone Activity Bulletin for the South-West Indian Ocean" (PDF). Météo-France La Réunion (in French). 19 May 2020. Retrieved 20 May 2020.
- ^ "Significant Tropical Weather Advisory for the Indian Ocean (18Z)". Joint Typhoon Warning Center. Naval Meteorology and Oceanography Command. 19 May 2020. Archived from the original on 20 May 2020. Retrieved 20 May 2020.
- ^ Jump up to: a b "Tropical Cyclone 27S (Mangga) Formation Alert (03Z)". Joint Typhoon Warning Center. Naval Meteorology and Oceanography Command. 20 May 2020. Archived from the original on 20 May 2020. Retrieved 20 May 2020.
- ^ Jump up to: a b "Tropical Cyclone 27S (Mangga) Warning #1A (Corrected) (03Z)". Joint Typhoon Warning Center. Naval Meteorology and Oceanography Command. 21 May 2020. Archived from the original on 21 May 2020. Retrieved 21 May 2020.
- ^ "Tropical Cyclone Mangga Technical Bulletin #3 (18Z)". Australian Bureau of Meteorology. 21 May 2020. Archived from the original on 21 May 2020. Retrieved 21 May 2020.
- ^ "Tropical Cyclone Mangga Track and Impact Map #3 (12Z)". Indonesian Agency for Meteorology, Climatology and Geophysics. 21 May 2020. Archived from the original on 21 May 2020. Retrieved 21 May 2020.
- ^ "Tropical Low 17U Technical Bulletin (00Z)". Indonesian Agency for Meteorology, Climatology and Geophysics (in Indonesian). 21 May 2020. Archived from the original on 21 May 2020. Retrieved 21 May 2020.
- ^ Jump up to: a b "Tropical Low 17U Track and Impact Map (00Z)". Indonesian Agency for Meteorology, Climatology and Geophysics. 21 May 2020. Archived from the original on 21 May 2020. Retrieved 21 May 2020.
- ^ "WA super storm clean-up continues as hundreds still without power". PerthNow. Retrieved 27 May 2020.
- ^ Kaur, Herlyn. "Storm hits Perth as ex-Tropical Cyclone Mangga delivers wild weather across WA, power cut to thousands". ABC. Retrieved 27 May 2020.
- ^ "Western Region Tropical Cyclone Outlook". Australian Bureau of Meteorology. 31 January 2020. Archived from the original on 31 January 2020. Retrieved 31 January 2020.
- ^ "Western Region Tropical Cyclone Outlook". Australian Bureau of Meteorology. 3 February 2020. Archived from the original on 4 February 2020. Retrieved 4 February 2020.
- ^ "Western Region Tropical Cyclone Outlook". Australian Bureau of Meteorology. 4 February 2020. Archived from the original on 5 February 2020. Retrieved 5 February 2020.
- ^ "Cocos Islands Airport Recent Weather Observations". Australian Bureau of Meteorology. 4 February 2020. Archived from the original on 4 February 2020. Retrieved 4 February 2020.
- ^ "Christmas Island Aerodrome Daily Rainfall Data". Australian Bureau of Meteorology. 3 February 2020. Archived from the original on 4 February 2020. Retrieved 4 February 2020.
- ^ "Western Area High Seas Forecast (18Z)". Australian Bureau of Meteorology. 6 February 2020. Archived from the original on 6 February 2020. Retrieved 6 February 2020.
- ^ "Western Area High Seas Forecast (06Z)". Australian Bureau of Meteorology. 8 February 2020. Archived from the original on 8 February 2020. Retrieved 8 February 2020.
- ^ "Western Area High Seas Forecast (18Z)". Australian Bureau of Meteorology. 8 February 2020. Archived from the original on 9 February 2020. Retrieved 9 February 2020.
- ^ Jump up to: a b "Cocos Islands Airport Daily Rainfall Data". Australian Bureau of Meteorology. 14 February 2020. Archived from the original on 14 February 2020. Retrieved 14 February 2020.
- ^ "Cocos Islands Airport Daily Weather Observations". Australian Bureau of Meteorology. 14 February 2020. Archived from the original on 14 February 2020. Retrieved 14 February 2020.
- ^ "Western Area High Seas Forecast (06Z)". Australian Bureau of Meteorology. 13 February 2020. Archived from the original on 13 February 2020. Retrieved 13 February 2020.
- ^ Jump up to: a b "Cyclonic Activity and Tropical Meteorology Bulletin for the South-West Indian Ocean (12Z)" (PDF). Météo-France La Réunion (in French). 13 February 2020. Retrieved 13 February 2020.
- ^ "Western Area High Seas Forecast (18Z)". Australian Bureau of Meteorology. 13 February 2020. Archived from the original on 14 February 2020. Retrieved 14 February 2020.
- ^ "Weekly Tropical Climate Note". Australian Bureau of Meteorology. 11 February 2020. Archived from the original on 11 February 2020. Retrieved 15 February 2020.
- ^ Jump up to: a b "Eastern Region Tropical Cyclone Outlook". Australian Bureau of Meteorology. 15 February 2020. Archived from the original on 15 February 2020. Retrieved 15 February 2020.
- ^ "Australian Region MSLP Analysis Chart (06Z)". Australian Bureau of Meteorology. 15 February 2020. Archived from the original on 15 February 2020. Retrieved 15 February 2020.
- ^ "Eastern Region Tropical Cyclone Outlook". Australian Bureau of Meteorology. 17 February 2020. Archived from the original on 17 February 2020. Retrieved 17 February 2020.
- ^ "Western Region Tropical Cyclone Outlook". Australian Bureau of Meteorology. 6 April 2020. Archived from the original on 6 April 2020. Retrieved 6 April 2020.
- ^ "Western Area High Seas Forecast (06Z)". Australian Bureau of Meteorology. 6 April 2020. Archived from the original on 6 April 2020. Retrieved 6 April 2020.
- ^ "Tropical Cyclone 24S (Irondro) Warning #9 (06Z)". Joint Typhoon Warning Center. Naval Meteorology and Oceanography Command. 6 April 2020. Retrieved 6 April 2020.
- ^ "Western Area High Seas Forecast (18Z)". Australian Bureau of Meteorology. 6 April 2020. Archived from the original on 7 April 2020. Retrieved 7 April 2020.
- ^ "Tropical Cyclone Operational plan for the South Pacific & Southeast Indian Ocean, 2014 Edition" (PDF). WMO. Retrieved 12 June 2016.
- ^ "Cyclone Names". Indonesian Agency for Meteorology, Climatology and Geophysics. Archived from the original on 17 June 2019. Retrieved 17 June 2019.
- ^ Gary Padgett (2008). "Monthly Global Tropical Cyclone Summary October". Australian Severe Weather. Retrieved 1 July 2013.
- ^ Jump up to: a b RA V Tropical Cyclone Committee (8 October 2020). Tropical Cyclone Operational Plan for the South-East Indian Ocean and the Southern Pacific Ocean 2020 (PDF) (Report). World Meteorological Organization. pp. I-4–II-9 (9–21). Retrieved 10 October 2020.
- ^ Standen, Susan. "Karratha faces a $6m clean-up bill after Tropical Cyclone Damien". ABC News. Retrieved 2 September 2020.
- ^ 2 Preparations and impact
External links[]
| Wikimedia Commons has media related to 2019-20 Australian region cyclone season. |
- Australian Bureau of Meteorology
- Joint Typhoon Warning Center
- Tropical Cyclone Warning Center Jakarta (in Indonesian)
- Tropical Cyclone Warning Center Port Moresby
| show Tropical cyclones of the 2019–20 Australian region cyclone season |
|---|
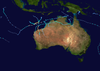
- 2019–20 Australian region cyclone season
- Australian region cyclone seasons
- Tropical cyclones in 2019
- Tropical cyclones in 2020