Tropical cyclones in 2020
hideThis article has multiple issues. Please help or discuss these issues on the talk page. (Learn how and when to remove these template messages)
|
| Tropical cyclones in 2020 | |||
|---|---|---|---|
 Year summary map | |||
| Year boundaries | |||
| First system | Blake | ||
| Formed | January 4, 2020 | ||
| Last system | Danilo | ||
| Dissipated | January 12, 2021 | ||
| Strongest system | |||
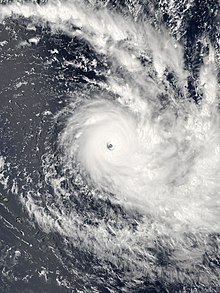
| Name | Yasa | ||
| Lowest pressure | 899 mbar/hPa; 26.55 inHg | ||
| Longest lasting system | |||
| Name | Paulette | ||
| Duration | 21 days | ||
| Year statistics | |||
| Total systems | 141 | ||
| Named systems | 104 | ||
| Total fatalities | 1,338 total | ||
| Total damage | > $73.396 billion (2020 USD) | ||
| |||
During 2020, tropical cyclones formed within seven different tropical cyclone basins, located within various parts of the Atlantic, Pacific and Indian Oceans. During the year, 141 tropical cyclones formed in bodies of water known as tropical cyclone basins. Of these, 104, including three subtropical cyclones in the South Atlantic Ocean and three tropical-like cyclones in the Mediterranean, were named by various weather agencies when they attained maximum sustained winds of 35 knots (65 km/h; 40 mph) (though one storm was a crossover storm that received two names). The strongest storm of the year was Yasa, peaking with a pressure of 899 hPa (26.55 inHg) and with 10-minute sustained winds of 250 km/h (155 mph). The deadliest storm of the year was Eta which caused 175 fatalities and another 100+ to be missing in Central America and the US, while the costliest storm of the year was Laura, with a damage cost around $19.1 billion in the Greater Antilles, The Bahamas, and the Gulf Coast of the United States.
2020 had a slightly above average amount of tropical cyclones forming in the year. The most active basin of the year was the North Atlantic documenting a record 30 named storms, the most named storms ever recorded in a season. This was only one of three known years where the North Atlantic was more active than the West Pacific, the others being 2005 and 2010. The West Pacific in fact had a below average season with only 23 named storms forming. The Eastern Pacific similarly was below average with 17 named storms forming and merely 4 hurricanes. The inactivity can be blamed on a La Niña pattern which formed during the summer of the year. In the North Indian Ocean was a relatively average season which featured 5 named storms but became the costliest season in recorded history due to the onslaught of Cyclone Amphan in early May. The Southern Hemisphere had relatively average activity throughout much of the year– with the exception of the Australian region which remained below average because of positive IOD[1]– the other South-West Indian Ocean and South Pacific basins featured above-average seasons.

Global atmospheric and hydrological conditions[]

As 2020 began, sea surface temperatures were above normal in the eastern Pacific Ocean near the equator, which had the potential to develop into El Niño conditions. On January 9, a group of climate scientists writing for ENSO Blog published their forecast for atmospheric conditions. They believed that there was a 60% chance that the environment would remain in neutral conditions related to the El Niño–Southern Oscillation (ENSO); this was based on the expectation that the above normal water temperatures would return to normal.[2] By March, there was little evidence of increased rainfall near the equator. Trade winds were enhanced in the central and tropical Pacific Ocean, and water temperatures remained above normal. On April 9, ENSO Blog reaffirmed their belief that environmental conditions would remain neutral.[3] However, the sea surface temperatures near the equatorial pacific began to cool well below average, indicating a developing La Niña. As a result, the ENSO Blog issued La Niña watch, stating a 50-55% chance of a strong La Niña.[4] In September, NOAA confirmed that the environment shifted to a La Niña pattern, based on lower than normal water temperatures in the eastern Pacific Ocean near the equator. The ENSO Blog estimated a 75% chance that La Niña conditions would persist through the end of the year, in part due to a strengthening Walker circulation.[5]
Meanwhile, in the Atlantic, sea surface temperatures were near normal in the early parts of the year. However, they began to warm up significantly that Spring, with the Caribbean, Gulf of Mexico and the Main Development Region all having well above-average sea surface temperatures. This was mainly due to the developing La Niña.
The COVID-19 pandemic disrupted the response to tropical cyclones during the year. In the South Pacific island nation of Vanuatu, COVID-19, travel and social distancing restrictions associated with the pandemic were lifted for those seeking safe houses and evacuation shelters during Cyclone Harold.[6][7] When Typhoon Vongfong struck the Philippines in May, evacuation shelters were filled to half-capacity to comply with social distancing guidelines, requiring more evacuation centers to house refugees.[8][9][10] As a result of the use of schools as quarantine facilities for COVID-19, some schools could not be used as evacuation shelters.[11] When Cyclone Amphan was approaching India in May, shelter capacity in West Bengal was reduced from 500,000 people to 200,000 people due to social distancing restrictions.[12] Movement restrictions in El Salvador were temporarily lifted to allow people to purchase supplies ahead of Tropical Storm Amanda.[13]
Summary[]

North Atlantic Ocean[]

An average Atlantic hurricane season features 14 tropical storms, 7 hurricanes, and 3 major hurricanes, and features an Accumulated Cyclone Energy (ACE) count of 110. This is according to the new 30-year averages from 1991 to 2020. In 2020 in the North Atlantic basin, all of the statistics fell well above listed, featuring a record-breaking 30 tropical storms, 14 hurricanes, and 7 major hurricanes, with an ACE total of 182.
After fifteen years, the 2020 Atlantic hurricane season has surpassed record high activity in terms of named storms. The season produced thirty-one tropical cyclones, of which thirty developed into named storms; thirteen became hurricanes, and six attained major hurricane status. The season's first cyclone developed on May 16, and activity was unprecedented after Arthur formed, with an additional off-season storm forming having been named Tropical Storm Bertha. In July, five individual storms (most notably Hurricane Isaias, which spawned a damaging tornado outbreak in the United States) formed and tied the record with 2005 as the most active July on record. The month of August also included Hurricanes Laura and Marco, which both impacted the United States and the former becoming the costliest of the year. Afterwards, a record-breaking ten storms developed in the month of September. Afterwards, October featured little relief with 3 hurricanes and 4 named storms forming all and all. The catastrophic season ended on November 18, after Hurricane Iota dissipated. Iota was also the most intense hurricane of the season with a minimum central pressure of 917 mbar. Iota was also the strongest storm in terms of wind speed, peaking with a strength of 160 mph or as a Category 5 hurricane on the Saffir–Simpson scale. Many records were broken throughout the season, including the extreme rate of tropical cyclone formations, the second time on record that the Greek naming system for named storms was used, and the strength of the storms which formed in the months of October and November.[14]
The season was very destructive, causing an estimated $51.146 billion (2020 USD) in damage and more than four hundred fatalities. Most destruction was due to Laura, which caused about $19.1 billion (2020 USD) in damage and killed seventy people in Louisiana. Hurricane Eta in early November also caused $7 billion (2020 USD) in damage and was the deadliest storm of the season, causing over two hundred deaths as it crossed the vast majority of Central America and eventually made three more landfalls: one in Cuba, and two in Florida.
Eastern & Central Pacific Oceans[]

An average Pacific hurricane season features 15 tropical storms, 9 hurricanes, and 4 major hurricanes, and features an Accumulated Cyclone Energy (ACE) count of 132. In 2020 in the Eastern and Central Pacific basins, most of the statistics fell below the above list. The exception was the number of tropical storms, featuring 17, which was slightly above average for the basin.
The season as a whole, however, was below average. Featuring only seventeen tropical storms (sixteen received names), four hurricanes, and three major hurricanes, the 2020 Pacific hurricane season was the least active season in exactly a decade. Despite the inactivity, an unusual tropical depression formed on April 25 – the record earliest start to an Eastern Pacific hurricane season since reliable records began in 1966. The strongest storm in the basin this year was Hurricane Marie, which reached low-end Category 4 strength on the Saffir–Simpson scale and it did not impact land. Elsewhere, Tropical Storm Amanda was the costliest storm of the season after its El Salvador landfall. Hurricane Douglas caused minor damage to the Hawaiian Islands as it passed north as a Category 1, and Hurricane Genevieve nearly became the strongest landfalling system of the season, but failed to do so as it passed southwest of the Baja California Peninsula. The season concluded on November 19 with the dissipation of Tropical Storm Polo, which briefly existed for around 2 days prior.
Each individual storm generated very low ACE counts throughout the season, ending at a total of just 73 units. These statistics are typical of a La Niña that has been persisting since the beginning of the year. In addition, no storms formed in the Central Pacific Ocean this year – the first such occurrence since 2017.
Western Pacific Ocean[]

The average typhoon season lasts year-round, with the majority of the storms forming between May and October. An average Pacific typhoon season features 26 tropical storms, 16 typhoons, and 9 super typhoons (unofficial category). It also features an average Accumulated Cyclone Energy (ACE) count of approximately 294; the basin is typically the most active basin for tropical cyclone formation. For only the third time ever and the first in a decade, the 2020 Atlantic hurricane season surpassed the 2020 Pacific typhoon season in named storms, which had below-average statistics, especially in the count of super typhoons. This was only the third time ever that the typhoon season wasn't the most active season; two times (2005 and 2010) it was the Atlantic hurricane season, and the fourth (and only time the most active season wasn't in the Northern Hemisphere) being the 1973 Australian cyclone season. The season was slightly below average with most of the tropical cyclones affecting the Korean Peninsula and the Philippines. Overall, there were 31 tropical depressions declared officially or unofficially, of which 22 became named storms; of those, there were 10 typhoons, which is the equivalent of a minimal hurricane, while 2 of the 10 typhoons intensified into super typhoons unofficially by the JTWC. The season began very late with the first storm, Vongfong, developing on May 10, southeast of the Philippines. Exactly one month later, Tropical Storm Nuri formed, marking one of the slowest starts on record. In July, almost no storms formed, marking the quietest July in over 130 years. In August, Typhoon Hagupit became the second typhoon of the season, striking China.[nb 1] Typhoons Bavi, Maysak, and Haishen were a series of three major typhoons to strike the Korean Peninsula in just a two-week span in August and September. In October, Typhoon Chan-hom was the longest-lived storm of the season, Typhoon Saudel was another contributing storm to the Vietnam flood event, Tropical Storm Linfa became the deadliest storm of the season and year, and Typhoon Molave caused catastrophic damage to the Philippines. Typhoon Goni in October–November was the strongest and most intense storm of the season and year. The final typhoon of the season was Typhoon Vamco, which was another serious Philippine typhoon. The last depression dissipated in early December. During most of the year, sea surface temperatures were moderately below normal near the equator, and were highest around 160° E from August to October. Partially as a result, most of the storms make landfall in Philippines. No named storms entered the basin from the Central Pacific, east of the International Date Line. Overall, there were 22 named storms in the basin in 2020, which was slightly below the norm of 27. A total of 10 of the 22 storms became typhoons, a moderately lower than normal proportion.
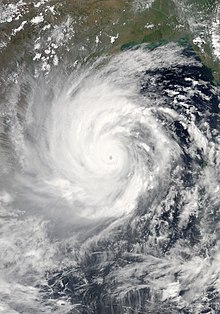
North Indian Ocean[]

The season was slightly above average, with nine tropical cyclones, five cyclonic storms, four severe cyclonic storms, three very severe cyclonic storms, and one super cyclonic storm. The first storm, in the Bay of Bengal, formed on May 16 from a low-pressure area. It went on to strengthen into a super cyclonic storm, being designated Super Cyclonic Storm Amphan, and make landfall in India three days later, becoming the costliest storm ever recorded in the basin. Amphan simultaneously dissipated. In June, Severe Cyclonic Storm Nisarga became the first storm in the new thirteen-list naming system. After Nisarga dissipated, there was no activity between June 4 and October 11 – one of the longest gaps in inactivity on record. Then, on October 11, after the inactivity gap came to a close, Deep Depression BOB 02 formed. It made landfall in Andhra Pradesh and caused extensive damage. Two more depressions formed in October, and none were named – one of only a few occurrences on record. Gati formed on November 21, causing one of the longest naming gaps in history. Gati later became a Category 3 tropical cyclone on the Saffir–Simpson scale, and made landfall in the Horn of Africa near Ras Hafun which became later the strongest cyclone to attack Somalia since reliable records began in 1891. Two more storms formed in the Bay of Bengal – Nivar and Burevi, both impacting south India. Nivar was in late November and affected South India at Tamil Nadu. Burevi formed on November 30, scraped Sri Lanka, and dissipated just off the coast of India.
South-West Indian Ocean[]
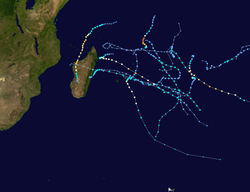

January–June[]
The 2019–20 season was slightly above average, with eight tropical depressions, seven tropical storms, and three intense tropical cyclones in 2020.
As the season was reaching January, it already has seen four tropical cyclones throughout the second half of 2019. No tropical cyclones developed until January 19, which was very late in the calendar year. Diane and Esami later formed, with Diane being the costliest and deadliest storm. In February, Moderate Tropical Storm Francisco formed, and was deemed very weak. After, Intense Tropical Cyclone Gabekile formed, becoming the first of three intense cyclones of 2020. It was also the most intense tropical cyclone in the 2020 part of the 2019–20 South-West Indian Ocean cyclone season. With the month of March being the least active of the year, Intense Tropical Cyclone Herold formed, becoming the first major tropical cyclone, which is Category 3 or higher on the Saffir–Simpson scale. Irondro later followed on April 1, and concluded with the dissipation of Jeruto on April 16.
July–December[]
On November, 12 Alicia formed on the extreme northeast section of the basin. This marked the third season in a row with a pre-season tropical cyclone. Alicia strengthened into a tropical cyclone on November 15, rapidly weakened due to the vertical wind shear and cool waters, and dissipated on November 17. On November 14, another tropical disturbance formed off the coast of Madagascar; however, on November 16 the system failed to organise due to unfavourable vertical wind shear according to JTWC. It rapidly weakened and dissipated the next day. The basin remained quiet until, on November, 30 a tropical low crossed over from the Australian region. It strengthened into a moderate tropical storm, then to a severe tropical storm, and was named Bongoyo. Two additional low formed, one formed but exited the basin on December 20 and another Zone of Disturbed Weather formed near Diego Garcia, which strengthened to Severe Tropical Storm Chalane, which made landfall on Madagascar and Mozambique, the first tropical cyclone for this season to make landfall. The same Zone of Disturbed Weather which exited on December 20, again re-entered on December 28, following with another Zone of Disturbed Weather, designated 06. On January 1, 06 intensified into Tropical Storm Danilo and continued into 2021 for 12 more days.
Australian Region[]
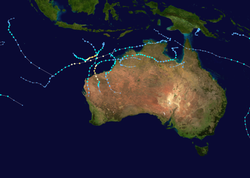

January–June[]
The 2019–20 Australian region cyclone season was a below average tropical cyclone season for the waters surrounding Australia between longitudes 90°E and 160°E. It became the least active season since the 2016–17 season with only three systems intensified further into severe tropical cyclones, and three systems made landfall within the region at tropical cyclone intensity. The season had an unusually late start with the first system, Blake, forming in early January, well after the official start of the season. Blake would later make landfall in northwestern Australia and soon degenerate afterwards. At the same time, Claudia, another tropical cyclone, formed. It persisted for two weeks and reached category 3 on the Australian tropical cyclone scale before dissipating west of Australia. Later that month, a tropical low formed and lasted for a week before dissipating in late January without been named. Three other tropical lows formed in late January and early February. One of them dissipated later. Another one of them has been moving in and out of the Australian region. It was designated 06F by the Fiji Meteorological Service. The third one intensified into Cyclone Damien. In late February, 2 new tropical lows formed, and were named Esther and Ferdinand. Esther didn't strengthen much, but Ferdinand went on to become a Category 3 severe tropical cyclone, equivalent to a Category 2 Atlantic Hurricane. Then two cyclones named Gretel and Harold formed in Coral Sea on March and April respectively. They both exited the basin and intensified further into the South Pacific basin. The season concluded with the two lows formed in the area under TCWC Jakarta, which the latter one was named as Mangga which became one of the powerful extratropical cyclone to hit Australia such late in the season.
July–December[]
On November 24, Tropical Low 01U formed off the coast of Sumatra which started the 2020–21 season. It exited the basin on November 30 and entered the South West Indian Ocean where it intensified into a severe tropical storm and it was named Bongoyo. After that, on December 6 another low formed off the coast of Java, which also intensified into a tropical storm status according to JTWC. It hit Christmas Island and dissipated quickly after making landfall in Pilbara region of Western Australia. Along with the system another low formed off the coast of Kimberley region. Both system caused strong winds and heavy downpour. Another low named 03U formed and quickly dissipated after making landfall in Northern Territory, Australia. Another low originated near Sumatra entered the basin on December 20, which then exited on December 28.
South Pacific Ocean[]


January–June[]
The 2019–20 season was slightly above average with eight tropical cyclones and four severe tropical cyclones forming during the season. The other half, 2020 began with the arrival of Tropical Depression 01F on November 22, near the Solomon Islands, which would later become Tropical Cyclone Rita. Rita would then peak as a Category 3 on the Australian scale. Tropical Disturbance 02F was designated sometime later, but didn't last long after that. Sarai formed on December 23, lasting into the new year before finally ceasing to exist on January 2. Not too long after that, Tino formed and affected eastern Fiji and the surrounding area before dissipating. On January 24, a depression formed and dissipated the next day without been named. In early February, another low originally in the Australian region crossed the 160th meridian east and emerged in the South Pacific. It strengthened into severe tropical cyclone Uesi and affected New Caledonia and New Zealand. In mid-February four disturbances formed, 07F, 08F, 09F and 10F. 07F & 08F dissipated before becoming tropical depressions but the other 2 strengthened into tropical cyclones Vicky and Wasi. In mid March, Gretel entered the basin. It dissipated shortly afterwards. In early April, Harold also entered the basin from the Australian region. It rapidly intensified into a Category 5 Severe tropical cyclone as it impacted Vanuatu.The season ended on April 10.
July–December[]
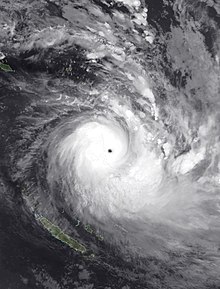
During December 8, the FMS reported that Tropical Disturbance 01F had developed, while it was located about 145 km (90 mi) to the northeast of Apia in Samoa.[15] Over the next few days, the system moved westwards towards Vanuatu and developed into a tropical depression, before it started to interact with Tropical Disturbance 02F that had developed near Vanuatu. On December 13, 15:00 UTC, 02F intensified into a Category 1 tropical cyclone Yasa according to Australian scale. Yasa continued intensifying, reaching Category 5 intensity on the Australian scale. The following day, 03F intensified into Category 1 tropical cyclone Zazu, strengthening to Category 2. Yasa eventually became the most powerful tropical cyclone of 2020 beating Goni with a minimum barometric pressure of 899 mb (26.55 inHg) and maximum wind speed of 250 km/h (155 mph). It was also the fourth most intense South Pacific tropical cyclone after Winston, Zoe, Pam, while Zazu dissipated into an extratropical cyclone. Yasa caused catastrophic damage and four deaths in Fiji.[16] It became extratropical on December 20.
South Atlantic Ocean[]
The South Atlantic Ocean had a record breaking three named systems in 2020; Subtropical Storm Kurumí in late January, Subtropical Storm Mani in late October, and Subtropical Storm Oquira in late December. Kurumí caused devastating floods and mudslides in Southeast region of Brazil, while Mani caused heavy rainfall in the Espírito Santo state. Oquira caused little damage to any landmasses.[citation needed]
Mediterranean Sea[]
In the Mediterranean Sea, a powerful system unofficially named Ianos by Greece formed and affected Sicily and Greece, with winds peaking at 120 kilometres per hour (75 mph) and a minimum pressure of 995 mb (29.38 inHg). Its remnants then affected Malta and Libya.[citation needed]
Systems[]
January[]

The month of January was borderline-average in terms of named storms and systems formed, but below average in terms of intensity in the Southern Hemisphere, however, no tropical cyclones developed within the Northern Hemisphere. A total of ten storms developed, with six of these systems were named and had gale-force winds, while two of these named storms developed hurricane-force winds and were classified as severe tropical cyclones. As the month began, both Calvinia and Sarai were weakening and gradually dissipated over the next few days. Blake subsequently became the first named storm of the year and made two landfalls in the Kimberley region, bringing heavy rainfall throughout the region. Adding on, Tino brought considerable damage throughout the South Pacific in the middle portion of the month, and a rare South Atlantic tropical cyclone formed, named Kurumí, becoming the first of its kind to be named in January later on in the month.
| Storm name | Dates active | Max wind km/h (mph) |
Pressure (hPa) |
Areas affected | Damage (USD) |
Deaths | Refs |
|---|---|---|---|---|---|---|---|
| Blake | January 4–11 | 75 (45) | 986 | Western Australia | Minor | None | |
| Claudia | January 4–17 | 150 (90) | 963 | Eastern Indonesia, Top End, Kimberley | None | None | |
| Tino | January 11–20 | 120 (75) | 970 | Solomon Islands, Vanuatu, Fiji, Wallis and Futuna, Samoan Islands, Tuvalu, Tonga | $5.83 million | 2 | [17] |
| 05 | January 19–23 | 55 (35) | 999 | None | None | None | |
| Diane | January 22–26 | 75 (45) | 990 | Madagascar, Mauritius, Réunion | Unknown | 31 | [18] |
| Kurumí | January 23–25 | 65 (40) | 998 | São Paulo, Minas Gerais, Espírito Santo, Rio de Janeiro | Unknown | 70 | [19] |
| Esami | January 23–26 | 85 (50) | 990 | Rodrigues | None | None | |
| 04U | January 23–30 | Unspecified | 998 | Northern Territory, Queensland | None | None | |
| 05F | January 24–26 | Unspecified | 1003 | Samoan Islands | None | None | |
| TL | January 31 – February 4 | Unspecified | 1007 | Christmas Island, Cocos Islands | None | None |
February[]

The month of February was fairly above average, seeing thirteen tropical cyclones develop, with eight being named. Damien became the first and strongest storm of the month, impacting the Pilbara region of Western Australia as a Category 2 tropical cyclone on the Saffir–Simpson scale. Uesi also impacted the east coast of Australia and New Caledonia, killing one person. Later in the month, activity increased in the South Pacific with Vicky and Wasi forming, bringing heavy rain to the Samoan Islands. Consequently, activity also increased in the Australian basin with Esther and Ferdinand forming, with Ferdinand staying north of the Australian coastline its entire lifetime.
| Storm name | Dates active | Max wind km/h (mph) |
Pressure (hPa) |
Areas affected | Damage (USD) |
Deaths | Refs |
|---|---|---|---|---|---|---|---|
| Damien | February 2 – 11 | 155 (100) | 955 | Northern Australia, Kimberley | $4.3 million | None | [20] |
| Uesi | February 3 – 15 | 120 (75) | 970 | Solomon Islands, Vanuatu, New Caledonia, Lord Howe Island, New Zealand, New South Wales, South East Queensland | Minor | 1 | [21] |
| Francisco | February 3 – 15 | 80 (50) | 994 | Madagascar | Minor | 1 | [22] |
| TL | February 6 – 8 | Unspecified | 1007 | Cocos Islands | None | None | |
| TL | February 13 | Unspecified | 1009 | None | None | None | |
| Gabekile | February 13 – 17 | 165 (105) | 950 | None | None | None | |
| 07F | February 14 – 21 | Unspecified | 998 | Tuvalu, American Samoa, Tokelau | None | None | |
| TL | February 15 – 17 | Unspecified | 1002 | Solomon Islands | None | None | |
| 08F | February 17 – 18 | 65 (40) | 994 | American Samoa, Niue | None | None | |
| Vicky | February 19–22 | 85 (50) | 988 | Samoan Islands, Niue | None | None | |
| Wasi | February 21 – 23 | 85 (50) | 990 | Wallis and Futuna, Samoan Islands | None | None | |
| Esther | February 21 – March 5 | 75 (45) | 988 | Far North Queensland, Northern Territory, Kimberley | None | None | |
| Ferdinand | February 22 – March 4 | 155 (100) | 960 | Lesser Sunda Islands | None | None |
March[]

March was highly below average. Actually, it was the least active month of 2020, with only four systems forming with two being named. Despite that, Gretel and Herold formed, with the latter becoming the first major tropical cyclone of 2020.
| Storm name | Dates active | Max wind km/h (mph) |
Pressure (hPa) |
Areas affected | Damage (USD) |
Deaths | Refs |
|---|---|---|---|---|---|---|---|
| 09U | March 9–14 | 75 (45) | 999 | Java, Bali, West Nusa Tenggara Western Australia | None | None | |
| Gretel | March 10–17 | 100 (65) | 980 | Top End, New Guinea, Queensland, New Caledonia, Norfolk Island, New Zealand | None | None | |
| Herold | March 12–20 | 175 (110) | 955 | Madagascar, Tromelin Island | Unknown | 5 | [23] |
| 11U | March 29 – April 2 | Unspecified | 1005 | New Guinea, Cape York Peninsula | None | None |
April[]
The month of April was average with five storms developing and three being named, though the month featured Harold which was responsible for devastating damage in Vanuatu and the first category 5-equivalent storm of 2020, as well as the first to be featured in the South Pacific since Gita in 2018. It also featured Tropical Depression One-E in the Eastern Pacific, becoming its earliest forming tropical cyclone in the basin proper, and the first storm in the Northern Hemisphere in 2020.
| Storm name | Dates active | Max wind km/h (mph) |
Pressure (hPa) |
Areas affected | Damage (USD) |
Deaths | Refs |
|---|---|---|---|---|---|---|---|
| Irondro | April 1 – 7 | 175 (110) | 950 | None | None | None | |
| Harold | April 1 – 11 | 230 (145) | 920 | Papua New Guinea, Solomon Islands, Vanuatu, Fiji, Tonga | >$123.5 million | ≥30 | [24][25] |
| TL | April 3 | Unspecified | 1008 | None | None | None | |
| Jeruto | April 10 – 16 | 65 (40) | 999 | None | None | None | |
| One-E | April 25 – 26 | 55 (35) | 1006 | None | None | None |
May[]
The month of May was well above average with eight tropical cyclones developing and six of those being named. Vongfong (Ambo) became the first storm of the Pacific typhoon season, marking the latest start to the basin since 2016 and dealing significant damage in the Philippines. Arthur also developed in the month, giving the North Atlantic season six consecutive seasons with pre-season activity. Amphan became the strongest of the month, and also became one of the strongest cyclones in the North Indian Ocean on record as well as the costliest storm in the basin on record. Later in the month, Mangga formed as an off-season tropical storm in the Australian region. Furthermore, Bertha formed in the Atlantic and marked the first time since 2016 that two pre-season storms have formed in the Atlantic, as well as the first time since 2012 that two tropical depressions or storms formed in the month of May. Cristobal formed on June 1 from the remnants of Amanda in and affected Mexico and the United States, becoming the earliest third named storm in the North Atlantic Ocean on record. However, Cristobal does not count for June, as it counts as one tropical cyclone, rather than two.
| Storm name | Dates active | Max wind km/h (mph) |
Pressure (hPa) |
Areas affected | Damage (USD) |
Deaths | Refs |
|---|---|---|---|---|---|---|---|
| TD | May 3–10 | 55 (35) | 1004 | Mentawai Islands, Sumatra | None | None | |
| Vongfong (Ambo) | May 10–18 | 155 (100) | 960 | Palau, Philippines, Taiwan, Ryukyu Islands | $50 million | 5 | [26] |
| Amphan | May 16–21 | 240 (150) | 920 | Sri Lanka, Bangladesh, India, Bhutan | >$13.6 billion | 128 | [27] |
| Arthur | May 16–19 | 95 (60) | 990 | Cuba, Florida, The Bahamas, North Carolina, Bermuda | $112.000 | None | [28] |
| Mangga | May 19 – 23 | 65 (40) | 995 | Cocos Islands, Mentawai Islands, Sumatra, Western Australia | None | None | |
| Bertha | May 27–28 | 85 (50) | 1004 | Florida, Bahamas, East Coast of the United States | $130,000 | 1 | [29] |
| ARB 01 | May 29–31 | 45 (30) | 1000 | Oman, Yemen | Minimal | 3 | [30] |
| Amanda & Cristobal | May 30–June 10 | 95 (60) | 992 | Guatemala, El Salvador, Honduras, Belize, Costa Rica, Mexico, Gulf Coast of the United States, Midwestern United States, Eastern Canada | $865 million | 55 | [31] |
June[]

June was below average with just five tropical cyclones forming and four of them being named. In the North Indian Ocean, Nisarga formed near southwest India and historically affected the cities of Alibag and Mumbai. Nuri formed on the eastern coast of the Philippines, becoming the second storm of the typhoon season in the West Pacific but quickly weakened before landfall. Near the end of the month, Dolly formed in the North Atlantic Ocean and became the third-earliest fourth named storm in the basin on record but dissipated before reaching any land.
| Storm name | Dates active | Max wind km/h (mph) |
Pressure (hPa) |
Areas affected | Damage (USD) |
Deaths | Refs |
|---|---|---|---|---|---|---|---|
| Nisarga | June 1–4 | 110 (70) | 984 | West India | $803 million | 6 | |
| Nuri (Butchoy) | June 10–15 | 75 (45) | 996 | Philippines, China | Minimal | 1 | |
| Dolly | June 22–24 | 75 (45) | 1002 | East Coast of the United States, Atlantic Canada | None | None | |
| Boris | June 24–28 | 65 (40) | 1005 | None | None | None | |
| Four-E | June 30 | 55 (35) | 1004 | None | None | None |
July[]

The month of July was average, with 14 tropical cyclones forming and 9 being named. Edouard which developed on July 4, officially became the earliest-forming fifth named storm in the North Atlantic on July 6, surpassing the July 11 record set by 2005's Emily. It was later joined by Fay on July 9, which became the earliest-forming sixth named storm in the basin and proceeding to make an unusual landfall in New Jersey, surpassing the previous July 21 record set by Franklin (2005). In the West Pacific, the third tropical depression of the formed on July 11 and at the end of the month featured Typhoon Hagupit, the second typhoon of the season, and Tropical Storm Sinlaku. Category 4 Hurricane Douglas then became one of the latest first hurricanes in the Eastern Pacific and would become the first major hurricane of the East Pacific hurricane season, which would also be the strongest storm of the month. Douglas made an unusually close pass to the Hawaiian Islands, as a Category 1 hurricane but caused little to no damage. Near the end of the month, Gonzalo, Hanna and Isaias marked the earliest seventh, eighth, and ninth-named storms on record in the Atlantic, beating the record set by Gert, Harvey and Irene all in 2005 respectively. Hurricane Hanna and Isaias together would become the first and second hurricanes of the Atlantic hurricane season, with Isaias in particular spawning a damaging tornado outbreak in the Eastern United States.
| Storm name | Dates active | Max wind km/h (mph) |
Pressure (hPa) |
Areas affected | Damage (USD) |
Deaths | Refs |
|---|---|---|---|---|---|---|---|
| Edouard | July 4–6 | 75 (45) | 1007 | Bermuda, Ireland, United Kingdom, The Netherlands, Denmark, Poland, Russia | Minimal | None | |
| Cristina | July 6–13 | 110 (70) | 993 | Socorro Island | None | None | |
| Fay | July 9–11 | 95 (60) | 998 | Mid-Atlantic United States, New England | $350 million | 6 | |
| Carina | July 11–15 | 55 (35) | 1004 | Philippines, Taiwan | Minimal | None | |
| Six-E | July 13–14 | 55 (35) | 1007 | None | None | None | |
| Seven-E | July 20–21 | 65 (40) | 1006 | None | None | None | |
| Douglas | July 20–29 | 215 (130) | 954 | Hawaii | Minimal | None | |
| Gonzalo | July 21–25 | 100 (65) | 997 | Windward Islands, Trinidad and Tobago, Venezuela, Leeward Islands | Minimal | None | |
| Hanna | July 23–27 | 150 (90) | 973 | Hispaniola, Cuba, Gulf Coast of the United States, Mexico | $1.2 billion | 9 | |
| TD | July 27–30 | Not specified | 1010 | None | None | None | |
| Isaias | July 30 – August 5 | 140 (85) | 987 | Windward Islands, Puerto Rico, Hispaniola, Lucayan Archipelago, East Coast of the United States, Eastern Canada | $4.8 billion | 18 | |
| Hagupit (Dindo) | July 31 – August 5 | 130 (80) | 975 | Ryukyu Islands, Taiwan, East China | $411 million | 17 | |
| Sinlaku | July 31 – August 3 | 65 (40) | 992 | South China, Vietnam | $12.9 million | 6 | |
| Ten | July 31 – August 2 | 55 (35) | 1007 | West Africa, Cabo Verde Islands | None | None |
August[]


August was average, seeing 18 tropical cyclones forming and 15 named storms. Storms Josephine, Kyle, Laura, and Marco became the earliest 10th, 11th, 12th, and 13th named storms on record in the Atlantic and forming on August 13, 14, 21, and 22, respectively. Hurricane Laura made its track through the Caribbean and eventually strengthened into a high-end Category 4 hurricane, making the strongest hurricane landfall tying with Hurricane Ida of 2021 ever recorded in the U.S state of Louisiana and causing over US$14 billion in damage. In the eastern Pacific, a tropical cyclone outbreak resulted in the formation of Elida, Fausto, Genevieve, Hernan, and Iselle. Although not directly making landfall, Hurricane Genevieve passed very close to Baja California Sur and caused minor damage. Activity in the Western Pacific increased significantly with the formation of Jangmi, Mekkhala, a tropical depression that didn't affect land, and Higos in the South China Sea. Following after Higos, a series of typhoons named Bavi, Maysak, and Haishen formed, all impacting South Korea and Haishen becoming the strongest of the month as a near-Category 5 equivalent typhoon.
| Storm name | Dates active | Max wind km/h (mph) |
Pressure (hPa) |
Areas affected | Damage (USD) |
Deaths | Refs |
|---|---|---|---|---|---|---|---|
| Jangmi (Enteng) | August 7–10 | 85 (50) | 996 | Philippines, Ryukyu Islands, Korean Peninsula | $1 million | None | |
| Elida | August 9–13 | 155 (100) | 975 | Mexico, Socorro Island | None | None | |
| Mekkhala (Ferdie) | August 9–11 | 95 (60) | 992 | Philippines, Taiwan, East China | $159 million | None | |
| Gener | August 9–13 | 55 (35) | 1012 | None | None | None | |
| Josephine | August 11–16 | 75 (45) | 1004 | Leeward Islands, Puerto Rico | None | None | |
| Ten-E | August 13–16 | 55 (35) | 1004 | None | None | None | |
| Kyle | August 14–16 | 85 (50) | 1000 | East Coast of the United States, United Kingdom, Ireland | None | None | |
| Fausto | August 16–17 | 65 (40) | 1004 | California | Minimal | 1 | |
| Genevieve | August 16–21 | 215 (130) | 950 | Southwestern Mexico, Socorro Island, Baja California Peninsula | $50 million | 6 | |
| Higos (Helen) | August 16–20 | 100 (65) | 992 | Philippines, South China, Hong Kong | $142 million | 7 | |
| Laura | August 20–29 | 240 (150) | 937 | Lesser Antilles, Greater Antilles, The Bahamas, Gulf Coast of the United States, Midwestern United States, Eastern United States | $19.1 billion | 77 | |
| Marco | August 20–25 | 120 (75) | 991 | Windward Islands, South America, Jamaica, British Cayman Islands, Belize | $10 million | 1 | |
| Bavi (Igme) | August 21–27 | 155 (100) | 950 | Philippines, Ryukyu Islands, Taiwan, North Korea | $11.7 million | 1 | |
| Hernan | August 26–28 | 75 (45) | 1001 | Mexico, Baja California Peninsula | Minimal | None | |
| Iselle | August 26–30 | 95 (60) | 997 | Clarion Island | None | None | |
| Maysak (Julian) | August 27 – September 3 | 175 (110) | 935 | Philippines, Ryukyu Islands, Korean Peninsula | $100 million | 32 | |
| Haishen (Kristine) | August 31 – September 9 | 185 (115) | 920 | Mariana Islands, China, Japan, Korea | $100 million | 4 | |
| Omar | August 31 – September 5 | 65 (40) | 1003 | Southeastern United States | None | None |
September[]


September featured slightly below average activity. However, it was the most active month of the year, with 19 tropical cyclones developing and of which 17 were named. Also not officially included is Medicane Ianos, which developed in the Mediterranean Sea and is included for record-keeping purposes only. The North Atlantic mainly contributed to most development in the month and continued its record breaking season with the development of Hurricanes Nana, Paulette, Sally, and Teddy, and (Sub)Tropical Storms Omar, Rene, Vicky, Wilfred, Alpha, and Beta. Hurricane Sally brought devastating impacts to parts of the Southeastern United States while Hurricane Paulette made landfall in Bermuda as a Category 1 hurricane. Subtropical Storm Alpha, the first Greek-named storm of the 2020 Atlantic hurricane season, made an extremely rare landfall in Portugal, as well as breaking several other records, such as being the easternmost forming tropical cyclone on record in the basin. Furthermore, three tropical storms Julio, Karina, Lowell, and one hurricane, Marie formed in the Eastern Pacific. Additionally, the Western Pacific typhoon season produced 5 storms, three of which became tropical storms: Noul, Dolphin, and Kujira.
| Storm name | Dates active | Max wind
km/h (mph) |
Pressure
(hPa) |
Areas affected | Damage
(USD) |
Deaths | Refs |
|---|---|---|---|---|---|---|---|
| Nana | September 1–4 | 120 (75) | 994 | Jamaica, Honduras, Belize, Guatemala | $20 million | None | |
| Julio | September 5–7 | 75 (45) | 1003 | None | None | None | |
| Paulette | September 7–23 | 165 (105) | 965 | Bermuda, Azores, Madeira | $50 million | 1 | |
| Rene | September 7–14 | 85 (50) | 1000 | Senegal, Cabo Verde Islands | Minimal | None | |
| 12W | September 10–12 | 55 (35) | 1006 | Bonin Islands | None | None | |
| Sally | September 11–17 | 175 (110) | 965 | The Bahamas, Cuba, U.S. Gulf Coast, Southeastern United States, Norway | $7.3 billion | 8 | |
| Teddy | September 12–23 | 220 (140) | 945 | Lesser Antilles, Bermuda, East Coast of the United States, Atlantic Canada | $35 million | 3 | |
| Karina | September 13–17 | 95 (60) | 996 | None | None | None | |
| Vicky | September 14–17 | 85 (50) | 1000 | Cape Verde | Minimal | 1 | |
| Ianos | September 14–20 | 120 (75) | 995 | Malta, Italy, Greece, Libya | $100 million | 5 | |
| Noul (Leon) | September 14–19 | 80 (50) | 994 | Philippines, Vietnam, Cambodia | $175 million | 18 | |
| Alpha | September 17–19 | 85 (50) | 996 | Iberian Peninsula | $2 million | 1 | |
| Wilfred | September 17–21 | 65 (40) | 1007 | None | None | None | |
| Beta | September 17–23 | 95 (60) | 994 | Mexico, Texas | $400 million | 1 | |
| Dolphin (Marce) | September 20–24 | 110 (70) | 975 | None | None | None | |
| Lowell | September 20–25 | 85 (50) | 1001 | None | None | None | |
| Kujira | September 26–30 | 110 (70) | 980 | None | None | None | |
| TD | September 27–29 | 55 (35) | 1000 | None | None | None | |
| Marie | September 29 – October 7 | 220 (140) | 945 | None | None | None |
October[]


October was above average, being tied for the second-most active month of the year, with thirteen of the cyclones being named. The month started off with the Atlantic's third Greek-named storm, Gamma, and continued with consistent record-breaking Atlantic activity including 4 additional hurricanes; Delta, Epsilon, Zeta and Eta. Delta and Zeta impacted the Yucátan Peninsula before making landfall in Louisiana. Eta rapidly intensified to a high-end Category 4 hurricane, becoming the second strongest of the season and the third strongest hurricane in November ever recorded. Once it made landfall in Central America, it caused more than 180 fatalities. The Eastern Pacific was very quiet, only featuring Norbert while the Western Pacific was active featuring numerous tropical systems which also led to severe floods in Vietnam, including Saudel, Molave, and Goni. In particular, Goni became tied with Meranti and Haiyan as the most intense typhoon recorded in the Eastern Hemisphere on record, and the most intense cyclone recorded to make landfall in history, with sustained one-minute winds of 315 kilometres per hour (196 mph) causing historical levels of damage in the Philippines. In the North Indian Ocean, BOB 02, ARB 03 and BOB 03 formed which caused the delay of the withdrawal of southwest monsoon season and flash flooding in Telangana and Maharashtra. Also during the month was a rare subtropical storm in the South Atlantic named Mani, although it drifted well away from land.
| Storm name | Dates active | Max wind km/h (mph) |
Pressure (hPa) |
Areas affected | Damage (USD) |
Deaths | Refs |
|---|---|---|---|---|---|---|---|
| Gamma | October 2–6 | 120 (75) | 978 | Central America, Cayman Islands, Yucatán Peninsula | $100 million | 7 | |
| Chan-hom | October 4–16 | 120 (75) | 970 | Japan | None | None | |
| Delta | October 5 – 11 | 230 (145) | 953 | Jamaica, Nicaragua, Cayman Islands, Yucatán Peninsula, Gulf Coast of the United States, Southeastern United States, Northeastern United States | $3 billion | 6 | |
| Norbert | October 5 – 15 | 85 (50) | 1001 | None | None | None | |
| Linfa | October 9–12 | 75 (45) | 996 | Philippines, Vietnam, Cambodia, Laos Thailand, Myanmar | $950 million | 137 | |
| BOB 02 | October 11–14 | 55 (35) | 999 | Andhra Pradesh, Puducherry, Telangana, Kerala, Karnataka, Maharashtra, Goa | $681 million | 98 | [32] |
| Nangka (Nika) | October 11–14 | 85 (50) | 990 | Philippines, South China, Vietnam, Laos, | $16.9 million | 4 | |
| Ofel | October 13–16 | 55 (35) | 1002 | Philippines, Vietnam | $27.9 million | 10 | |
| ARB 03 | October 17–19 | 45 (30) | 1000 | Maharashtra | Minimal | None | |
| Saudel (Pepito) | October 19–26 | 130 (80) | 965 | Philippines, South China | $15.2 million | None | |
| Epsilon | October 19–26 | 185 (115) | 951 | Bermuda | Minimal | None | |
| 20W | October 19–23 | 55 (35) | 1008 | Japan | None | None | |
| BOB 03 | October 22–24 | 45 (30) | 1000 | West Bengal, Bangladesh, Northeast India | Minimal | None | |
| Molave (Quinta) | October 23–28 | 155 (100) | 950 | Philippines, Spratly Islands, Vietnam, Laos, Cambodia, Thailand, Malaysia, Myanmar | $660 million | 71 | |
| Zeta | October 24–29 | 185 (115) | 970 | Cayman Islands, Jamaica, Central America, Yucatán Peninsula, Gulf Coast of the United States, Southeastern United States, Mid-Atlantic, New England, Ireland, United Kingdom | $3.6 billion | 8 | |
| Mani | October 25 – 28 | 65 (40) | 1004 | Brazil | None | None | |
| Goni (Rolly) | October 26 – November 6 | 220 (140) | 905 | Philippines, Vietnam, Cambodia Laos | $1.04 billion | 32 | |
| Atsani (Siony) | October 29 – November 7 | 95 (60) | 994 | Mariana Islands Philippines Taiwan, South China | $101 thousand | None | |
| Eta | October 31 – November 13 | 240 (150) | 922 | ABC Islands, Jamaica, San Andrés and Providencia, Central America, Mexico, Cayman Islands, Cuba, The Bahamas, Southeastern United States | $8.3 billion | 175 |
November[]

November was well above average with twelve tropical cyclones forming, of which eleven were named. In the Western Pacific, Etau and Vamco developed, Vamco later becoming a Category 4 typhoon and both further contributing to the devastating flooding in Vietnam and in the Philippines, dealing an outstanding $440.8 million billion USD worth of damage. In the Eastern Pacific two tropical storms, Odalys and Polo, formed but intensified little. In the North Atlantic the incredibly active season continued with Theta and Iota having developed and breaking the record for the most named storms in an Atlantic hurricane season, surpassing that of 2005. Iota eventually became one of the latest Category 4 hurricanes to be recorded in the North Atlantic basin, continuing a spree of damage in Central America following Eta. In the Southern Hemisphere, Alicia and Tropical Depression 02 formed marking the beginning of the 2020–21 South–West Indian Ocean cyclone season. In the North Indian Ocean the season resumed activity with Gati forming off the coast of Somalia in the Arabian Sea which explosively intensifying into a Category 3 equivalent tropical cyclone, becoming the strongest tropical cyclone to ever make landfall in Somalia. Shortly after Gati, Nivar formed off the coast of Tamil Nadu and also began to quickly intensifiy to a Category 1 equivalent tropical cyclone before striking Karaikal. Not before a week after, another tropical cyclone named Burevi made a rare landfall in Sri Lanka. In the Australian region, one low formed which started the 2020–21 Australian region cyclone season which crossed the South-West Indian Ocean basin and intensified into a cyclone which was later named Bongoyo.
| Storm name | Dates active | Max wind km/h (mph) |
Pressure (hPa) |
Areas affected | Damage (USD) |
Deaths | Refs |
|---|---|---|---|---|---|---|---|
| Odalys | November 3–6 | 85 (50) | 1000 | None | None | None | |
| Etau (Tonyo) | November 7–11 | 85 (50) | 992 | Philippines, Vietnam Cambodia | $34.8 million | 3 | |
| Vamco (Ulysses) | November 8–15 | 155 (100) | 950 | Philippines, Vietnam, Laos, Thailand | $440.8 million | 102 | |
| Theta | November 10–15 | 110 (70) | 989 | Canary Islands, Madeira | None | None | |
| Alicia | November 12–17 | 130 (80) | 975 | None | None | None | |
| Iota | November 13–18 | 250 (155) | 917 | ABC Islands, Venezuela, Colombia, San Andrés and Providencia, Central America, Mexico | $1.4 billion | 61 | |
| 02 | November 15–17 | 55 (35) | 999 | None | None | None | |
| Polo | November 17–19 | 75 (45) | 1004 | None | None | None | |
| Gati | November 21–24 | 140 (85) | 978 | Somalia, Yemen, Djibouti | $1 million | 9 | |
| Nivar | November 23–27 | 120 (75) | 980 | Andhra Pradesh, Tamil Nadu, Puducherry, Sri Lanka | $600 million | 14 | |
| Bongoyo | November 24 – December 11 | 100 (65) | 988 | Cocos Islands | None | None | |
| Burevi | November 30 – December 5 | 85 (50) | 996 | Sri Lanka, Tamil Nadu, Kerala | Unknown | 11 |
December[]
December was slightly above average featuring thirteen systems, however only six were named. At the beginning of the month, the active Tropical Low 01U later became Severe Tropical Storm Bongoyo although the precursor of the storm formed in November and is thus counted as part of that month. In the Australian region, two tropical lows formed in and both impacted the Pilbara region of Western Australia, one reaching near Category 1 tropical cyclone strength according to Australian scale. The South Pacific also included three cyclones, one of which was Cyclone Yasa which became the fourth most intense tropical cyclone in the South Pacific on record and the strongest since Cyclone Winston. It was also the earliest Category 5 South Pacific cyclone on record, as well as the second Category 5 severe tropical cyclone in the South Pacific after Harold this year. Yasa went on to significantly impact the country of Fiji after weakening somewhat from peak strength. Cyclone Zazu also formed alongside Yasa, but had minimal impact on land outside Niue. Another depression formed in the West Pacific in the middle of the month and eventually strengthened into Tropical Storm Krovanh over the South China Sea. Krovanh was responsible for at least US$2.28 million in damage and eight dead in the Philippines. Additionally, another system designated 03U formed near the Northern Territory and made landfall shortly afterwards, enhancing rainfall over the region. Near the end of the month, the record third South Atlantic tropical cyclone of the year formed and was given the name Oquira. The South-West Indian Ocean also featured one storm, Chalane, which brought minimal damage to Madagascar and impacted Mozambique. The month concluded with two other systems in the basin: Danilo and .
| Storm name | Dates active | Max wind km/h (mph) |
Pressure (hPa) |
Areas affected | Damage (USD) |
Deaths | Refs |
|---|---|---|---|---|---|---|---|
| TD | December 5–6 | Not specified | 1010 | None | None | None | |
| 02U | December 6–12 | 75 (45) | 991 | Sumatra, Java, Christmas Island | None | None | |
| TL | December 7–11 | 55 (35) | 997 | Western Australia, Northern Territory, South Australia | None | None | |
| 01F | December 8–12 | 55 (35) | 998 | Fiji, Rotuma | None | None | |
| Yasa | December 11–21 | 250 (155) | 899 | Rotuma, Vanuatu, Fiji | $246.7 million | 4 | [33] |
| Zazu | December 11–16 | 95 (60) | 980 | American Samoa, Niue, Tonga | Minimal | Unknown | |
| Krovanh (Vicky) | December 17–24 | 65 (40) | 1000 | Philippines, Malaysia, Thailand | $4.48 million | 9 | |
| 03U | December 18–23 | 55 (35) | 993 | Top End, Kimberley | None | None | |
| Chalane | December 19–30 | 110 (70) | 983 | Madagascar, Mozambique, Zimbabwe, Botswana | Unknown | 7 | [34] |
| 05 | December 20 – January 3, 2021 | 55 (35) | 998 | Cocos Islands | None | None | |
| Danilo | December 28 – January 12, 2021 | 100 (65) | 981 | Chagos Archipelago | None | None | |
| Oquira | December 28–31 | 65 (40) | 998 | Argentina, Brazil, Uruguay | None | None | |
| TD | December 29 | Not specified | 1004 | None | None | None |
Global effects[]
| Season name | Areas affected | Systems formed | Named storms | Damage (USD) | Deaths |
|---|---|---|---|---|---|
| 2020 Atlantic hurricane season | The Bahamas, Eastern United States, Southern United States, Eastern Canada, Bermuda, Antillean Islands, Hispaniola, Cuba, Mexico, Central America, Venezuela, Cabo Verde Islands, Senegal, The Gambia, Azores, Madeira, Portugal | 31 | 30 | >$51.146 billion | 431 |
| 2020 Pacific hurricane season | Central America, Baja California Peninsula, Southwestern Mexico, Yucatán Peninsula, Socorro Island, Hawaii, California, Arizona, Clarion Island | 21 | 17 | >$250 million | 47 |
| 2020 Pacific typhoon season 3 | Palau, Philippines, Taiwan, Japan, China, Vietnam, Thailand, Laos, North Korea, South Korea, Siberia, Myanmar, Cambodia | 32 | 23 | $4.06 billion | 457 |
| 2020 North Indian Ocean cyclone season | Goa, Maharashtra, Northeast India, South India, Odisha, West Bengal, Bangladesh, Bhutan, Djibouti, Oman, Somalia, Sri Lanka, Yemen | 8 | 5 | >$15.78 billion | 269 |
| 2019–20 South-West Indian Ocean cyclone season 2 | Madagascar, Mauritius, Rodrigues, Tromelin Island, Réunion | 8 | 7 | $25 million | 37 |
| 2020–21 South-West Indian Ocean cyclone season | Cocos Islands, Madagascar, Mozambique, Zimbabwe, Botswana | 5 | 4 | Unknown | 7 |
| 2019–20 Australian region cyclone season 2 | Western Australia, Eastern Indonesia, Top End, Kimberley | 16 | 8 | >$4.3 million | 28 |
| 2020–21 Australian region cyclone season | Cocos Island, Coral Sea Islands, Papua New Guinea, Sumatra, Java, Christmas Island, Western Australia, Western Australia, Northern Territory, South Australia | 3 | 0 | None | None |
| 2019–20 South Pacific cyclone season 2 | Solomon Islands, Vanuatu, Tuvalu, Fiji, Samoa, Tonga, Niue, Tokelau, American Samoa | 7 | 4 | $131.63 million | 7 |
| 2020–21 South Pacific cyclone season | American Samoa, Fiji, Niue, Rotuma, Tonga | 3 | 2 | Minimal | 4 |
| 2020 South Atlantic tropical cyclone season | São Paulo, Santa Catarina | 3 | 3 | None | 3 |
| 2020 Mediterranean tropical-like cyclone season | Cyprus, Greece, Italy, Lebanon, Libya, Malta, Tunisia | 2 | 1 | $200 million | 5 |
| Worldwide | (See above) | 142[a] | 105 | > $73.396 billion | 1358 |
- ^ The sum of the number of systems and fatalities in each basin will not equal the number shown as the total. This is because when systems move between basins, it creates a discrepancy in the actual number of systems and fatalities.
See also[]
- Tropical cyclones by year
- List of earthquakes in 2020
- Tornadoes of 2020
- 2020 wildfire season
Notes[]
2 Only systems that formed either on or after January 1, 2020 are counted in the seasonal totals.
3 Only systems that formed either before or on December 31, 2020 are counted in the seasonal totals.
4 The wind speeds for this tropical cyclone/basin are based on the IMD Scale which uses 3-minute sustained winds.
5 The wind speeds for this tropical cyclone/basin are based on the Saffir Simpson Scale which uses 1-minute sustained winds.
6The wind speeds for this tropical cyclone are based on Météo-France which uses wind gusts.
- ^ All damage totals are valued as of 2020 and in United States dollars, unless otherwise noted.
References[]
- ^ "Indian Ocean Dipole: What is it and why is it linked to floods and bushfires?". BBC News. 2019-12-07. Retrieved 2021-01-03.
- ^ Emily Becker (January 9, 2020). "January 2020 ENSO update: new year, new you". Retrieved April 15, 2020.
- ^ Michelle L'Heureux (April 9, 2020). "April 2020 ENSO Update: Alternative Communication". Retrieved April 15, 2020.
- ^ "July 2020 ENSO update: La Niña Watch! | NOAA Climate.gov". www.climate.gov. Retrieved 2020-07-23.
- ^ Becker, Emily (10 September 2021). "September 2020 ENSO update: La Niña is here!". Climate.gov. Retrieved 28 January 2021.
- ^ Tahana, Jamie (April 5, 2020). "'Bad timing': Cyclone Harold likely to hit Vanuatu as category 5". RNZ. Radio New Zealand. Retrieved April 4, 2020.
- ^ Kottasová, Ivana; Miller, Brandon (April 6, 2020). "Giant storm hits Vanuatu amid coronavirus state of emergency". CNN. Cable News Network. Retrieved April 6, 2020.
- ^ "Sorsogon imposes distancing measure in evac centers amid threat of Typhoon Ambo". ABS-CBN News. ABS-CBN Corporation. May 14, 2020. Retrieved May 14, 2020.
- ^ "NDRRMC urges LGUs to prepare for 'Bagyong Ambo'". PTV News. People's Television Network, Inc. May 13, 2020. Retrieved May 13, 2020.
- ^ Brackett, Ron (18 May 2020). "India, Bangladesh Tell Millions to Evacuate as Tropical Cyclone Amphan Approaches". The Weather Channel. TWC Product and Technology. Retrieved 20 May 2020.
- ^ "Hurricane Amanda kills 14 people in El Salvador". Seven News. June 1, 2020. Retrieved June 1, 2020.
- ^ "2020 Atlantic Hurricane Season". www.nhc.noaa.gov. Retrieved 2021-01-25.
- ^ Tropical Disturbance Summary December 8, 2020 09z (Report). Fiji Meteorological Service. December 8, 2020. Archived from the original on December 13, 2020. Retrieved December 13, 2020.
- ^ "Fiji: Cyclone Yasa death toll rises to four with one missing". The New Indian Express. Retrieved 2021-01-25.
- ^ "Cyclone Tino: 2 missing as cyclone gains strength over Fiji". Stuff. January 17, 2020. Retrieved January 17, 2020.
- ^ Madagascar Heavy rains and floods Flash Update No. 1 (As of 26 January 2020). ReliefWeb (Report). United Nations Office for the Coordination of Humanitarian Affairs. 26 January 2020. Retrieved 26 January 2020.
- ^ "Dozens dead in Brazil flooding and landslides". BBC News. 26 January 2020. Retrieved 29 January 2020.
- ^ Standen, Susan. "Karratha faces a $6m clean-up bill after Tropical Cyclone Damien". ABC News. Retrieved 2 September 2020.
- ^ "Swimmer drowns at Bondi Beach". news.com.au. 15 February 2020. Archived from the original on 15 February 2020. Retrieved 15 February 2020.
- ^ "Francisco : un mort et plus d'un millier de sinistrés à Madagascar". IPReunion.com. Imaz Press Réunion. 17 February 2020. Retrieved 17 February 2020.
- ^ 17 March 2020. "Herold drenches Madagascar". Retrieved 24 March 2020.
- ^ "Tropical Cyclone Harold Scraping Parts of Tonga After Hammering Fiji and Vanuatu". The Weather Channel. Retrieved March 10, 2021.
- ^ "Reports of Injuries, Damaged Buildings from Cyclone Harold in Fiji". The Weather Channel. Retrieved March 10, 2021.
- ^ "5 dead, P80 million lost in Typhoon 'Ambo' wake". Manila Standard. May 18, 2020.
- ^ "Super Cyclonic Storm Amphan over the southeast Bay of Bengal" (PDF). rsmcnewdelhi.imd.gov.in.
- ^ "[Florida Event Reports for May 14–18, 2020]". National Centers for Environmental Information. 2020. Archived from the original on September 13, 2020. Retrieved August 22, 2020.
- ^ Summer Dashe (May 27, 2020). "Drowning Reported in Myrtle Beach Wednesday After Tropical Storm Bertha Hit Coast". Archived from the original on 2020-06-06. Retrieved 2020-05-30.
- ^ Nasrallah, Tawfiq (May 30, 2020). "Three people die due to heavy rains in Oman". Gulf News. Dubai, United Arab Emirates: Gulfnews.com. Retrieved May 31, 2020.
- ^ Robbie Berg (September 10, 2020). Tropical Cyclone Report: Tropical Storm Amanda (PDF) (Report). Miami, Florida: National Hurricane Center. Retrieved November 2, 2020.
- ^ Scroll Staff. "At least 50 die due to rain, floods in Telangana; 27 in Maharashtra". Scroll.in. Retrieved 2020-11-14.
- ^ "Fiji reports 4 deaths due to tropical cyclone Yasa". in.news.yahoo.com. Retrieved 2020-12-19.
- ^ "Death toll from storm Chalane in Mozambique rises to 7 | Nation". nation.africa. Retrieved 2021-01-04.
External links[]
| Tropical cyclone year articles (2020–present) |
|---|
| 2020, 2021, Post-2021 |
Regional Specialized Meteorological Centers
- US National Hurricane Center – North Atlantic, Eastern Pacific
- Central Pacific Hurricane Center – Central Pacific
- Japan Meteorological Agency – West Pacific
- India Meteorological Department – Bay of Bengal and the Arabian Sea
- Météo-France – La Reunion – South Indian Ocean from 30°E to 90°E
- Fiji Meteorological Service – South Pacific, west of 160°E, north of 25° S
Tropical Cyclone Warning Centers
- Meteorology, Climatology, and Geophysical Agency of Indonesia – South Indian Ocean from 90°E to 141°E, generally north of 10°S
- Australian Bureau of Meteorology – South Indian Ocean & South Pacific Ocean from 90°E to 160°E, generally south of 10°S
- Papua New Guinea National Weather Service – South Pacific Ocean from 141°E to 160°E, generally north of 10°S
- New Zealand MetService – South Pacific west of 160°E, south of 25°S
- United States Joint Typhoon Warning Centre – Monitors the East Pacific, Central Pacific, West Pacific, South Pacific, North Indian Ocean and South Indian Ocean
- Tropical cyclones in 2020
- Tropical cyclones by year
- 2020 Atlantic hurricane season
- 2020 Pacific hurricane season
- 2020 Pacific typhoon season
- 2020 North Indian Ocean cyclone season
- 2019–20 Australian region cyclone season
- 2020–21 Australian region cyclone season
- 2019–20 South Pacific cyclone season
- 2020–21 South Pacific cyclone season
- 2019–20 South-West Indian Ocean cyclone season
- 2020–21 South-West Indian Ocean cyclone season
- 2020-related lists