2010 Pacific hurricane season
| 2010 Pacific hurricane season | |
|---|---|
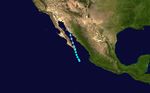
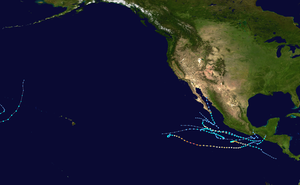 Season summary map | |
| Seasonal boundaries | |
| First system formed | May 29, 2010 |
| Last system dissipated | December 21, 2010 |
| Strongest storm | |
| Name | Celia |
| • Maximum winds | 160 mph (260 km/h) (1-minute sustained) |
| • Lowest pressure | 921 mbar (hPa; 27.2 inHg) |
| Seasonal statistics | |
| Total depressions | 13 |
| Total storms | 8 (record low, tied with 1977) |
| Hurricanes | 3 (record low) |
| Major hurricanes (Cat. 3+) | 2 |
| Total fatalities | 268 total |
| Total damage | $1.62 billion (2010 USD) |
| Related articles | |
The 2010 Pacific hurricane season was the least active Pacific hurricane season on record, tied with 1977. The season saw only eight named storms, alongside a record-breaking low of three hurricanes. However, of those three, two of them became major hurricanes, and one hurricane, Celia, reached Category 5 intensity on the Saffir-Simpson scale. The season officially began on May 15 in the East Pacific Ocean, and on June 1 in the Central Pacific; they ended on November 30. These dates conventionally delimit the period of each year when most tropical cyclones form in the Pacific basin. However, the formation of tropical cyclones is possible at any time of the year.
Unlike the previous season, the first storm of the season, Agatha, formed during the month of May. Agatha developed on May 29 near the coast of Guatemala. In the second week of June, a sudden spree of tropical cyclones developed, and between June 16 and 22, four cyclones formed, including the two major hurricanes of the season, Celia and Darby, the first of which reached Category 5 intensity. However, following the record active June, July saw zero named storms. In August and September only 2 tropical storms and one hurricane formed. Tropical Depression Eleven-E caused a great deal of flooding in southern Mexico, causing millions of dollars in damage, as well as causing over 50 deaths and $500 million in damage in areas of Oaxaca and Guatemala. Tropical Storm Omeka was a rare off-season storm.
Seasonal forecasts[]
| Source | Date | Named storms |
Hurricanes | Major hurricanes |
Ref |
| Average (1981–2010) | 15.4 | 8.4 | 3.9 | [1] | |
| Record high activity | 27 | 16 (tie) | 11 | [2] | |
| Record low activity | 8 (tie) | 3 | 0 (tie) | [3] | |
| ––––––––––––––––––––––––––––––––––––––––––––––––––––––– | |||||
| NOAA | May 27, 2010 | 9–15 | 4–8 | 1–3 | [4] |
| ––––––––––––––––––––––––––––––––––––––––––––––––––––––– | |||||
| Actual activity |
8 | 3 | 2 | ||
On May 19, 2010, the National Oceanic and Atmospheric Administration (NOAA) released their forecast for the 2010 Central Pacific hurricane season, which would start on June 1. They expected two or three cyclones to form in or enter the region throughout the season, below the average of four or five storms. The below-average activity forecast was based on two factors: the first was the continuance of a period of decreased activity in the central Pacific; and second, the effects of a Neutral El Niño–Southern Oscillation (ENSO) or La Niña, both of which reduce cyclone activity in the region. However, in light of the near-miss of Hurricane Felicia the previous year, forecasters at the Central Pacific Hurricane Center gave the public a basic message for the 2010 season, "Prepare! Watch! Act!".[5]
On May 27, 12 days after the official start of the 2010 eastern Pacific hurricane season, NOAA released their forecast for the basin. Similar to the forecast for the central Pacific, below-average activity was expected, with nine to fifteen named storms forming, four to eight of which would become hurricanes and a further one to three would become major hurricanes. This lessened activity was based on the same two factors as the central Pacific, decreased activity since 1995 and the ENSO event. Overall, NOAA stated there was a 75% chance of below-average activity, 20% of near-normal and only a 5% chance of above-average due to a strong La Niña.[6]
Seasonal summary[]

The accumulated cyclone energy (ACE) index for the 2010 Pacific hurricane season was 49.9625 units in the Eastern Pacific and 2.0825 units in the Central Pacific. The total ACE in the basin is 52.045 units.[nb 1] This ranked as the third-quietest since 1966, just above 1977 and 2007. The vast majority of the ACE stemmed from Hurricanes Celia and Darby, which collectively accounted for roughly 70 percent of the seasonal total.[7]
| Month | Actual activity vs. Averages[nb 3] | ACE[nb 4] | |||
|---|---|---|---|---|---|
| Storms | Hurricanes | Major | Month | Year | |
| May[8] | 1 (0–1) | 0 (0) | 0 (0) | – | – |
| June[9] | 3 (2) | 2 (1) | 2 (0–1) | >300% | >300% |
| July[10] | 0 (3–4) | 0 (2) | 0 (1) | 0% | 107% |
| August[11] | 2 (4) | 1 (2) | 0 (1) | 40% | 75% |
| September[12] | 1 (3) | 0 (2) | 0 (1) | <5% | 46% |
| October[13] | 0 (2) | 0 (1) | 0 (0-1) | 0% | 48% |
| November[14] | 0 (0-1) | 0 (0) | 0 (0) | 0% | ~46% |
| Total[7] | 7 (15) | 3 (9) | 2 (4) | – | ~46% |
Continuing a trend of below-average activity that began in 1995, the 2010 season was quiet as expected. The Eastern Pacific proper saw record-low numbers of named storms and hurricanes, with only seven and three respectively forming.[7] Inclusive of the Central Pacific, the basin tied its record low activity of eight named storms set in 1977.[3][15]
Inactivity was largely attributed to a moderately strong La Niña event which resulted in below-average sea surface temperatures across the basin. Another major factor limiting storm formation was the eastward displacement of 200 mb divergence. The displacement of this feature brought conditions that favor tropical development closer to the rugged terrain of Mexico and Central America, a factor known to disrupt low-level circulations. Accordingly, six of the seven named storms in the Eastern Pacific proper formed east of 106°W, four of which originated over the Gulf of Tehuantepec where the greatest depth of warm waters were restricted to. A final limiting factor was above-average wind shear across much of the basin east of 130°W and north of 10°N.[7]
The season began with record-high activity, featuring two major hurricanes in June. ACE values exceeded 300 percent of the long-term mean, though most was due to Category 5 Hurricane Celia.[9] Hurricane Celia was also the second-earliest forming storm of that intensity during the course of a season, surpassed only by Hurricane Ava in 1973.[3] The month featured an ACE value of 37.22, eclipsing the previous record set in 1984.[9] Furthermore, Darby was the earliest second major hurricane of a season, eclipsing Hurricane Daniel (1978);[16] however, this has since been surpassed by Cristina in 2014, Blanca in 2015, and Bud in 2018.[17][18] This activity abruptly halted and languished throughout the month of July.[7] No named storms developed during the month, marking the first such occurrence since 1966. However, due to the activity in June, ACE value for the season by the start of August remained slightly above normal, roughly 107 percent the yearly mean.[10] Through the remainder of the season, the basin observed record low activity with only three additional named storms developing.[13]
| Rank | Seasons | ACE value |
|---|---|---|
| 1 | 1977 | 22 |
| 2 | 2007 | 52 |
| 2010 | ||
| 4 | 1996 | 53 |
| 5 | 2003 | 56 |
| 6 | 1979 | 57 |
| 7 | 2004 | 71 |
| 8 | 1981 | 72 |
| 9 | 2020 | 73 |
| 10 | 2013 | 76 |
The record inactivity experienced in the Northeastern Pacific also took place in the Northwestern Pacific. Since reliable records began in the 1970s, there has been no precedent for both basins experiencing exceptionally low tropical cyclone formation. Moreover, this general lack of storm formation was reflected in all cyclone basins except the Atlantic. On average, the Northeastern Pacific accounts for 16 percent of the world's storms; however, during 2010, it accounted for roughly 10 percent (7 out of 67 cyclones).[19]
Systems[]
Tropical Storm Agatha[]
| Tropical storm (SSHWS) | |
  | |
| Duration | May 29 – May 30 |
|---|---|
| Peak intensity | 45 mph (75 km/h) (1-min) 1001 mbar (hPa) |
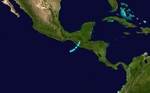
Early May 29, the season's first tropical depression consolidated near the Gulf of Tehuantepec. Large-scale southwesterly flow prompted the system to move slowly northeast. Scatterometer data indicated the depression soon strengthened into a tropical storm, at which time it was assigned the name Agatha. Attaining peak winds of 45 mph (70 km/h), Agatha soon made landfall late on May 29 near Champerico, Guatemala, just south of the border with Mexico. Once onshore, the mountainous terrain of Guatemala caused the storm to quickly dissipate early on May 30.[20]
Although a weak tropical cyclone, Agatha brought torrential rainfall to much of Central America.[21] Daily accumulations peaked at 16.78 in (426 mm) in Montufar, Guatemala and 19.0 in (483 mm) in Ilopango, El Salvador.[20][22] According to Guatemala's president, Álvaro Colom, some areas received more than 3.3 ft (1 m) of rain.[23] The ensuing flash floods and landslides proved catastrophic, especially in Guatemala where at least 174 people died.[24] In El Salvador, 11 people were killed and damage from the storm reached $112.1 million.[22] Honduras also suffered significant losses from the storm with 18 fatalities and at least $18.5 million in damage.[25] One person was also killed in Nicaragua.[26] The storm also associated with a very large sinkhole.
Tropical Depression Two-E[]
| Tropical depression (SSHWS) | |
  | |
| Duration | June 16 – June 17 |
|---|---|
| Peak intensity | 35 mph (55 km/h) (1-min) 1007 mbar (hPa) |
A tropical wave emerged off the west coast of Africa on June 2 and entered the Atlantic Ocean. Tracking westward, the system eventually reached the eastern Pacific on June 13. As it approached the Gulf of Tehuantepec, convection increased, despite strong wind shear. Early on June 16, sufficient development had taken place for the NHC to classify the wave as a tropical depression, at which time the depression was situated roughly 110 mi (175 km) south of Salina Cruz, Mexico. A scatterometer pass over the storm revealed it to have attained peak winds of 35 mph (55 km/h) later that day. Thereafter, wind shear took its toll on the system and its low-level circulation ultimately dissipated early on June 17 while still off the coast of Mexico.[27]
Due to its proximity to land, tropical storm watches and warnings were issued in advance of the storm when the system was first classified. This was discontinued when the system dissipated.[27] Rainfall associated with the depression extended as far north as Oaxaca. In San Juan Bautista Tuxtepec, 82 homes were damaged by flood waters and 40 others were affected in the town of Zimatlán de Alvarez.[28] Some homes lost their roofs and a few trees were downed as a result of high winds.[29]
Tropical Storm Blas[]
| Tropical storm (SSHWS) | |
  | |
| Duration | June 17 – June 21 |
|---|---|
| Peak intensity | 65 mph (100 km/h) (1-min) 994 mbar (hPa) |
On May 30, a new tropical wave moved off the west coast of Africa and entered the Atlantic Ocean. Little convective development took place as it traversed the region; however, as it crossed Central America between June 9 and 10, it began to show signs of strengthening. By June 13, an area of low pressure developed within the wave and slowly developed a surface circulation over the following 48 hours as it remained nearly stationary over open waters. Early on June 17, deep convection was able to maintain itself over the system, prompting the NHC to classify the low as Tropical Depression Three-E; at this time, the depression was situated 305 mi (490 km) south-southwest of Manzanillo, Mexico. Within hours of becoming a tropical depression, a ship in the region reported sustained winds of 45 mph (70 km/h), indicating that the system had developed into a tropical storm. The newly upgraded storm, now named Blas by the NHC, began to track slowly to the northwest, and later nearly due west, in response to a strengthening ridge over Mexico.[30]
Strong wind shear prevented Blas from strengthening further over the following day; however, by June 19, the system entered a region of weaker shear. This allowed convection to develop over the center of circulation and that afternoon, the storm attained its peak intensity with winds of 65 mph (105 km/h) and a pressure of 992 mbar (hPa; 29.29 inHg). Shortly thereafter, cooler sea surface temperatures took their toll on Blas, causing the storm to gradually weaken. By June 21, the system weakened to a tropical depression as convection diminished. Hours later, it degenerated into a non-convective remnant low while situated about 715 mi (1,150 km) west-southwest of the southern tip of Baja California Sur. The remnants of Blas persisted through June 23 as they continued westward, before it dissipated to a weak upper-level low.[30]
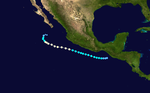
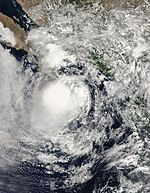
Hurricane Celia[]
| Category 5 hurricane (SSHWS) | |
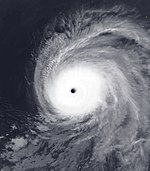 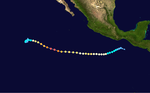 | |
| Duration | June 18 – June 28 |
|---|---|
| Peak intensity | 160 mph (260 km/h) (1-min) 921 mbar (hPa) |
Celia formed out of a tropical wave on June 18, quickly organized into a tropical storm, and later into a hurricane the following day as deep convection consolidated around the center. On June 21, the storm further intensified into a Category 2 hurricane; however, over the following days, Celia's winds fluctuated. The system briefly attained major hurricane status on June 23 before temporarily succumbing to wind shear. Once this shear lightened the next day, Celia rapidly intensified to attain its peak intensity with winds of 160 mph (255 km/h) and an estimated barometric pressure of 921 mbar (hPa; 27.20 inHg).[31]
Not long after reaching this strength, wind shear increased and the system entered a dry, stable environment. Over the following 42 hours, sustained winds decreased to tropical storm force and the system began to stall over the open ocean by June 27. Despite highly unfavorable conditions, the storm managed to retain tropical storm status through June 28 and degenerated into a non-convective remnant low that evening. The remnants of Celia continued to drift towards the north before finally dissipating on June 30, about 990 mi (1,590 km) southwest of the southern tip of Baja California Sur.[31]
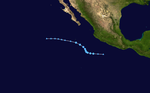
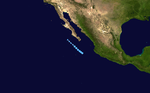
Hurricane Darby[]
| Category 3 hurricane (SSHWS) | |
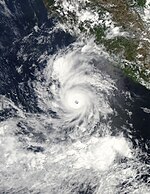  | |
| Duration | June 23 – June 28 |
|---|---|
| Peak intensity | 120 mph (195 km/h) (1-min) 959 mbar (hPa) |
The second, and final, major hurricane of the season, Hurricane Darby originated from a vigorous tropical wave that moved off the west coast of Africa on June 8. Initially well-organized, the wave rapidly deteriorated within 24 hours; it continued westward without redevelopment and entered the Eastern Pacific on June 19. The following day, an area of low pressure developed within the system as it slowed and turned towards the west-northwest. Gradually organizing, the low strengthened into a tropical depression on June 23 while situated roughly 380 mi (610 km) south-southeast of Salina Cruz, Mexico. Over the following two days, Darby underwent two periods of rapid intensification. At the end of the second phase on June 25, the storm attained its peak intensity as a Category 3 hurricane with winds of 120 mph (195 km/h) and a pressure of 959 mbar (hPa; 28.32 inHg). Though a strong storm, Darby was unusually small with tropical storm force winds extending only 70 mi (115 km) from its center.[32]
Not long after peaking, a large area of westerly winds, produced by Hurricane Alex over the Gulf of Mexico, caused Darby to stall offshore before turning to the east, being drawn into the circulation of the larger storm. Increased wind shear produced by the "massive outflow of Alex" caused the small storm to rapidly weaken.[32] By June 28, Darby had diminished to a tropical depression and later to a remnant low off the coast of Mexico. The low persisted for another day before fully dissipating offshore.[32]
While offshore, authorities in Mexico advised residents to be cautious of heavy rains from Darby. Alerts were issued for several areas; however, the storm dissipated before reaching land.[33][34] The combined effects of Hurricanes Alex and Darby resulted in heavy rains over much of Chiapas, amounting to 12 to 16 in (300 to 400 mm) in some areas. Flash flooding damaged 43 homes and affected 60,000 people.[35]
Tropical Depression Six-E[]
| Tropical depression (SSHWS) | |
  | |
| Duration | July 14 – July 16 |
|---|---|
| Peak intensity | 35 mph (55 km/h) (1-min) 1006 mbar (hPa) |
On July 11, a low pressure formed southwest of Central America.[36] The next day, the system began to organize.[37] After a decrease in convection,[38] the system became more concentrated.[39] After additional development, the NHC upgraded the disturbance into Tropical Depression Six-E on July 14.[40] Six-E slowed down forward momentum, and slowly turned north. The depression did not develop further, and it degenerated into an area of low pressure on July 16. However, the remnant low of the system continued moving westward for the next couple days, before fully dissipating on July 18.[41]
Though relatively far from land, the depression's outer bands brought locally heavy rains to portions of Colima and Jalisco.[42]
Tropical Storm Estelle[]
| Tropical storm (SSHWS) | |
  | |
| Duration | August 6 – August 10 |
|---|---|
| Peak intensity | 65 mph (100 km/h) (1-min) 994 mbar (hPa) |
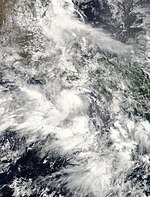
After an unusual, record inactive July, an area of disturbed weather formed off the south coast of Mexico, on August 4 from a tropical wave that left Africa 13 days earlier.[43] The system became better organized throughout the next day, and was upgraded into a tropical depression on August 6, 138 mi (222 km) southwest of Acapulco, Mexico. Initially, there was uncertainty regarding the storm's path.[44] It reached tropical storm status on the same day. On August 8, the storm showed signs of weakening. It was downgraded into a tropical depression the next day. Estelle became a remnant low on August 10, dissipating shortly thereafter.[43]
Though the center of Estelle remained offshore, its outer bands brought moderate to heavy rains and increased surf to coastal areas of Guerrero, Michoacán, Colima, and Jalisco on August 7.[45] The following day, a detachment of clouds associated with the storm brought locally heavy rains to Mazatlán, resulting in localized street flooding.[46]
Tropical Depression Eight-E[]
| Tropical depression (SSHWS) | |
  | |
| Duration | August 20 – August 21 |
|---|---|
| Peak intensity | 35 mph (55 km/h) (1-min) 1003 mbar (hPa) |
On August 3, a tropical wave moved off the west coast of Africa and tracked westward across the Atlantic Ocean. By August 15, the wave crossed Central America and entered the Eastern Pacific. Over the following five days, development was relatively slow at first, resulting in forecasters at the NHC not predicting the system to become a tropical cyclone. However, on August 20, a low-pressure area formed and quickly became a tropical depression. At this time, the system was situated roughly 185 mi (300 km) west-southwest of Manzanillo, Mexico. Tracking northwestward in response to a mid-level ridge over northwestern Mexico, the depression moved through a region of moderate wind shear, preventing further development. Once over cooler waters on August 21, convection began to wane and the system degenerated into a remnant low later that day. Continuing along the same path, the remnants of the depression dissipated early on August 23, over open waters.[47]
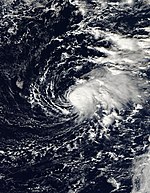
Hurricane Frank[]
| Category 1 hurricane (SSHWS) | |
  | |
| Duration | August 21 – August 28 |
|---|---|
| Peak intensity | 90 mph (150 km/h) (1-min) 978 mbar (hPa) |
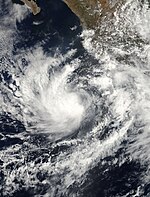
The tropical wave that became Frank was first noticed on August 15 south of the Windward Islands. Tropical Depression Nine-E formed on August 21 south of the Gulf of Tehuantepec. It developed into a tropical storm the following morning. On August 23, Frank continued to intensify, but later faced shear and entered a period of weakening. However, on August 24, as shear decreased, it began to reorganize and strengthen again, becoming a hurricane on August 25. Frank also formed an eye feature that persisted for about a day. Two days later, Frank weakened back into a tropical storm. Frank encountered unfavorable conditions of high shear and cool waters, causing it to rapidly weakening overnight. Frank became a remnant low on August 28.
In Mexico, six deaths were reported. A total 30 homes were destroyed with 26 others damaged. Two major roads were damaged with another road blocked due to a landslides. Several rivers overflowed their banks as well.[48] In the wake of the storm, 110 communities requested assistance from the government. By September 14, an estimated 200,000 food packages were distributed to the region. Losses from Hurricane Frank exceeded 100 million pesos (US$8.3 million).[49]
Tropical Depression Ten-E[]
| Tropical depression (SSHWS) | |
  | |
| Duration | September 3 – September 4 |
|---|---|
| Peak intensity | 35 mph (55 km/h) (1-min) 1003 mbar (hPa) |
Tropical Depression Ten-E originated from a tropical wave that moved off the west coast of Africa on August 14. Tracking westward, the wave eventually crossed Central America and entered the Pacific Ocean on August 26. Gradual organization took place by early September as deepening convection. During September 3, a low-level circulation developed within the system and the NHC classified it as a tropical depression. At this time, the depression was situated roughly 255 mi (410 km) south-southeast of the southern tip of Baja California Sur. Located between a strong ridge over Mexico and trough over the north Pacific Ocean, the system tracked northwestward throughout the remainder of its existence. Maximum sustained winds never exceeded 35 mph (55 km/h) before moving into a region cooler waters and moderate wind shear. The combination of these two factors caused convection to diminish; the depression degenerated into a non-convective remnant low on September 4 before dissipating the following day.[50]
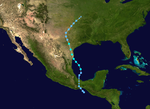
Tropical Depression Eleven-E[]
| Tropical depression (SSHWS) | |
  | |
| Duration | September 3 – September 4 |
|---|---|
| Peak intensity | 35 mph (55 km/h) (1-min) 1004 mbar (hPa) |
During mid-August, a westward moving tropical wave in the Atlantic Ocean spawned Hurricane Danielle.[51] The southern portion of this system continued its track and later entered the Eastern Pacific on August 29. By September 2, convection consolidated over the Gulf of Tehuantepec and a low-level circulation developed as it moved in a general northward direction. Classified a tropical depression the following day,[52] the National Hurricane Center initially expected it to attain tropical storm status before moving over land.[53] A ship in the region measured gale-force winds, supporting this forecast but later analysis revealed that these winds were associated with a broad monsoon trough which the depression was embedded within. Failing to intensify, the system made landfall near Salina Cruz, Mexico and rapidly weakened. Maintaining its circulation, the depression survived its crossing of Mexico and regenerated into Atlantic Tropical Storm Hermine. The crossover of this storm is regarded as an uncommon occurrence,[52] taking place only a handful of times since reliable records in the Atlantic began in 1851.[54]
Due to the depression's proximity to land, tropical storm warnings were issued for southern Mexico.[52] The depression produced a swath of heavy rain along its immediate track, with localized peaks over 10 in (250 mm) and a storm maximum of 13.6 in (350 mm) in Alvarado, Veracruz.[55] Flooding affected more than 25,000 people in Oaxaca and 6,000 people in Guerrero.[56][57] The monsoon trough in which the depression was embedded was responsible for tremendous damage across Central America,[52] including at least 54 fatalities and $500 million in damage across Guatemala.[58][59] At least three others perished in Costa Rica.[60]
Tropical Storm Georgette[]
| Tropical storm (SSHWS) | |
  | |
| Duration | September 20 – September 23 |
|---|---|
| Peak intensity | 40 mph (65 km/h) (1-min) 999 mbar (hPa) |
Georgette originated from a tropical wave that moved off the west coast of Africa on September 1. Tracking westward across the Atlantic, the wave eventually spawned an area of low pressure, which developed into Hurricane Karl on September 14. The wave itself continued through the Caribbean Sea, and entered the Eastern Pacific on September 17, but signification development was not anticipated. Tracking northwestward, the low gradually organized into a tropical depression by September 20, at which time it was situated south of Baja California Sur. Shortly thereafter, it intensified into a tropical storm and was named Georgette. On September 21, Georgette attained its peak intensity with winds of 40 mph (65 km/h) and a minimum pressure of 999 mbar (hPa; 29.50 inHg). The storm struck Baja California Sur later that day before weakening to a tropical depression. It continued north as a depression and made landfall on mainland Mexico on September 22. The system dissipated over northern Mexico early on September 23.[61]
Georgette caused the heaviest rains on Baja California Sur in the last 15 years, leaving many people homeless.[62] Georgette also produced high waves. The tropical cyclone worsened Mexico's flooding problem which started when Hurricane Karl made landfall several days earlier.[63] A peak rainfall total of 5.9 in (150 mm) fell in Todos Santos.[64] Throughout Sonora, rainfall up to 4.7 in (120 mm) triggered flooding that damaged 220 homes.[65] Georgette caused 2.61 in (66 mm) of rainfall in Guaymas[66] Flooding was reported in several places (Empalme, Etchojoa, Navojoa, Guaymas, Los Mochis), causing 500,000 people to be evacuated.[61] Heavy runoff caused inflows of 18,000 cu ft/s (510 m3/s) into El Novillo Dam, forcing the Comisión Nacional del Agua, the local water authorities, to release water from the dam.[67] After impacting Mexico, moisture from the system combined with an approaching trough to produce heavy rainfall and thunderstorms across New Mexico. A total of 6.42 in (163 mm) was reported in Gladstone.[68] The rains caused flooding that killed a person along the Rio Grande near Carnuel.[69]
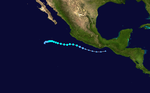
Tropical Storm Omeka[]
| Tropical storm (SSHWS) | |
  | |
| Duration | December 18 – December 21 |
|---|---|
| Peak intensity | 60 mph (95 km/h) (1-min) 997 mbar (hPa) |
On December 16, an extratropical cyclone over the Northern Pacific Ocean began showing signs of tropical cyclogenesis. Drifting southeastward around the International Date Line, the system developed into a subtropical depression within the Central Pacific basin on December 18, becoming the latest-forming system east of 180° and north of the equator in the Pacific Ocean on record. Turning southwest, the system intensified into a subtropical storm later that day before crossing into the Western Pacific. While west of the dateline, the system attained its peak intensity with winds of 60 mph (95 km/h). Gaining more tropical characteristics, the storm transitioned into a fully tropical system a few hours after crossing the dateline for a third time. Upon doing so, it was recognized by the Central Pacific Hurricane Center and given the name Omeka. Turning to the northeast, gradual weakening took place over the following days, before Omeka dissipated north of the Hawaiian Islands, on December 21.[70] That day, the center of Omeka brushed Lisianski Island, with winds of 40 miles per hour (65 km/h).[71] However, no tropical storm watches or warnings were issued since the CPHC anticipated weakening prior to the storm passing the island.[71]
At the time, Omeka was judged to have existed in the northeast Pacific later than any other storm since the 1960s, when reliable records begin in the basin.[70][72][73][2] However, according to the CPHC's database, there are two possible tropical cyclones in 1903 and 1904 which developed on December 23.[74] In addition, even though it did not strengthen into a tropical storm, Tropical Depression Nine-C of the 2015 Pacific hurricane season formed later in the calendar year than Omeka, forming on December 31, 2015 and dissipating the next day.[75]
Storm names[]
The following names were used for named storms that formed in East Pacific in 2010. This is the same list used in the 2004 season.[76] In March 2011, the World Meteorological Organization announced that it would not retire any names. However, in April 2015, the WMO announced that the name Isis (which was not used in 2010) was being retired, due to the rise of the terrorist group with the same name.[77] The name Ivette was chosen to replace it. Otherwise, this list was used again in the 2016 season.[78]
|
|
For storms that form in the Central Pacific Hurricane Center's area of responsibility, encompassing the area between 140 degrees west and the International Date Line, all names are used in a series of four rotating lists. The next four names that were slated for use in 2010 are shown below; however, only the name Omeka was used.
Retirement[]
On April 17, 2015, the name Isis was removed from the naming lists after being deemed inappropriate because of the militant group of the same name. It was replaced with Ivette for the 2016 season.[79]
Season effects[]
This is a table of all of the storms that have formed during the 2010 Pacific hurricane season. It includes their names, duration, peak strength, areas affected, damage, and death totals. Deaths in parentheses are additional and indirect (an example of an indirect death would be a traffic accident), but were still related to that storm. Damage and deaths include totals while the storm was extratropical, a wave, or a low, and all of the damage figures are in 2010 USD.
| Saffir–Simpson scale | ||||||
| TD | TS | C1 | C2 | C3 | C4 | C5 |
| Storm name |
Dates active | Storm category
at peak intensity |
Max 1-min wind mph (km/h) |
Min. press. (mbar) |
Areas affected | Damage (USD) |
Deaths | Refs
| ||
|---|---|---|---|---|---|---|---|---|---|---|
| Agatha | May 29–30 | Tropical storm | 45 (75) | 1001 | Southwestern Mexico, Central America | $1.11 billion | 204 | |||
| Two-E | June 16–17 | Tropical depression | 35 (55) | 1007 | Southwestern Mexico | Minor | None | |||
| Blas | June 17–21 | Tropical storm | 65 (100) | 994 | None | None | None | |||
| Celia | June 18–28 | Category 5 hurricane | 160 (260) | 921 | Southwestern Mexico, Clipperton Island | None | None | |||
| Darby | June 23–28 | Category 3 hurricane | 120 (195) | 959 | Southwestern Mexico | None | None | |||
| Six-E | July 14–16 | Tropical depression | 35 (55) | 1006 | Western Mexico | None | None | |||
| Estelle | August 6–10 | Tropical storm | 65 (100) | 994 | Southwestern Mexico, Northwestern Mexico | None | None | |||
| Eight-E | August 20–21 | Tropical depression | 35 (55) | 1003 | None | None | None | |||
| Frank | August 21–28 | Category 1 hurricane | 90 (150) | 978 | Southwestern Mexico, Western Mexico | $8.3 million | 6 | |||
| Ten-E | September 3–4 | Tropical depression | 35 (55) | 1003 | None | None | None | |||
| Eleven-E | September 3–4 | Tropical depression | 35 (55) | 1004 | Southwestern Mexico, Central America | $500 million | 0 (57) | |||
| Georgette | September 20–23 | Tropical storm | 40 (65) | 999 | Northwestern Mexico | Minor | 0 (1) | |||
| Omeka | December 18–21 | Tropical storm | 60 (95) | 997 | Hawaii | None | None | |||
| Season aggregates | ||||||||||
| 13 systems | May 29 – December 21 | 160 (260) | 921 | $1.62 billion | 210 (58) | |||||
See also[]
- List of Pacific hurricanes
- Pacific hurricane season
- 2010 Atlantic hurricane season
- 2010 Pacific typhoon season
- 2010 North Indian Ocean cyclone season
- South-West Indian Ocean cyclone seasons: 2009–10, 2010–11
- Australian region cyclone seasons: 2009–10, 2010–11
- South Pacific cyclone seasons: 2009–10, 2010–11
Notes[]
- ^ The totals represent the sum of the squares for every (sub)tropical storm's intensity of over 33 knots (38 mph, 61 km/h), divided by 10,000. Calculations are provided at Talk:2010 Pacific hurricane season/ACE calcs.
- ^ Values are only for the Eastern Pacific (east of 140°W).
- ^ Storm averages are those in parenthesis.
- ^ Percentage of average ACE through the end of the month
References[]
- ^ "Background Information: The North Atlantic Hurricane Season". Climate Prediction Center. National Oceanic and Atmospheric Administration. Retrieved September 26, 2013.
- ^ Jump up to: a b National Hurricane Center; Hurricane Research Division; Central Pacific Hurricane Center. "The Northeast and North Central Pacific hurricane database 1949–2019". United States National Oceanic and Atmospheric Administration's National Weather Service. Retrieved October 1, 2020. A guide on how to read the database is available here.
- ^ Jump up to: a b c "Northeast Pacific hurricane best track (HURDAT version 2)". Hurricane Research Division. National Oceanic and Atmospheric Administration. July 2014. Archived from the original on May 21, 2015. Retrieved June 22, 2015.
- ^ NOAA Predicts Below Normal Eastern Pacific Hurricane Season (Report). National Oceanic and Atmospheric Administration. May 27, 2010. Retrieved September 26, 2013.
- ^ Delores Clark (May 19, 2010). "NOAA Expects Below Normal Central Pacific Hurricane Season" (PDF). National Oceanic and Atmospheric Administration. Archived from the original (PDF) on June 13, 2010. Retrieved June 24, 2010.
- ^ Gerald Bell; Jae Schemm; Eric Blake; Todd Kimberlain; Christopher Landsea (May 27, 2010). "2010 Eastern Pacific Hurricane Season Outlook". National Oceanic and Atmospheric Administration. Archived from the original on May 29, 2010. Retrieved May 28, 2010.
- ^ Jump up to: a b c d e f Stacy R. Stewart; John P. Cangialosi (September 2012). "Eastern North Pacific Hurricane Season of 2010". Monthly Weather Review. American Meteorological Society. 140 (9): 2, 769–2, 781. Bibcode:2012MWRv..140.2769S. doi:10.1175/MWR-D-11-00152.1.
- ^ Hurricane Specialists Unit (June 1, 2010). Eastern Pacific Monthly Tropical Weather Summary for May 2010. National Hurricane Center (Report). Miami, Florida: National Oceanic and Atmospheric Administration. Retrieved June 22, 2015.
- ^ Jump up to: a b c Eric S. Blake (July 1, 2010). Eastern Pacific Monthly Tropical Weather Summary for June 2010. National Hurricane Center (Report). Miami, Florida: National Oceanic and Atmospheric Administration. Retrieved June 22, 2010.
- ^ Jump up to: a b Stacey R. Stewart; Todd B. Kimberlain; Jack L. Beven (August 1, 2010). Eastern Pacific Monthly Tropical Weather Summary for July 2010. National Hurricane Center (Report). Miami, Florida: National Oceanic and Atmospheric Administration. Retrieved June 22, 2015.
- ^ Robbie Berg (September 1, 2010). Eastern Pacific Monthly Tropical Weather Summary for August 2010. National Hurricane Center (Report). Miami, Florida: National Oceanic and Atmospheric Administration. Retrieved June 22, 2015.
- ^ Michael J. Brennan (October 1, 2010). Eastern Pacific Monthly Tropical Weather Summary for September 2010. National Hurricane Center (Report). Miami, Florida: National Oceanic and Atmospheric Administration. Retrieved June 22, 2015.
- ^ Jump up to: a b Todd B. Kimberlain; Eric S. Blake; Stacy R. Stewart; Robbie Berg (November 1, 2010). Eastern Pacific Monthly Tropical Weather Summary for October 2010. National Hurricane Center (Report). Miami, Florida: National Oceanic and Atmospheric Administration. Retrieved June 22, 2015.
- ^ Hurricane Specialists Unit (December 1, 2010). Eastern Pacific Monthly Tropical Weather Summary for November 2010. National Hurricane Center (Report). Miami, Florida: National Oceanic and Atmospheric Administration. Retrieved June 22, 2015.
- ^ Raymond Tanabe (February 28, 2011). "Review of the 2010 Central Pacific Tropical Cyclone Season and Preliminary Verification". Office of the Federal Coordinator for Meteorology. Archived from the original (PPTX) on July 18, 2011. Retrieved March 8, 2011.
- ^ Eric S. Blake (June 25, 2010). Hurricane Darby Discussion Number 12. National Hurricane Center (Report). Miami, Florida: National Oceanic and Atmospheric Administration. Retrieved June 22, 2015.
- ^ Eric S. Blake (August 21, 2014). Tropical Cyclone Report: Hurricane Cristina (PDF). National Hurricane Center (Report). Miami, Florida: National Oceanic and Atmospheric Administration. Retrieved June 22, 2015.
- ^ Lixion A. Avila (June 3, 2015). "Hurricane Blanca Advisory Number 12". National Hurricane Center. Miami, Florida: National Oceanic and Atmospheric Administration. Retrieved June 22, 2015.
- ^ Jeff Masters (April 4, 2011). "The global tropical cyclone season of 2010: record inactivity". Weather Underground. Retrieved April 4, 2011.
- ^ Jump up to: a b John L. Beven II (January 10, 2011). Tropical Cyclone Report: Tropical Storm Agatha (PDF). National Hurricane Center (Report). Miami, Florida: National Oceanic and Atmospheric Administration. Retrieved June 27, 2015.
- ^ Juan Carlos Llorca (May 31, 2010). "Tropical Storm Agatha kills 142 in Central America". Yahoo! News. Associated Press. Archived from the original on June 18, 2010. Retrieved June 21, 2010.
- ^ Jump up to: a b Evaluación de daños y pérdidas en El Salvador ocasionados por la tormenta tropical Agatha (PDF) (Report) (in Spanish). United Nations Economic Commission for Latin America and the Caribbean. June 2010. Retrieved June 30, 2015.
- ^ Staff Writer (May 31, 2010). "Agatha storm deaths rise across Central America". BBC. Archived from the original on June 2, 2010. Retrieved June 21, 2010.
- ^ Tropical Storm Agatha, Final Report (PDF). International Federation of Red Cross and Red Crescent Societies (Report). ReliefWeb. April 20, 2012. Retrieved June 27, 2015.
- ^ Central America – Tropical Storm Agatha, Situation Report #2 (PDF) (Report). ReliefWeb. United Nations Office for the Coordination of Humanitarian Affairs. June 3, 2010. Retrieved June 30, 2015.
- ^ Steve Lang; Rob Gutro; Ed Olsen; Hal Pierce (June 4, 2010). "Hurricane Season 2010: Agatha (Eastern Pacific Ocean)". National Aeronautics and Space Administration. Retrieved June 30, 2015.
- ^ Jump up to: a b Michael J. Brennan (July 28, 2010). Tropical Cyclone Report: Tropical Depression Two-E (PDF). National Hurricane Center (Report). Miami, Florida: National Oceanic and Atmospheric Administration. Retrieved June 27, 2015.
- ^ Jimenez Luna (June 17, 2010). "Depresión Tropical 2-E se dirige a Guerrero" (in Spanish). Noticias.
- ^ Oscar Rodríguez (June 17, 2010). "Más de 150 damnificados en Oaxaca por depresión tropical 2-E". Milenio (in Spanish). Oaxaca, Mexico. Archived from the original on June 17, 2010. Retrieved June 17, 2010.
- ^ Jump up to: a b Robbie Berg (July 31, 2010). "Tropical Storm Blas Tropical Cyclone Report" (PDF). National Hurricane Center. Retrieved August 2, 2010.
- ^ Jump up to: a b Todd B. Kimberlain (October 6, 2010). "Hurricane Celia Tropical Cyclone Report" (PDF). National Hurricane Center. Retrieved December 1, 2010.
- ^ Jump up to: a b c Stacy R. Stewart (November 18, 2010). Tropical Cyclone Report: Hurricane Darby (PDF). National Hurricane Center (Report). Miami, Florida: National Oceanic and Atmospheric Administration. Retrieved July 8, 2015.
- ^ "Alerta en cuatro estados por huracán Darby" (in Spanish). Informador. June 25, 2010. Retrieved March 21, 2011.
- ^ "Huracán Darby sube a nivel 3 frente a costas mexicanas". La Prensa (in Spanish). Agence-France-Presse and Reuters. June 25, 2010. Retrieved March 21, 2011.
- ^ Óscar Gutiérrez (June 26, 2010). "'Darby' y 'Alex' provocan primeras inundaciones". El Universal (in Spanish). Retrieved March 21, 2011.
- ^ Stewart (July 11, 2010). "Tropical Weather Outlook". National Hurricane Center. Retrieved July 15, 2010.
- ^ Chirs Landesa; Stewart (July 12, 2010). "Tropical Weather Outlook (2)". NOAA. National Hurricane Center. Retrieved July 15, 2010.
- ^ Robbie Breg (July 12, 2010). "Tropical Weather Outlook (3)". National Hurricane center. Retrieved July 15, 2010.
- ^ Robbie Berg (July 13, 2010). "Tropical Weather Outlook (4)". National Hurricane Center. Retrieved July 15, 2010.
- ^ "Tropical Depression Six-E Discussion 1". National Hurricane Center. July 14, 2010. Archived from the original on July 18, 2010. Retrieved July 14, 2010.
- ^ http://www.nhc.noaa.gov/data/tcr/EP062010_Six-E.pdf
- ^ Notimex (July 15, 2010). "Depresión tropical afectará Colima y Jalisco". El Universal (in Spanish). Retrieved March 23, 2011.
- ^ Jump up to: a b Eric Blake. "Tropical Cyclone Report – Estelle" (PDF). National Hurricane center. Retrieved December 3, 2010.
- ^ John Brown (May 8, 2010). "Tropical Depression Seven-E Discussion". National Hurricane Center. Archived from the original on August 18, 2010. Retrieved May 8, 2010.
- ^ Notimex (August 7, 2010). "Afectará Estelle Guerrero, Michoacán, Colima" (in Spanish). Noticias MVX. Archived from the original on September 6, 2012. Retrieved March 23, 2011.
- ^ Manuel Guízar (August 8, 2010). "Empapan lluvias de "Estelle" a Mazatlán" (in Spanish). Noroeste. Retrieved March 23, 2011.
- ^ Richard J. Pasch (January 24, 2011). "Tropical Depression Eight-E Tropical Cyclone Report" (PDF). National Hurricane Center. Retrieved March 23, 2011.
- ^ IRZA (August 2010). "Estiman que "Frank" dejó daños por $14 millones" (in Spanish). El Sol de Chilpancingo. Retrieved March 9, 2011.
- ^ Sandra Pacheco (September 14, 2010). "Necesarios más de 100 mdp para atender emergencia: URO" (in Spanish). CNX Oaxaca. Archived from the original on July 14, 2014. Retrieved March 22, 2011.
- ^ John P. Cangialosi (October 28, 2010). "Tropical Depression Ten-E Tropical Cyclone Report" (PDF). National Hurricane Center. Retrieved March 21, 2011.
- ^ Todd B. Kimberlain (December 15, 2010). "Hurricane Danielle Tropical Cyclone Report" (PDF). National Hurricane Center. Retrieved March 9, 2011.
- ^ Jump up to: a b c d John L. Beven II (December 6, 2011). "Tropical Depression Eleven-E Tropical Cyclone Report" (PDF). National Hurricane Center. Retrieved March 9, 2011.
- ^ Robbie Berg; Michael Brennan (September 3, 2010). "Tropical Depression Eleven-E Discussion One". National Hurricane Center. Retrieved March 9, 2011.
- ^ Hurricane Research Division (2010). "Easy-to-Read HURDAT (1851–2009)". National Hurricane Center. Retrieved March 9, 2011.
- ^ David M. Roth (2010). Tropical Depression 11E/T. S. Hermine - September 3-11, 2010. Weather Prediction Center (Report). National Oceanic and Atmospheric Administration. Retrieved June 28, 2015.
- ^ Agustín Galo; Hiram Moreno; Octavio Vélez (September 5, 2010). "La situación es de desastre en Juchitán; imposible hacer más" (in Spanish). Oaxaca, Oaxaca: La Jordana. Retrieved June 28, 2015.
- ^ Adriana Covarrubias (September 7, 2010). "Lluvias afectan a 6 mil familias in Guerrero". El Universal (in Spanish). Acapulco, Mexico. Retrieved June 28, 2015.
- ^ "Mantiene Guatemala alerta por lluvias que han causado 54 muertos" (in Spanish). Guatemala City, Guatemala: Informador. September 13, 2010. Retrieved June 28, 2015.
- ^ "International Disaster Database: Disaster List". Centre for Research on the Epidemiology of Disasters. 2015. Archived from the original on July 8, 2015. Retrieved June 28, 2015.
- ^ Solange Garrido (September 4, 2010). "Tres muertos en Costa Rica tras deslizamiento de tierra por fuertes lluvias" (in Spanish). Radio Bio Bio. Retrieved March 9, 2011.
- ^ Jump up to: a b Michael J. Brennan (November 4, 2010). "Tropical Storm Georgette Tropical Cyclone Report" (PDF). National Hurricane Center. Retrieved March 9, 2011.
- ^ "Mexico hit by Tropical Storm Georgette". Breaking Travel News. July 23, 2010. Retrieved July 23, 2010.
- ^ "Tropical storm brings fresh flood misery to Mexico". BBC News. August 4, 2011. Retrieved August 1, 2011.
- ^ David M. Roth (October 21, 2010). "Tropical Storm Georgette". Hydrometeorological Prediction Center. Retrieved July 27, 2011.[permanent dead link]
- ^ Ulises Gutiérrez, Javier Valdez, Sergio Ocampo, Julia Le Duc, David Carrizales, Agustín Galo, Octavio Vélez, René Alberto López, Luis A. Boffil y Notimex (September 23, 2010). "Graves daños en varias zonas de Sonora, tras intensas lluvias" (in Spanish). La Jordana. Archived from the original on February 28, 2012. Retrieved September 28, 2010.CS1 maint: multiple names: authors list (link)
- ^ Ojeda, Yesicka (September 22, 2010). "Levantan alerta por "Georgette" en Guaymas y Empalme". El Imparcial (in Spanish). Hermosillo. Archived from the original on February 22, 2014. Retrieved September 23, 2010.
- ^ Ojeda, Yesika; Francisco Reza (September 23, 2010). "Deja "Georgette" agua a Sonora". El Imparcial (in Spanish). Hermosillo. Archived from the original on February 22, 2014. Retrieved September 23, 2010.
- ^ "A Recipe for Heavy Rain - September 22, 2010". Albuquerque, New Mexico National Weather Service. December 31, 2010. Retrieved January 27, 2012.
- ^ Storm Events Database. National Centers for Environmental Information (Report). National Oceanic and Atmospheric Administration. September 22, 2010. Retrieved May 28, 2019.
- ^ Jump up to: a b Timothy A. Craig, Samuel H. Houston; Central Pacific Hurricane Center (March 8, 2011). Tropical Storm Omeka (PDF) (Tropical Cyclone Report). Central Pacific Hurricane Center. Retrieved June 9, 2019.
- ^ Jump up to: a b Raymond M. Tanabe (December 21, 2010). "Tropical Storm Omeka Discussion Four". Central Pacific Hurricane Center. Retrieved December 21, 2010.
- ^ Timothy A. Craig (December 20, 2010). "Tropical Storm Omeka Public Advisory One". Central Pacific Hurricane Center. Retrieved December 20, 2010.
- ^ Central Pacific Hurricane Center. "Previous Tropical Systems of the Central Pacific". Archived from the original on February 23, 2007. Retrieved February 23, 2007.
- ^ "Tropical Cyclones During the Years 1900 - 1952". Central Pacific Hurricane Center. May 4, 2007. Retrieved December 20, 2010.
- ^ Sam Houston; Tom Birchard (December 22, 2016). Tropical Depression Nine-C (PDF) (Report). Tropical Cyclone Report. Honolulu, Hawaii: Central Pacific Hurricane Center. Retrieved January 8, 2017.
- ^ National Hurricane Center (January 8, 2010). "Worldwide Tropical Cyclone Names". National Oceanic and Atmospheric Administration. Archived from the original on June 29, 2010. Retrieved June 24, 2010.
- ^ "'Isis' among names removed from UN list of hurricane names | News by Country | Reuters". af.reuters.com. Archived from the original on April 17, 2015. Retrieved September 14, 2016.
- ^ Dennis Feltgen (March 16, 2011). "Two Tropical Cyclone Names Retired from List of Atlantic Storms". National Hurricane Center. Archived from the original on May 1, 2011. Retrieved March 21, 2011.
- ^ "'Isis' among names removed from UN list of hurricane names". Reuters. April 17, 2015. Archived from the original on April 17, 2015. Retrieved April 17, 2015.
External links[]
| Wikimedia Commons has media related to 2010 Pacific hurricane season. |
- National Hurricane Center Website
- National Hurricane Center's Eastern Pacific Tropical Weather Outlook
- Servicio Meteorológico Nacional Website (in Spanish)
- NHC 2010 Pacific hurricane season archive
| show Tropical cyclones of the 2010 Pacific hurricane season |
|---|

- 2010 Pacific hurricane season
- Pacific hurricane seasons
- Tropical cyclones in 2010