2011 Pacific hurricane season
| 2011 Pacific hurricane season | |
|---|---|
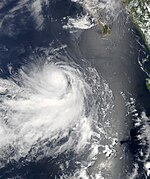
 Season summary map | |
| Seasonal boundaries | |
| First system formed | June 7, 2011 |
| Last system dissipated | November 25, 2011 |
| Strongest storm | |
| Name | Dora |
| • Maximum winds | 155 mph (250 km/h) (1-minute sustained) |
| • Lowest pressure | 929 mbar (hPa; 27.43 inHg) |
| Seasonal statistics | |
| Total depressions | 13 |
| Total storms | 11 |
| Hurricanes | 10 |
| Major hurricanes (Cat. 3+) | 6 |
| Total fatalities | 49 total |
| Total damage | > $204 million (2011 USD) |
| Related articles | |
The 2011 Pacific hurricane season was a below average season in terms of named storms, although it had an above average number of hurricanes and major hurricanes. During the season, 13 tropical depressions formed along with 11 tropical storms, 10 hurricanes and 6 major hurricanes. The season officially began on May 15 in the East Pacific Ocean, and on June 1 in the Central Pacific; they ended on November 30. These dates conventionally delimit the period of each year when most tropical cyclones form in the Pacific basin. However, the formation of tropical cyclones is possible at any time of the year.
Despite the decrease in storms, there were several intense and destructive hurricanes this season. Hurricane Beatriz killed four people in Southwestern Mexico. Hurricane Jova killed eight and caused $203.67 million (2011 USD) in damage to Western Mexico. Tropical Depression Twelve-E killed 30 people in Central America. Meanwhile, Kenneth became the strongest November storm at the time. Hurricane Hilary brought additional flooding to Southwestern Mexico.
Seasonal forecasts[]
| Source | Date | Named storms |
Hurricanes | Major hurricanes |
Ref |
|---|---|---|---|---|---|
| Average (1981–2010) | 15.6 | 8.6 | 4.1 | [1] | |
| Average (1995–2010) | 14 | 7 | 3 | [2] | |
| Record high activity | 27 | 16 (Tie) | 11 | ||
| Record low activity | 8 (Tie) | 3 | 0 (Tie) | ||
| ––––––––––––––––––––––––––––––––––––––––––––––––––––––– | |||||
| CPC | May 19, 2011 | 9–15 | 5–8 | 1–3 | [2] |
| ––––––––––––––––––––––––––––––––––––––––––––––––––––––– | |||||
| Actual activity | 11 | 10 | 6 | ||
On May 19, the Climate Prediction Center released its pre-season outlook. The scientists stated a 70% chance of a below-normal season, a 25% chance of a near-normal season and a 5% chance of an above-normal season. The climatologists expected 9–15 named storms, with 5–8 becoming hurricanes, and 1–3 becoming major hurricanes. The accumulated cyclone energy was expected to be 45 to 105% of the median. The below-normal activity forecast was because of increased wind shear and a high expectation of El Niño–Southern Oscillation (ENSO)-neutral conditions (no El Niño or La Niña) throughout the peak months of July, August and September, together with lingering La Niña conditions at the beginning of the season.[3]
Seasonal summary[]

The season got off to an active start with first storm, Adrian, becoming one of only a handful of tropical cyclones to attain Category 4 status in June. Four other storms, Dora, Eugene, Hilary, and Kenneth attained Category 4 status. Dora was the strongest storm of the year, peaking at 155 mph, just short of Category 5 status. The month of August was about average in terms of the number of storms, with the strongest of the month being Eugene. However, the first half of September had very little activity, due to the return of a La Niña event. Tropical Depression Eight-E was the only storm in the first half of September, when it dissipated on September 1.
Hilary became the second storm to form in September, becoming the fourth major hurricane of the season, during the afternoon hours of September 22. After Hilary, Jova unexpectedly became the fifth major hurricane of the season during the early morning hours of October 10. Tropical Depression Twelve-E killed 30 people in Central America when it made landfall near El Salvador on October 12. On November 19, Kenneth formed as a tropical depression and quickly strengthened into a hurricane two days later. Kenneth became the first major hurricane in November and latest-forming major hurricane in the eastern north Pacific basin in the satellite era, until being surpassed by Hurricane Sandra in 2015; the last to do so was Winnie in 1983, which only peaked at Category 1 hurricane status. Hurricane Kenneth, however, intensified to attain Category 4 status on November 22, which broke the record at the time.
The accumulated cyclone energy (ACE) index for the 2011 Pacific hurricane season was 119.59 units in the Eastern Pacific and 1.29 units in the Central Pacific. The total ACE in the basin is 120.88 units.[nb 1] Broadly speaking, ACE is a measure of the power of a tropical or subtropical storm multiplied by the length of time it existed. It is only calculated for full advisories on specific tropical and subtropical systems reaching or exceeding wind speeds of 39 mph (63 km/h).
Systems[]
Hurricane Adrian[]
| Category 4 hurricane (SSHWS) | |
  | |
| Duration | June 7 – June 12 |
|---|---|
| Peak intensity | 140 mph (220 km/h) (1-min) 944 mbar (hPa) |
In early June, a well-defined area of low pressure produced disorganized weather several hundred miles from the Pacific coast of Mexico.[4] By June 7, the low developed sufficiently organized deep convection to be classified as a tropical cyclone, and the National Hurricane Center (NHC) designated it as Tropical Depression One-E at 1500 UTC, about 365 mi (585 km) south of Acapulco. Upon developing, the depression was located over warm sea surface temperatures, and upper-level wind shear in its vicinity was forecast to remain conducive for intensification.[5] Caught in weak steering currents, the system further organized while moving little; it was upgraded to Tropical Storm Adrian later that day, with winds of 60 mph (95 km/h).[6]
Steady strengthening continued, and Adrian became a hurricane early on June 9 as it tracked toward the west-northwest along high pressure over Mexico.[7] The storm subsequently entered a phase of rapid intensification, developing a distinct eye with good outflow aloft. That same day, Adrian attained major hurricane status several hundred miles off the coast of Cabo Corrientes;[8] it peaked in intensity as a Category 4 storm shortly afterward, with sustained winds of 140 mph (225 km/h).[9] For several hours, the hurricane exhibited what appeared to be an annular structure, maintaining an unusually large eye and symmetric central dense overcast. As a result, eyewall replacement cycles were not expected to occur, and Adrian was forecast to remain well-organized and only slowly weaken in response to slightly cooler waters.[10] However, the hurricane defied predictions and began devolving rapidly the next day, likely due to "an unexpectedly early increase of vertical wind shear coupled with marginal thermodynamics" as noted by the NHC. On June 11, Adrian was downgraded to tropical storm status, recurving toward the west as a tight swirl of low-level clouds with little to no deep convection near its center.[11][12] It further weakened to a tropical depression the next day, and by 1500 UTC Adrian remained without convection and was declassified as a tropical cyclone while decelerating to the northwest.[13][14] The outer rainbands of Hurricane Adrian brought widespread rainfall in Mexico.[15]
Hurricane Beatriz[]
| Category 1 hurricane (SSHWS) | |
  | |
| Duration | June 19 – June 22 |
|---|---|
| Peak intensity | 90 mph (150 km/h) (1-min) 977 mbar (hPa) |
On June 14, the NHC noted a large area of scattered showers and thunderstorms associated with a monsoon trough over the east Pacific, several hundred miles from the coast of Acapulco, Mexico.[16] A quasi-stationary surface low formed in association with the activity, and over the subsequent days convection consolidated in the vicinity of an anticyclone over the southwestern Caribbean.[17] Curved rainbands began developing around the center, and on June 19 the system acquired sufficient organization to be classified as a tropical depression. Turning toward the northwest along a weakness in the subtropical ridge to its north, the depression further strengthened within a favorable environment and was upgraded to Tropical Storm Beatriz at 1800 UTC that day, with winds of 40 mph (65 km/h).[18][19]
Late on June 20, Beatriz was upgraded to a hurricane, with winds of 75 mph (120 km/h) and a pressure of 985 mbar (29.1 inHg). Beatriz continued to strengthen and reached winds of 90 mph (145 km/h) and a pressure reading of 977 mbar (28.9 inHg) while it neared the coast of Mexico. After moving along the coast, it weakened to a tropical storm and dissipated the next day. But the NHC noted that Beatriz's remnants still had a near 0% chance of redeveloping, as they remained almost stationary.[20] But on June 23, convection dissipated, and Beatriz's remnants slowly began to accelerate to the west, as the remnant low dissipated rapidly. Late on June 24, the remnants of Hurricane Beatriz dissipated completely, to the southwest of the Baja California Peninsula.[21]
Several landslides blocked off roads and a 100 m (330 ft) section of a roundabout was destroyed.[22] In the community of Amatillo, three people were killed after being washed away by flood waters.[23] Heavy rains from Beatriz caused the Sabana River to overflow its banks, placing 150 homes across 14 colonias under water.[24]
Hurricane Calvin[]
| Category 1 hurricane (SSHWS) | |
  | |
| Duration | July 7 – July 10 |
|---|---|
| Peak intensity | 80 mph (130 km/h) (1-min) 984 mbar (hPa) |
On July 5, an area of showers and thunderstorms formed south of the Gulf of Tehuantepec associated with a broad area of low pressure.[25] The system slowly organized, and the National Hurricane Center designated the system Tropical Depression Three-E on July 7. By the next day, the tropical depression gained enough organization to be named Calvin. Calvin strengthened into a hurricane and attained peak strength early on July 9 before rapidly weakening later that day. Calvin degenerated into a remnant low early on July 10.[26] During the next 3 days, Calvin's remnants quickly moved to the west, while dissipating rapidly. On July 13, Calvin's remnants dissipated completely, just to the east of the Central Pacific Ocean.[27]
Hurricane Dora[]
| Category 4 hurricane (SSHWS) | |
  | |
| Duration | July 18 – July 24 |
|---|---|
| Peak intensity | 155 mph (250 km/h) (1-min) 929 mbar (hPa) |
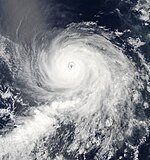
In the early morning hours of July 14, a tropical wave had moved off the Colombian coast.[28] The wave gained convection as it moved into the southwestern Caribbean, and the National Hurricane Center (NHC) began to monitor the disturbance, giving it a 10% chance of development into a tropical cyclone.[29] Over the rest of the day, the storm continued to move westward until it moved ashore on the Nicaragua/Costa Rica border the next day.[30] On July 16, the National Hurricane Center began monitoring the area of low pressure off the coast of Guatemala. Slowly organizing, the low-pressure area had gained enough strength to be declared Tropical Depression Four-E during the morning hours of July 18.[31] Just three hours later, the system was upgraded to Dora, the fourth tropical storm of the 2011 Pacific hurricane season.[32] Continuing to organize, Dora reached hurricane strength late on July 20,[33] before rapidly intensifying into a major hurricane later the next day. Strengthening further, Dora reached a peak of 155 mph (250 km/h) early on July 21, making it a Category 4 hurricane on the Saffir–Simpson hurricane scale. However, after entering cooler waters, Dora began to weaken the next day. On July 23, Dora was downgraded to a tropical storm, and the next day, Dora was no longer a tropical cyclone.[34] As a remnant low, the circulation began to curve around the high-pressure area that had steered Dora for much of its existence on July 25.[35] Early on July 26, the remnants of Hurricane Dora dissipated completely, over Central Baja California.[36]
Hurricane Eugene[]
| Category 4 hurricane (SSHWS) | |
  | |
| Duration | July 31 – August 6 |
|---|---|
| Peak intensity | 140 mph (220 km/h) (1-min) 942 mbar (hPa) |
On early July 31, a tropical wave developed into a tropical depression in the eastern Pacific a few hundred miles south of Mexico. Meteorologists numbered it "Five-E". It was upgraded to Tropical Storm Eugene only 6 hours after becoming a tropical depression. On the afternoon of August 1, Eugene strengthened into a Category 1 hurricane on the Saffir–Simpson hurricane scale. The next day Eugene further strengthened into a Category 2 hurricane. Early on August 3 Eugene further strengthened into a Category 3 hurricane, making it the third major hurricane of the season. Eugene was expected to weaken after becoming a Category 3. However, on the afternoon of August 3, Eugene strengthened into a Category 4 hurricane on the Saffir–Simpson hurricane scale with winds up to 140 mph (225 km/h). Eugene only maintained Category 4 status briefly, and only six hours later, the hurricane weakened to a Category 3 with winds up to 125 mph (200 km/h). Eugene quickly weakened on August 5 because of unfavorable conditions, dropping from Category 2 status to tropical storm status in only 18 hours. On August 6, Eugene became a post-tropical low as the center of the storm was void of strong convection.[37] During the next few days, Eugene's remnants continued to move westward slowly, while weakening gradually. On August 10, the remnants of Hurricane Eugene dissipated roughly 980 mi (1,555 km) east of Hawaii.[38]
Tropical Storm Fernanda[]
| Tropical storm (SSHWS) | |
  | |
| Duration | August 15 – August 20 |
|---|---|
| Peak intensity | 70 mph (110 km/h) (1-min) 992 mbar (hPa) |
The tropical wave that spawned Tropical Storm Emily in the Atlantic Ocean crossed Central America into the East Pacific on August 6. Producing disorganized deep convection, a surface circulation became discernible on August 13, and the formation of showers and thunderstorms in curved bands around the circulation signified the formation of Tropical Depression Six-E by 18:00 UTC on August 15, about 1,400 nautical miles east-southeast of Hawai'i. An increase deep convection resulted in the depression strengthening into Tropical Storm Fernanda at 6:00 UTC the next morning. A relaxation in shear allowed Fernanda to become more organized and reach an intensity of 45 knots (50 mph) later that day. Fernanda initially moved west under the influence of a subtropical ridge, but it turned northwest through a weakness in the ridge on August 17 into more favorable conditions and strengthened to a peak intensity of 70 mph winds and a minimum pressure of 992 millibars at 6:00 UTC on August 18. Fernanda was the only named storm this season not to clear hurricane strength.
Shortly after reaching peak intensity, the storm crossed into the Central Pacific basin. Continuing west-northwestward, Fernanda began weakening late on August 18 as dry, stable air was entrained into its circulation and it encountered increasing south-southeasterly shear. Most of Fernanda's deep convection had dissipated by August 20, and it degenerated to a remnant low. The post-tropical low continued westward before dissipating the next day a couple hundred nautical miles south of the Hawaiian Islands.[39]
Hurricane Greg[]
| Category 1 hurricane (SSHWS) | |
  | |
| Duration | August 16 – August 21 |
|---|---|
| Peak intensity | 85 mph (140 km/h) (1-min) 979 mbar (hPa) |
On the afternoon of August 16, a vigorous area of low pressure developed into Tropical Depression Seven-E. It was upgraded to Tropical Storm Greg 12 hours after formation.[40] The storm steadily intensified over 85 °F (29 °C) sea surface temperatures and it reached hurricane status late on August 17 with maximum sustained winds of 75 mph. Greg continued strengthening to attain peak winds of 85 mph and a pressure of 980 mbar.[41] Soon afterward, the storm began to gradually weaken due to cooler waters and higher wind shear and on August 19, Greg weakened to tropical storm strength, with maximum sustained winds of 65 mph.[42] The storm continued to weaken as it encountered unfavorable wind shear and as it began to traverse cooler waters, and on August 20 Greg had weakened to a tropical depression. Greg maintained tropical depression status until August 21, when it degenerated into a remnant low.[43][failed verification] During that day, Greg's remnants moved northeastward due to a High Pressure System. From late on August 22, until the early afternoon of August 23, Greg's remnants impacted Southern California, bringing overcast skies, even though the center of circulation itself moved southeastward slowly and was positioned far southwest of Southern California.[44] Greg's remnants continued to drift westwards, as they weakened rapidly. Late on August 24, the remnants of Hurricane Greg dissipated completely, far west of the southern tip of the Baja California Peninsula.[45]
Tropical Depression Eight-E[]
| Tropical depression (SSHWS) | |
  | |
| Duration | August 31 – September 1 |
|---|---|
| Peak intensity | 35 mph (55 km/h) (1-min) 1002 mbar (hPa) |
The National Hurricane Center (NHC) began to monitor an area of disturbed weather southwest of the Mexican Riviera in late August. Initially, poorly organized, environmental conditions were conductive for some development.[46] Shortly thereafter, the cloud patterns improved and overall thunderstorm activity increased.[47] Thunderstorm activity become more concentrated two days later while located 60 mi (97 km) south of Zinhuatnejo, and the NHC noted that the disturbance could become a tropical depression within hours.[48] This held true, and at 1500 UTC August 31, the low was upgraded into a tropical depression, but no further intensification was anticipated.[49] Eight-E soon made landfall on Southwestern Mexico, and moved north-northwestwards, as it rapidly weakened. Eight-E dissipated to a remnant low several hours later, early on September 1.[50] However, the remnants of Tropical Depression Eight-E survived, and they as they began moving westward, the remnants impacted Western Mexico. During the early afternoon of September 1, the remnants of Eight-E moved off the western coast of Western Mexico. During the next day, the remnants strengthened slightly in intensity, as it moved northwestward, towards the Baja California Peninsula. But late on September 2, the remnants of Tropical Depression Eight-E dissipated completely, just southeast of the peninsula.
Hurricane Hilary[]
| Category 4 hurricane (SSHWS) | |
  | |
| Duration | September 21 – September 30 |
|---|---|
| Peak intensity | 145 mph (230 km/h) (1-min) 942 mbar (hPa) |
A tropical disturbance gained enough organization early on September 21 to be declared as a tropical depression, the ninth of the season. Continuing to organize, the depression strengthened into a tropical storm several hours later. On September 22, the meteorologists declared Hilary as a Category 1 hurricane, becoming the seventh of the season. On September 22, it rapidly strengthened into a small, Category 4 hurricane, featuring a well-defined eye and very deep convection. It later reached a peak intensity of 145 mph (235 km/h) at 0600 UTC September 23 (11 p.m. AST September 22). However, the storm began to enter an area of higher wind shear and cooler ocean temperatures on September 24, and Hilary began to weaken. The hurricane weakened back down to a Category 3 hurricane early on September 25, but was later upgraded briefly to a Category 4 again the following afternoon.[51][52] Several hours later, the storm was once again downgraded into a Category 3 hurricane, and during the afternoon hours of September 27, Hilary was further downgraded into a Category 2 hurricane. Early the following morning, Hilary weakened into a Category 1 hurricane, and weakened into a tropical storm on September 28.[53] Losing a lot of its convection on September 30, the National Hurricane Center noted that Hilary had weakened into a tropical depression. Several hours later, after sustaining no deep convection atop its centre, Hilary was declared a remnant low, located several hundred miles away from any landmasses. Over the next 3 days Hilary's remnant low subsequently moved towards the southwest, before dissipating after 1200 UTC on October 3, about 1,050 mi (1,690 km) to the west of the southern tip of Baja California.[54]
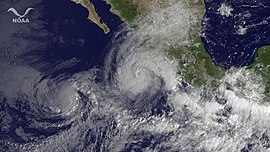
Tropical cyclone warnings and watches were also issued for portion of the coast. Large swells were also expected.[55] A red (emergency) alert was issued for parts of the coast. Officials urged residents to be prepared to evacuate. The port of Acapulco was closed for small craft. A moderate to high alert of rain and wind was noted.[56] The storm's outer bands produced heavy rainfall over Chiapas and Tabasco, with accumulations in Tabasco reaching 8.58 in (218 mm) in 24 hours.[57] Several rivers across the region overflowed their banks and flooded nearby areas. In Villahermosa, heavy rain collapsed drains and many streets were flooded. In addition, cars were stranded in floodwaters. Across Colima, waves reached 9 to 15 ft (2.7 to 4.6 m).[58]
Hurricane Jova[]
| Category 3 hurricane (SSHWS) | |
  | |
| Duration | October 6 – October 13 |
|---|---|
| Peak intensity | 125 mph (205 km/h) (1-min) 955 mbar (hPa) |
During the late hours of October 4, an area of showers and thunderstorms associated with a broad low-pressure area developed several hundred miles to the south-southwest of Acapulco, Mexico. Moving slowly towards the west, the area of disturbed weather quickly organized. Late on October 5, the National Hurricane Center (NHC) noted that the area had a high chance of developing into a tropical cyclone over the next 48 hours. Just several hours later, the NHC began issuing advisories on Tropical Depression Ten-E, several hundred miles to the south of Manzanillo, Mexico. A more gradual type of development took place after then, and the depression was upgraded into Tropical Storm Jova on the afternoon of October 6. Taking advantage of the favorable environment Jova was embedded within, the storm became a hurricane on October 8, and by October 10, the storm was upgraded to a Category 3 hurricane on the Saffir–Simpson hurricane scale. However, shortly thereafter, the storm began an eyewall replacement cycle and weakened to a lower-end Category 2 hurricane. Several hours after landfall in Mexico, Jova dissipated, very early on October 13.[59]
Hurricane Irwin[]
| Category 2 hurricane (SSHWS) | |
  | |
| Duration | October 6 – October 16 |
|---|---|
| Peak intensity | 100 mph (155 km/h) (1-min) 976 mbar (hPa) |
The origins of Hurricane Irwin can be tracked back to an area of showers and thunderstorms associated with a low-pressure area that developed several hundred miles to the south of Mexico. Moving towards the west and west-northwest, the low pressure quickly gained organization, and during the pre-dawn hours of October 6, the National Hurricane Center began issuing advisories on newly formed Tropical Depression Eleven-E. Later on October 6, Tropical Depression Eleven-E strengthened to Tropical Storm Irwin, and it became a hurricane the next day. The next day it weakened to a tropical storm. Unlike most tropical cyclones that form in the eastern Pacific Ocean, Irwin's track was very unusual. The system which originally started moving westward, turned north, then east and again back south, and east until dissipation, on October 17, as a remnant low. Also, between October 11 and 14, Irwin weakened into a tropical depression twice and again re-strengthened back to a tropical storm before finally weakening into a tropical depression on October 15. The depression turned west again and dissipated into a remnant low in the late hours of October 16. But the remnants of Tropical Storm Irwin continued to move westward generally, until it dissipated completely, on October 17.[60]
Tropical Depression Twelve-E[]
| Tropical depression (SSHWS) | |
  | |
| Duration | October 12 – October 12 |
|---|---|
| Peak intensity | 35 mph (55 km/h) (1-min) 1004 mbar (hPa) |
A tropical wave, the same that spawned Hurricane Phillipe in the Atlantic, crossed Central America into the East Pacific on October 5, during a significant pulse of the MJO. In this favorable environment, the wave generated a low-pressure area in the ITCZ by 18:00 UTC on October 6. Despite initially being hindered by the development of easterly wind shear, the low produced sustain deep convection late on October 11, and organized sufficiently to become Tropical Depression Twelve-E by 00:00 UTC on October 12. The depression moved northward without strengthening and made landfall at 16:00 UTC that day near Paredón, Mexico. The depression rapidly weakened to a remnant low eight hours later and dissipated completely early the next day.
The depression brought torrential rains that caused severe flooding in southeast Mexico and neighboring Guatemala. Up to 12 inches (305 mm) of rain fell in Guatemala, though not all of it may be because of Twelve-E. 36 deaths were directly attributed to the depression by the government of Guatemala. Numerous additional fatalities resulted in Central America from the pulse of the MJO that helped spawn the depression.[61]
Hurricane Kenneth[]
| Category 4 hurricane (SSHWS) | |
  | |
| Duration | November 19 – November 25 |
|---|---|
| Peak intensity | 145 mph (230 km/h) (1-min) 940 mbar (hPa) |
Kenneth originated from an area full of unsettled weather that developed off the coast of Guatemala on November 16.[62] A low-pressure area formed shortly thereafter,[63] and organization of the system began to improve on November 17 as it moved westward.[64] The low remained over an area with favorable conditions for formation on November 18,[65] although convective activity tapered slightly later during the day as it began to curve west-northwestward.[66] The system continued to coalesce overnight,[67] and the circulation of the low was more prominent by the following morning.[68] By November 19, the disturbance had gained enough organization to be declared as a tropical depression, the thirteenth of the season. The following day, the depression continued to intensify, and was upgraded to a tropical storm, receiving the name Kenneth.[69] Rapid strengthening began on November 21, and Kenneth was upgraded to a hurricane.[70] As rapid intensification continued, Kenneth strengthened into a Category 3 major hurricane with sustained winds of 125 mph on November 22.[71] Rapid intensification continued and the storm was upgraded to a Category 4 hurricane with sustained winds of 145 mph, just a few hours later, as Kenneth reached its peak intensity.[72] The cause for this rapid intensification just days before the end of the season was unclimatologically low wind shear as well as unusually warm waters directly in the storm's path. However, Kenneth's intensification was short-lived; immediately it moved into an environment of colder waters and stronger wind shear, and started to rapidly deteriorate. Just 24 hours after the cyclone reached its peak, it dropped below hurricane strength and lost most of its central convection. Afterwards, Kenneth weakened at a slower rate, but by November 25, had weakened to a tropical depression, losing almost all of its convection. Early on November 25, Kenneth weakened to a remnant low, with its circulation void of any strong convection. But for the next 3 days, the remnant of the storm continued moving northwestward rapidly as a convectionless vortex, before dissipating completely early on November 28.[73]
In the first discussion bulletin, Forecaster Robbie Berg commented that it was the latest-forming tropical cyclone in the North Pacific east of 140°W since Tropical Depression Twenty-Two-E on November 24, 1987,[74] and Kenneth was the latest forming named storm since Winnie in 1983.[75] Kenneth strengthened to a major hurricane on November 22, becoming the latest-forming major hurricane in the eastern north Pacific basin in the satellite era.[76] Kenneth was upgraded to Category 4 a few hours later, becoming the most powerful late-season storm ever recorded in the eastern north Pacific.[77] However, 2015's Hurricane Sandra surpassed both records when it attained major hurricane status much later than Kenneth, being upgraded to a Category 4 on November 26, 2015.
Storm names[]
The following names were used for named storms that formed in the North East Pacific in 2011. Names that were not used are marked in gray. This is the same list used in the 2005 season. No names were retired this year, so this list was used again in the 2017 season.[78]
|
|
For storms that form in the Central Pacific Hurricane Center's area of responsibility, encompassing the area between 140 degrees west and the International Date Line, all names are used in a series of four rotating lists. The next four names that were slated for use in 2011 are shown below; however, none of them were used.
|
|
|
|
Season effects[]
This is a table of all of the storms in the 2011 Pacific hurricane season. It includes their durations, peak intensities, names, landfall(s), damages, and death totals. Deaths in parentheses are additional and indirect (an example of an indirect death would be a traffic accident), but are still storm-related. Damage and deaths include totals while the storm was extratropical or a wave or a low. All of the damage figures are in 2011 USD.
| Saffir–Simpson scale | ||||||
| TD | TS | C1 | C2 | C3 | C4 | C5 |
| Storm name |
Dates active | Storm category
at peak intensity |
Max 1-min wind mph (km/h) |
Min. press. (mbar) |
Areas affected | Damage (USD) |
Deaths | Ref(s)
| ||
|---|---|---|---|---|---|---|---|---|---|---|
| Adrian | June 7–12 | Category 4 hurricane | 140 (220) | 944 | Southwestern Mexico | Minimal | 0 | |||
| Beatriz | June 19–22 | Category 1 hurricane | 90 (150) | 977 | Southwestern Mexico, Western Mexico | Minimal | 4 | |||
| Calvin | July 7–10 | Category 1 hurricane | 80 (130) | 984 | None | None | 0 | |||
| Dora | July 18–24 | Category 4 hurricane | 155 (250) | 929 | Southwestern Mexico, Western Mexico, Baja California Peninsula, Southwestern United States | Minimal | 0 | |||
| Eugene | July 31 – August 6 | Category 4 hurricane | 140 (220) | 942 | None | None | 0 | |||
| Fernanda | August 15–19 | Tropical storm | 70 (110) | 992 | None | None | 0 | |||
| Greg | August 16–21 | Category 1 hurricane | 85 (140) | 979 | None | None | 0 | |||
| Eight-E | August 31 – September 1 | Tropical depression | 35 (55) | 1002 | Southwestern Mexico, Western Mexico | None | 0 | |||
| Hilary | September 21–30 | Category 4 hurricane | 145 (230) | 942 | Southwestern Mexico | Minimal | 0 | |||
| Jova | October 6–13 | Category 3 hurricane | 125 (205) | 955 | Southwestern Mexico, Western Mexico | ≥$204 million | 9 | |||
| Irwin | October 6–16 | Category 2 hurricane | 100 (155) | 976 | Western Mexico | None | 0 | |||
| Twelve-E | October 12 | Tropical depression | 35 (55) | 1004 | Southwestern Mexico, Central America | Unknown | 36 | |||
| Kenneth | November 19–25 | Category 4 hurricane | 145 (230) | 940 | None | None | 0 | |||
| Season aggregates | ||||||||||
| 13 systems | June 7 – November 25 | 155 (250) | 929 | ≥$204 million | 49 | |||||
See also[]
- Tropical cyclones in 2011
- List of Pacific hurricanes
- Pacific hurricane season
- 2011 Atlantic hurricane season
- 2011 Pacific typhoon season
- 2011 North Indian Ocean cyclone season
- South-West Indian Ocean cyclone seasons: 2010–11, 2011–12
- Australian region cyclone seasons: 2010–11, 2011–12
- South Pacific cyclone seasons: 2010–11, 2011–12
- South Atlantic tropical cyclone
Notes[]
- ^ The totals represent the sum of the squares for every (sub)tropical storm's intensity of over 33 knots (38 mph, 61 km/h), divided by 10,000. Calculations are provided at Talk:2011 Pacific hurricane season/ACE calcs.
References[]
- ^ Unattributed (May 19, 2011). "Background Information: East Pacific Hurricane Season". Climate Prediction Center. National Oceanic and Atmospheric Administration. Archived from the original on July 31, 2011. Retrieved July 31, 2011.
- ^ a b Climate Prediction Center (May 19, 2011). "NOAA predicts below normal Eastern Pacific hurricane season". National Oceanic and Atmospheric Administration. Archived from the original on June 6, 2011. Retrieved June 9, 2011.
- ^ "NOAA: 2011 Eastern Pacific Hurricane Season Outlook". Climate Prediction Center. Archived from the original on June 6, 2011. Retrieved June 9, 2011.
- ^ Blake, Eric (June 5, 2011). "Graphical Tropical Weather Outlook". National Hurricane Center. Retrieved 2011-06-07.
- ^ Cangialosi, John (June 7, 2011). "Tropical Depression One-E Discussion Number One". National Hurricane Center. Retrieved 2011-06-07.
- ^ Blake, Eric (June 7, 2011). "Tropical Storm Adrian Discussion Number Three". National Hurricane Center. Retrieved 2011-06-08.
- ^ Blake, Eric (June 9, 2011). "Hurricane Adrian Discussion Number Seven". National Hurricane Center. Retrieved 9 June 2011.
- ^ Avila, Lixion A. (June 9, 2011). "Hurricane Adrian Discussion Number Nine". National Hurricane Center. Retrieved 2011-06-09.
- ^ Stewart, Stacy (June 9, 2011). "Hurricane Adrian Discussion Number Eleven". National Hurricane Center. Retrieved 2011-06-10.
- ^ Avila, Lixion A. (June 9, 2011). "Hurricane Adrian Discussion Number Ten". National Hurricane Center. Retrieved 2011-06-09.
- ^ Landsea, Chris; Avila, Lixion A. (June 11, 2011). "Tropical Storm Adrian Discussion Number Seventeen". National Hurricane Center. Retrieved 2011-06-11.
- ^ Avila, Lixion A. (June 11, 2011). "Tropical Storm Adrian Discussion Number Eighteen". National Hurricane Center. Retrieved 2011-06-11.
- ^ Cangialosi, John (June 12, 2011). "Tropical Depression Adrian Advisory Number 20". National Hurricane Center. Retrieved 2011-06-12.
- ^ Kimberlain, Todd (June 12, 2011). "Post-tropical Cyclone Adrian Discussion Number 21". National Hurricane Center. Retrieved 2011-06-12.
- ^ http://smn.cna.gob.mx/ciclones/tempo2011/pacifico/adrian1-p11.pdf[permanent dead link]
- ^ Berg, Robbie (June 14, 2011). "NHC Graphical Outlook Archive". National Hurricane Center. Retrieved June 19, 2011.
- ^ Berg, Robbie (June 17, 2011). "NHC Graphical Outlook Archive". National Hurricane Center. Retrieved June 19, 2011.
- ^ Brennan, Michael (June 19, 2011). "Tropical Depression TWO-E Discussion Number One". Retrieved June 19, 2011.
- ^ Brennan, Michael (June 19, 2011). "Tropical Storm Beatriz Public Advisory Number One". Retrieved June 19, 2011.
- ^ "NHC Graphical Outlook Archive". National Hurricane Center. Retrieved September 23, 2011.
- ^ "NHC Graphical Outlook Archive". National Hurricane Center. Retrieved September 23, 2011.
- ^ Unattributed (June 21, 2011). "Beatriz se vuelve huracán y causa daños en Acapulco" (in Spanish). La Jordana. Retrieved June 21, 2011.
- ^ Javier Trujillo (June 21, 2011). "Afectó huracán "Beatriz" más de 380 viviendas en Acapulco" (in Spanish). Milenio. Archived from the original on January 28, 2013. Retrieved October 16, 2011.
- ^ Adriana Covarrubias (June 21, 2011). "Reportan tres muertos por huracán Beatriz". El Universal (in Spanish). Retrieved October 16, 2011.
- ^ "NHC Graphical Outlook Archive (1100 AM PDT July 5, 2011)". NHC Graphical Outlook Archive. National Hurricane Center. Retrieved July 7, 2011.
- ^ "Calvin weakens to a post-tropical remnant low over the Pacific". July 10, 2010. Retrieved July 27, 2011.
- ^ "NHC Graphical Outlook Archive". National Hurricane Center. Retrieved September 23, 2011.
- ^ Beven, Jack (July 14, 2011). "Graphical Tropical Weather Outlook – 2:00 am, July 14". National Hurricane Center. Retrieved July 25, 2011.
- ^ Cangialosi, John (July 14, 2011). "Graphical Tropical Weather Outlook – 2:00 pm, July 14". National Hurricane Center. Retrieved July 25, 2011.
- ^ Stewart, Stacy (July 15, 2011). "Graphical Tropical Weather Outlook – 2:00 pm, July 15". National Hurricane Center. Retrieved July 25, 2011.
- ^ Stewart. "Tropical Depression FOUR-E Advisory Number 1". National Hurricane Center. Retrieved July 25, 2011.
- ^ Stewart. "Tropical Storm Dora Tropical Cyclone Update". National Hurricane Center. Retrieved July 25, 2011.
- ^ Brown. "Hurricane Dora Advisory Number 7". National Hurricane Center. Retrieved July 25, 2011.
- ^ Pasch. "Post-Tropical Cyclone Dora Advisory Number 26". National Hurricane Center. Retrieved July 25, 2011.
- ^ "07/25/11 1200z 04E Dora". United States Naval Research Laboratory. July 25, 2011. Retrieved July 25, 2011.
- ^ "NHC Graphical Outlook Archive". National Hurricane Center. Retrieved September 23, 2011.
- ^ "Tropical Storm Eugene Advisory 26". August 26, 2011. Archived from the original on October 6, 2011. Retrieved August 26, 2011.
- ^ Eric S. Blake (September 6, 2011). "Tropical Cyclone Report: Hurricane Eugene" (PDF). National Hurricane Center. National Oceanic and Atmospheric Administration. Retrieved September 21, 2011.
- ^ Todd B. Kimberlain (December 3, 2012). Tropical Storm Fernanda (EP062011) (PDF) (Report). Tropical Cyclone Report. National Hurricane Center. Retrieved March 14, 2021.
- ^ "Hurricane Greg". Retrieved August 16, 2011.
- ^ "Hurricane Greg strengthens a little in the Pacific". Tap Taru. Retrieved August 19, 2011.
- ^ "Tropical Depression Approaches Honduras; Hurricane Greg Weakens". Bloomberg.com. Conor Sullivan. 19 August 2011. Retrieved August 20, 2011.
- ^ Forcaster Kimberlain (August 21, 2011). "Post-Tropical Cyclone Greg Advisory Number 20". National Hurricane Center. Retrieved August 21, 2011.
- ^ "NHC Graphical Outlook Archive". Nhc.noaa.gov. Retrieved September 23, 2011.
- ^ "Archived copy". Archived from the original on 2011-10-16. Retrieved 2011-08-25.
{{cite web}}: CS1 maint: archived copy as title (link) - ^ Todd Kimberlain (August 29, 2011). "Tropical Weather Outlook". National Hurricane Center. Retrieved August 29, 2011.
- ^ Robbie Berg (August 29, 2011). "Tropical Weather Outlook". National Hurricane Center. Retrieved August 29, 2011.
- ^ "Tropical Weather Outlook". National Hurricane Center. August 31, 2011. Retrieved August 30, 2011.
- ^ "Tropical Depression One-E Discussion 1". National Hurricane Center. August 31, 2011. Retrieved August 31, 2011.
- ^ "NHC Graphical Outlook Archive". Nhc.noaa.gov. Retrieved September 23, 2011.
- ^ Brennan, Michael. "Hurricane Hilary Public Advisory #17". National Hurricane Center. Retrieved September 30, 2011.
- ^ Brennan, Michael. "Hurricane Hilary Public Advisory #23". National Hurricane Center. Retrieved September 30, 2011.
- ^ Brown, Daniel. "Tropical Storm Hilary Public Advisory #32". National Hurricane Center. Retrieved September 30, 2011.
- ^ Beven II, John L; Landsea, Christopher W; National Hurricane Center (January 20, 2012). Hurricane Hilary 2011 (PDF) (Tropical Cyclone Report). National Oceanic and Atmospheric Administration's National Weather Service. Archived (PDF) from the original on July 13, 2013. Retrieved February 16, 2015.
- ^ "Hurricane forms off Mexico's Pacific coast". Univision. September 22, 2011. Archived from the original on March 23, 2012. Retrieved September 23, 2011.
- ^ "Moderate to strong Potential occurrence of rainfall and conditions of the Hurricane "Hilary" category II". Guerro Department of Public Safety. September 22, 2011. Archived from the original on July 13, 2012. Retrieved September 23, 2011.
- ^ "'Hilary' evoluciona a huracán y manda lluvias a Tabasco" (in Spanish). Tabasco Hoy. September 22, 2011. Archived from the original on September 30, 2011. Retrieved September 23, 2011.
- ^ "Piden extremar medidas ante fortaleza de "Hilary"". El Universal Daily News (in Spanish). September 23, 2011. Retrieved September 23, 2011.
- ^ http://www.nhc.noaa.gov/data/tcr/EP102011_Jova.pdf
- ^ "NHC Graphical Outlook Archive". www.nhc.noaa.gov. Retrieved 8 April 2018.
- ^ Todd B. Kimberlain (January 5, 2012). (Report). Tropical Cyclone Report. National Hurricane Center. Retrieved March 14, 2021.
- ^ Kimberlain, Todd (2011-11-16). "Tropical Weather Outlook 1000 AM PST Wed Nov 16 2011". Miami, Florida: National Hurricane Center. Retrieved 2011-11-22.
- ^ Blake, Eric (2011-11-16). "Tropical Weather Outlook 400 PM PST Wed Nov 16 2011". Miami, Florida: National Hurricane Center. Retrieved 2011-11-22.
- ^ Blake, Eric (2011-11-17). "Tropical Weather Outlook 400 PM PST Thu Nov 17". Miami, Florida: National Hurricane Center. Retrieved 2011-11-22.
- ^ Berg, Robbie (2011-11-18). "Tropical Weather Outlook 400 AM PST Fri Nov 18 2011". Miami, Florida: National Hurricane Center. Retrieved 2011-11-22.
- ^ Berg, Robbie (2011-11-18). "Tropical Weather Outlook 1000 AM PST Fri Nov 18 2011". Miami, Florida: National Hurricane Center. Retrieved 2011-11-23.
- ^ Beven, Jack (2011-11-18). "Tropical Weather Outlook 1000 PM PST Fri Nov 18 2011". Miami, Florida: National Hurricane Center. Retrieved 2011-11-23.
- ^ Berg, Robbie (2011-11-19). "Tropical Weather Outlook 1000 AM PST Sat Nov 19". Miami, Florida: National Hurricane Center. Retrieved 2011-11-23.
- ^ "Tropical Storm KENNETH Advisory 5". National Hurricane Center. 2011-11-20. Retrieved 2015-08-08.
- ^ "Hurricane KENNETH Advisory 8". National Hurricane Center. 2011-11-21. Retrieved 2015-08-08.
- ^ "Kenneth becomes major hurricane in Pacific". KVUE.com. 2011-11-22. Retrieved 2015-08-08.[permanent dead link]
- ^ "NHC Graphical Outlook Archive". www.nhc.noaa.gov. Retrieved 8 April 2018.
- ^ "NHC Graphical Outlook Archive". www.nhc.noaa.gov. Retrieved 8 April 2018.
- ^ Berg, Robbie (November 19, 2011). "Tropical Depression Thirteen-E Forecast Discussion #1". National Hurricane Center. Retrieved November 19, 2011.
- ^ Kimberlain, Todd (November 20, 2011). "Tropical Storm Kenneth Forecast Discussion #5". National HurricaneCenter. Retrieved November 20, 2011.
- ^ Kimberlain (November 21, 2011). "Hurricane Kenneth Forecast Discussion #8". National Hurricane Center. Retrieved November 21, 2011.
- ^ Roberts/Brown (November 22, 2011). "Hurricane Kenneth Advisory #12". National Hurricane Center. Retrieved November 22, 2011.
- ^ "Worldwide Tropical Cyclone Names". National Hurricane Center. March 16, 2011. Archived from the original on December 7, 2010. Retrieved June 9, 2011.
External links[]
| Wikimedia Commons has media related to 2011 Pacific hurricane season. |

- 2011 Pacific hurricane season
- Pacific hurricane seasons
- Tropical cyclones in 2011