2018 Pacific hurricane season
| 2018 Pacific hurricane season | |
|---|---|
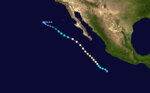
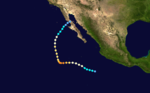
 Season summary map | |
| Seasonal boundaries | |
| First system formed | May 10, 2018 |
| Last system dissipated | November 5, 2018 |
| Strongest storm | |
| Name | Walaka |
| • Maximum winds | 160 mph (260 km/h) (1-minute sustained) |
| • Lowest pressure | 921 mbar (hPa; 27.2 inHg) |
| Seasonal statistics | |
| Total depressions | 26, 1 unofficial |
| Total storms | 23, 1 unofficial |
| Hurricanes | 13 |
| Major hurricanes (Cat. 3+) | 10 |
| Total fatalities | 56 total |
| Total damage | > $1.458 billion (2018 USD) (Fifth-costilest Pacific hurricane season on record) |
| Related articles | |
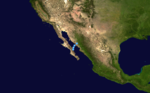
The 2018 Pacific hurricane season was one of the most active Pacific hurricane seasons on record, producing the highest accumulated cyclone energy value on record in the basin. The season had the fourth-highest number of named storms – 23, tied with 1982. The season also featured eight landfalls, six of which occurred in Mexico. The season officially began on May 15 in the Eastern Pacific, and on June 1 in the Central Pacific; they both ended on November 30. These dates conventionally delimit the period of each year when most tropical cyclones form in the Pacific basin. However, tropical cyclone formation is possible at any time of the year, as illustrated when the first tropical depression formed on May 10, five days prior to the official start of the season.
The second named storm of the season, Hurricane Bud, struck Baja California Sur in mid-June, causing minor damage. Tropical Storm Carlotta stalled offshore of the Mexican coastline, where it also caused minor damage. In early August, Hurricane Hector became one of the few tropical cyclones to cross into the Western Pacific from the Eastern Pacific, while also affecting Hawaii. Tropical Storm Ileana brought torrential rainfall to southwestern Mexico during early August, causing relatively minor damage. A few weeks later, Hurricane Lane obtained Category 5 intensity while also becoming Hawaii's wettest tropical cyclone on record and the second wettest tropical cyclone in United States history, only behind Hurricane Harvey of the previous year. Hurricane Olivia also struck Hawaii, resulting in relatively minor damage.
In late September, Hurricanes Rosa and Sergio formed, both of which eventually brought thunderstorms and flash flooding to the Baja California Peninsula and the Southwestern United States. Tropical Depression Nineteen-E became the first tropical cyclone to form in the Gulf of California before it brought severe flooding to Sinaloa, Mexico, causing significant damage. Meanwhile, Hurricane Walaka attained Category 5 intensity before causing disruptions in the Northwestern Hawaiian Islands. In late October, Hurricane Willa became the record-tying third Category 5 hurricane of the season (tied with the 1994 and 2002 seasons) before striking Sinaloa as a major hurricane, causing severe damage. Tropical Storm Vicente simultaneously affected the region just south of where Willa made landfall, causing severe flooding and dozens of landslides. Damage across the basin reached $1.46 billion (2018 USD), while 56 people were killed by the various storms.
Seasonal forecasts[]
| Record | Named storms |
Hurricanes | Major hurricanes |
Ref | |
|---|---|---|---|---|---|
| Average (1981–2010): | 15.4 | 7.6 | 3.2 | [1] | |
| Record high activity: | 1992: 27 | 2015: 16 | 2015: 11 | [2] | |
| Record low activity: | 2010: 8 | 2010: 3 | 2003: 0 | [2] | |
| Date | Source | Named storms |
Hurricanes | Major hurricanes |
Ref |
| May 24, 2018 | NOAA | 14–20 | 7–12 | 3–7 | [3] |
| May 25, 2018 | SMN | 18 | 6 | 4 | [4] |
| Area | Named storms |
Hurricanes | Major hurricanes |
Ref | |
| Actual activity: | EPAC | 22 | 12 | 9 | |
| Actual activity: | CPAC | 1 | 1 | 1 | |
| Actual activity: | 23 | 13 | 10 | ||
The National Oceanic and Atmospheric Administration (NOAA) released its annual forecast on May 24, 2018, predicting an 80% chance of a near- to above-average season in both the Eastern and Central Pacific basins, with a total of 14–20 named storms, 7–12 hurricanes, and 3–7 major hurricanes.[3] The reason for their outlook was the possible development of an El Niño, which reduces vertical wind shear across the basin and increases sea surface temperatures. In addition, many global computer models expected a positive Pacific decadal oscillation (PDO) that had been ongoing since 2014 to continue. PDO is a phase of a multi-decade cycle that favors much warmer than average sea surface temperatures, which is in contrast to the 1995–2013 period, which featured below-normal activity.[5] The Servicio Meteorológico Nacional (SMN) issued its first forecast for the season on May 25, predicting a total of 18 named storms, 6 hurricanes, and 4 major hurricanes to develop.[4]
Seasonal summary[]

| Most intense Pacific hurricane seasons | ||
|---|---|---|
| Rank | Season | ACE |
| 1 | 2018 | 317 |
| 2 | 1992 | 295 |
| 3 | 2015 | 287 |
| 4 | 1990 | 245 |
| 5 | 1978 | 207 |
| 6 | 1983 | 206 |
| 7 | 1993 | 201 |
| 8 | 2014 | 199 |
| 9 | 1984 | 193 |
| 10 | 1985 | 192 |
| Overall reference for winds used to calculate ACE:[2] | ||
The accumulated cyclone energy (ACE) index for the 2018 Pacific hurricane season was around 316 units.[6][nb 1] Broadly speaking, ACE is a measure of the power of a tropical or subtropical storm multiplied by the length of time it existed. Therefore, a stronger storm with a longer duration contributes more to the seasonal total than several short-lived, weaker storms combined.[7] 2018 had the highest total ACE of any Pacific hurricane season on record, having surpassed the 1992 Pacific hurricane season.[8]
Overall, 26 tropical depressions formed, with 23 reaching tropical storm intensity. Thirteen of the tropical storms became hurricanes, with 10 reaching major hurricane intensity.[nb 2] El Niño-like conditions prevailed across much of the basin, leading to elevated activity. Sea surface temperatures were above average for much of the season, stretching from the coast of North America to near the 150th meridian east.[10] A subpolar gyre located in the Northern Atlantic increased atmospheric convection and reduced vertical wind shear across the Eastern Pacific. Wind shear near Hawaii's Big Island decreased even more after the subtropical jet pushed northward in September. Higher levels of humidity were present between 10°N–20°N at a height of 4,781–9,882 ft (1,457–3,012 m). Storms were also kept in more favorable environments by stronger easterlies as a result of an above-normal subtropical ridge.[11][12]
The season officially began on May 15 in the Eastern Pacific, and on June 1 in the Central Pacific; they both ended on November 30.[13] The season started with the formation of Tropical Depression One-E on May 10, which was five days before the official start of hurricane season in the Eastern Pacific.[14] The month of June saw record activity, with the formation of six tropical cyclones – Aletta, Bud, Carlotta, Daniel, Emilia, and Seven-E. With five named systems, the record for most June tropical storms, which was set in 1985, was tied. Aletta and Bud both intensified into Category 4 major hurricanes, marking the first time since 2010 that two occurred in June.[15] Tropical Storm Carlotta moved along the southern coast of Mexico, causing flooding rains.[16] Activity during the month of July was below normal across the basin. Although a total of four tropical depressions formed, only two became storms – Fabio and Gilma.[17] Fabio's intensification into a tropical storm on July 1 marked the earliest date of a season's sixth named storm, beating the previous record of July 3 set in both 1984 and 1985.[18]
| Rank | Cost | Season |
|---|---|---|
| 1 | $4.56 billion | 2013 |
| 2 | $3.15 billion | 1992 |
| 3 | $1.62 billion | 2010 |
| 4 | > $1.52 billion | 2014 |
| 5 | > $1.46 billion | 2018 |
| 6 | $834 million | 1982 |
| 7 | $760 million | 1998 |
| 8 | $735 million | 1994 |
| 9 | $566 million | 2015 |
| 10 | $551 million | 1997 |
August was an above-average month for the Eastern Pacific, with a total of seven named storms occurring during the month – Hector, Ileana, John, Kristy, Lane, Miriam, and Norman.[19] Forming from a July tropical depression, Hurricane Hector spent more days as a major hurricane than any other storm in the basin.[20] It also had the highest accumulated cyclone energy since Hurricane John in 1994.[21] Around the same time, Tropical Storm Ileana paralleled the southwestern coast of Mexico, bringing heavy rainfall to the region.[22] Forming in mid-August, Hurricane Lane became the first Category 5 hurricane to form during the year.[19] Lane brought record rainfall to Hawaii's Big Island, becoming the wettest tropical cyclone for that state and the second wettest in the United States.[23][24] September saw the formation of five tropical cyclones – Olivia, Paul, Nineteen-E, Rosa, and Sergio.[25] Hurricane Olivia became the first tropical cyclone in recorded history to make landfall on the islands of Maui and Lanai on September 12.[26][27] Tropical Depression Nineteen-E formed in the Gulf of California on September 19, the first such instance in recorded history. It made landfall in Sonora on the next day, causing severe flooding.[28] Additionally, one named storm formed in the Central Pacific in September – Walaka. In October, Walaka intensified into a Category 5 hurricane in the Central Pacific – the season's second Category 5 storm.[29]
October yielded an above-average number of tropical cyclones with three named storms forming – Tara, Vicente, and Willa.[30] Sergio became the eighth system to obtain Category 4 intensity during the season, breaking the old record of seven which was set in 2015.[31] Rosa and Sergio both made landfall on the Baja California Peninsula during October, bringing gale-force winds and rain to the region before impacting western Mexico.[32][33] Willa became the season's third Category 5 hurricane before making landfall in Sinaloa, Mexico, in late October.[30] The cyclone brought strong winds to the area where it made landfall and dropped torrential rainfall throughout the region.[34] Tropical Storm Vicente caused severe flooding and landslides in western Mexico at the same time as Willa, compounding the latter's effects in some areas.[35] November featured the season's last system, Tropical Storm Xavier, which dissipated on November 6, marking the end of the season.[36]
Systems[]
Tropical Depression One-E[]
| Tropical depression (SSHWS) | |
  | |
| Duration | May 10 – May 11 |
|---|---|
| Peak intensity | 35 mph (55 km/h) (1-min) 1007 mbar (hPa) |
In early May, a disturbance formed within the Intertropical Convergence Zone (ITCZ), south of the Gulf of Tehuantepec. The system propagated westward over the next several days, spawning an area of low pressure on May 8. Convection or thunderstorm activity initially decreased, before steadily increasing and organizing around the system's center on May 10. A tropical depression formed at 12:00 UTC on the same day, while located approximately 1,265 mi (2,035 km) west-southwest of the southern tip of the Baja California Peninsula. Moderate-to-high wind shear produced by an upper-level trough located to the west prevented the depression from strengthening any further as it continued westward. By 18:00 UTC on May 11, the depression had weakened into a remnant low after losing all of its convection as a result of the increasing shear. The depression's remnants dissipated one day later while about 1,495 mi (2,410 km) west-southwest of the southern tip of Baja California.[37]
Hurricane Aletta[]
| Category 4 hurricane (SSHWS) | |
  | |
| Duration | June 6 – June 11 |
|---|---|
| Peak intensity | 140 mph (220 km/h) (1-min) 943 mbar (hPa) |
A tropical wave departed from the western coast of Africa on May 22. The wave traversed the Atlantic Ocean and Caribbean, before later crossing over Central America and entering the Pacific Ocean. Convection associated with the system increased on June 3 while it was located south of the Gulf of Tehuantepec. Over the next couple of days, the system continued to organize, with banding features becoming established. After the storm's center became demarcated, a tropical depression formed at 00:00 UTC on June 6, while located approximately 345 mi (555 km) south-southwest of Manzanillo, Mexico. At that time, the system was located within favorable environmental conditions of near-86 °F (30 °C) sea surface temperatures and very low wind shear.[38]
The depression intensified into Tropical Storm Aletta at 06:00 on June 6, and gradually strengthened over the next day before rapid intensification ensued. Aletta peaked as a Category 4 hurricane with maximum sustained winds of 140 mph (220 km/h) and a minimum central pressure of 943 mbar (27.85 inHg) at 12:00 UTC on June 8, while located about 575 mi (925 km) south-southwest of Manzanillo. Meanwhile, the hurricane was traveling north of west by the flow of a subtropical ridge, which was located over the southwestern United States. Aletta began to rapidly weaken on June 9 after it moved into a region of cooler sea surface temperatures and stable air. The system was downgraded to a remnant low at 12:00 UTC on June 11 after it lost all of its convection. Aletta's remnants were influenced by a surface flow for several days before they dissipated.[38]
Hurricane Bud[]
| Category 4 hurricane (SSHWS) | |
  | |
| Duration | June 9 – June 15 |
|---|---|
| Peak intensity | 140 mph (220 km/h) (1-min) 943 mbar (hPa) |
A tropical wave departed from the western coast of Africa on May 29 and propagated westward across the Atlantic Ocean, eventually entering the Eastern Pacific on June 6. Associated convective activity increased considerably on June 8 as the result of a nearby Kelvin wave. A low-pressure area formed the next day and continued to increase in organization, spawning a tropical depression at 18:00 UTC on June 9, about 330 mi (530 km) south of Acapulco, Mexico. At that time, the storm was moving in a west-northwest to northwest direction around a mid-level ridge that was located over Mexico. The depression quickly strengthened into Tropical Storm Bud and rapidly intensified thereafter due to warm sea surface temperatures and abundant mid-level moisture. Bud became a hurricane at 18:00 UTC on June 10 and a Category 3 major hurricane by 12:00 UTC on June 11. The cyclone ultimately peaked as a Category 4 hurricane with winds of 140 mph (220 km/h) and a pressure of 943 mbar (27.85 inHg) around 00:00 UTC on June 12, while located approximately 200 mi (320 km) southwest of Manzanillo, Mexico.[39]
After Bud's peak intensity, the hurricane rapidly weakened back to a tropical storm. Moderately warm sea surface temperatures allowed Bud to maintain some of its strength, although its structure degraded as it approached Baja California Sur. Bud made landfall near San José del Cabo around 02:00 UTC on June 15, with winds of 45 miles per hour (75 km/h). Increasing wind shear and the mountainous terrain of Baja California Sur caused Bud to weaken into a post-tropical cyclone by 12:00 UTC. The circulation opened up into a trough about 12 hours later, located around 35 mi (55 km) southwest of .[39]
Hurricane Bud prompted the issuance of tropical cyclone watches and warnings along Baja California Sur and the northwestern coast of Mexico.[39] Strong wind gusts were recorded in Baja California,[40] causing minimal damage.[41] Despite remaining offshore for most of its track, the hurricane caused torrential rainfall and severe flooding in several regions. A peak rainfall total of 6.50 in (165 mm) was recorded in San Lorenzo, Sinaloa.[42] In Guadalajara, Jalisco, hundreds of vehicles were inundated and swept away.[43] A canal overflowed in Guadalajara, causing damage to multiple stores in a mall.[44] At least 100 additional structures were damaged in the city.[45] In Guerrero, hundreds of businesses and homes were flooded.[46] Over 100 businesses in Pie de la Cuesta were damaged by strong waves.[47] More than 60 homes in Maruata, Michoacán, experienced flood or wind damage. Heavy rainfall from Bud generated currents that swept away a child who was crossing a road in Mexico City.[48] The remnants of Bud brought moisture to drought-stricken regions of the Southwestern United States, and slowed the advance of wildfires in Colorado and Wyoming.[49][50][51]
Tropical Storm Carlotta[]
| Tropical storm (SSHWS) | |
  | |
| Duration | June 14 – June 18 |
|---|---|
| Peak intensity | 65 mph (100 km/h) (1-min) 997 mbar (hPa) |
A low-pressure area developed on June 12 south of the Gulf of Tehuantepec. Two days later, the system's convection organized enough for the low to be classified as a tropical depression approximately 140 mi (225 km) south of Acapulco, Mexico. The nascent depression tracked north-northeastward toward the Mexican coast. Wind shear prevented strengthening initially, but the depression became Tropical Storm Carlotta around 18:00 UTC on June 15. The storm temporarily stalled on June 16 just off the coast of Acapulco. At 00:00 UTC on June 17, Carlotta reached its peak intensity with winds of 65 mph (100 km/h) and a pressure of 997 mbar (29.44 inHg). Land interaction, dry air, and increasing wind shear caused the storm to weaken as it progressed to the west-northwest. Carlotta weakened to a tropical depression late on June 17, and deteriorated into a remnant low by early on June 19. The system dissipated offshore between Manzanillo and Zihuatanejo, Mexico shortly after.[16]
Tropical Storm Carlotta warranted the issuance of tropical storm watches and warnings along the southern coast of Mexico.[16] Carlotta caused severe flooding in the states of Aguascalientes, Guerrero, Michoacán, Oaxaca, and Puebla, as well as the Yucatán Peninsula; the storm also killed a total of three people.[52][53][54] A peak rainfall total of 11.2 in (285 mm) was recorded in Melchor Ocampo, Michoacán.[55] Carlotta and two other systems dropped 3–20 in (70–400 mm) of rain across the Yucatán Peninsula, resulting in severe flooding.[56] In Oaxaca, dwellings, a hospital, utilities, and roads and bridges sustained wind and flood damage.[57][58][59] Multiple rivers overflowed their banks in Michoacán, flooding several homes and damaging water pumps.[60][61][62] Carlotta also caused several landslides throughout the state.[61] Insurance claims related to the storm reached US$7.6 million (MX$156 million) statewide.[63] Another 12 houses were flooded in Aguascalientes.[53]
Tropical Storm Daniel[]
| Tropical storm (SSHWS) | |
  | |
| Duration | June 24 – June 26 |
|---|---|
| Peak intensity | 45 mph (75 km/h) (1-min) 1004 mbar (hPa) |
The dissipating Tropical Storm Carlotta dragged a part of the ITCZ northward. This resulted in the formation of an area of thunderstorms on June 18, and after a tropical wave entered the region, a weak low-pressure area developed on June 21. The disturbance improved in organization over the next couple of days, forming a tropical depression on June 24 at 00:00 UTC, approximately 725 mi (1,165 km) south-southwest of the southern tip of the Baja California peninsula. Throughout the day, the storm was propelled northward by a mid- to upper-level low that was located to the west. Around 12:00 UTC, the depression strengthened into Tropical Storm Daniel as a result of warm sea surface temperatures and low wind shear. The cyclone peaked six hours later with 45 mph (75 km/h) winds and a pressure of 1,004 mbar (29.65 inHg). It maintained this intensity for twelve hours before succumbing to decreasing sea temperatures as it traveled northwestward. The convection of the storm completely dissipated, resulting in it becoming a remnant low around 06:00 UTC on June 26, while about 615 mi (990 km) west-southwest of the southern tip of the Baja California peninsula. The remnants of the storm journeyed south of west under the influence of the low-level trade winds, before later opening up into a trough on June 28.[64]
Tropical Storm Emilia[]
| Tropical storm (SSHWS) | |
  | |
| Duration | June 27 – July 1 |
|---|---|
| Peak intensity | 60 mph (95 km/h) (1-min) 997 mbar (hPa) |
A well-defined tropical wave departed from the western coast of Africa during the middle of June 14. It moved across the Atlantic Ocean without development, and the wave entered the Pacific Ocean on June 24. There, its convection increased as it interacted with the Pacific monsoon trough. The system continued to organize over the next couple of days as it moved north of west, developing into a tropical depression on June 27 at 18:00 UTC, while about 470 mi (755 km) southwest of Manzanillo, Mexico. The depression slowly intensified, becoming Tropical Storm Emilia around 12:00 UTC on June 28. Despite moderate wind shear, Emilia attained peak winds of 60 mph (95 km/h) on June 29 about 600 mi (965 km) southwest of the southern tip of the Baja California peninsula. The storm briefly maintained this intensity before a combination of shear, mid-level dry air, and cooling sea surface temperatures caused it to weaken. By 12:00 UTC on June 30, Emila had weakened into a tropical depression. The system decayed into a remnant low by 00:00 UTC on July 2 as it continued west-northwest. The remnants of Emilia dissipated around 54 hours later while over 1,495 mi (2,410 km) west of Baja California.[65]
Hurricane Fabio[]
| Category 2 hurricane (SSHWS) | |
  | |
| Duration | June 30 – July 6 |
|---|---|
| Peak intensity | 110 mph (175 km/h) (1-min) 964 mbar (hPa) |
A tropical wave emerged from the western coast of Africa on June 16, and ten days later it crossed Central America into the Eastern Pacific Ocean. Convection increased markedly thereafter as the wave continued westward for the next couple of days, developing a low-pressure area on June 28. A tropical depression developed at 18:00 UTC on June 30, while approximately 575 mi (925 km) south of Manzanillo, Mexico. A mid-level ridge located over central Mexico steered the nascent depression towards the west-northwest as the storm continued to intensify. The depression strengthened into Tropical Storm Fabio around 06:00 UTC on July 1. Located within a favorable environment of warm sea surface temperatures, moist air, and low wind shear, Fabio continued to consolidate over the next couple of days. Fabio became a Category 1 hurricane around 12:00 UTC on July 2. The storm peaked at 18:00 UTC on the next day as a high-end Category 2 hurricane with winds of 110 mph (175 km/h) and a pressure of 964 mbar (28.47 inHg), while located 645 mi (1,035 km) southwest of the southern tip of the Baja California peninsula.[66]
After 12 hours at peak intensity, Fabio began to decay as a result of having tracked into a region of cooler, sub-79 °F (26 °C) sea surface temperatures;[67] the storm later rapidly weakened as it moved over sea surface temperatures near or below 68 °F (20 °C).[66][68] The hurricane weakened into a tropical storm around 06:00 UTC on July 4, while about 920 mi (1,480 km) west-southwest of the southern tip of the Baja California peninsula. Fabio's convection degraded significantly as it entered a more stable environment; it weakened into a post-tropical cyclone by 06:00 UTC on July 6. The remnants continued towards the west-northwest and dissipated by 12:00 UTC on July 9, located approximately 1,840 mi (2,965 km) west-northwest of the southern tip of the Baja California peninsula.[66]
Tropical Storm Gilma[]
| Tropical storm (SSHWS) | |
  | |
| Duration | July 26 – July 29 |
|---|---|
| Peak intensity | 45 mph (75 km/h) (1-min) 1005 mbar (hPa) |
A tropical wave exited the western coast of Africa on July 13, and moved across the Atlantic, eventually entering the Pacific Ocean on July 22. Over the next couple of days, the wave continued westward with its convection pulsing intermittently. The low-level center and the convection organized into a tropical depression by 12:00 UTC on July 26, approximately 1,035 mi (1,665 km) southwest of the southern tip of the Baja California peninsula. Over the next 12 hours, the nascent depression traveled northwest along the south-southwestern edge of a mid-level ridge while intensifying; the system became Tropical Storm Gilma six hours after formation. Gilma reached its peak intensity of 45 mph (75 km/h) winds and a pressure of 1,005 mbar (29.68 inHg) at 06:00 UTC on July 27, while located 1,210 mi (1,945 km) west-southwest of the southern tip of the Baja California peninsula. The tropical storm began to succumb to increasing northwesterly wind shear soon after, resulting in the degradation of its convection; Gilma weakened into a tropical depression by 18:00 UTC on the same day. The depression had limited thunderstorm activity over the next couple of days before weakening into a remnant low around 12:00 UTC on July 29. The remnants crossed into the Central Pacific basin and dissipated two days later, around 405 mi (650 km) southeast of Hilo, Hawaii.[69]
Tropical Depression Nine-E[]
| Tropical depression (SSHWS) | |
  | |
| Duration | July 26 – July 27 |
|---|---|
| Peak intensity | 35 mph (55 km/h) (1-min) 1007 mbar (hPa) |
A passing Kelvin wave and a tropical wave increased convection within the ITCZ; after this increase, a low-pressure trough spawned within the monsoon trough on July 21, approximately 635 mi (1,020 km) south-southwest of Manzanillo, Mexico. Over the next several days, the system moved westward while experiencing northeasterly wind shear, which was imparted by an upper-level trough. The aforementioned combined with a moderately dry environment prevented the low-pressure trough from organizing further. The system generated some convection on July 23, but increasing wind shear prevented significant organization until July 26. The system reached a col or neutral point between the upper-level trough to the east and an upper-level ridge to the west. This allowed a tropical depression to form around 18:00 UTC on that day, approximately 1,440 mi (2,315 km) east-southeast of Hilo, Hawaii. The depression's convection was quickly removed to the south and west of its center as it entered a region of higher wind shear. This caused the depression to decay into a trough of low-pressure by 00:00 UTC on July 28, located about 1,210 mi (1,945 km) southeast of Hilo, Hawaii. The remnants produced sporadic convection as they continued westward over the Central Pacific during the next few days before dissipating.[70]
Hurricane Hector[]
| Category 4 hurricane (SSHWS) | |
  | |
| Duration | July 31 – August 13 (Exited basin) |
|---|---|
| Peak intensity | 155 mph (250 km/h) (1-min) 936 mbar (hPa) |
A disturbance began generating thunderstorms as it traveled across northern South America. The system entered the Eastern Pacific Ocean on July 25, and a low-pressure trough formed on the next day to the south of Central America and Mexico. The trough moved westward for several days before a passing Kelvin wave improved the environment; this allowed the trough's convection to gradually become more organized. A tropical depression spawned by 12:00 UTC on July 31, about 805 mi (1,295 km) south-southwest of the southern tip of the Baja California peninsula. The depression strengthened into Tropical Storm Hector about 12 hours later, at 00:00 UTC on August 1.[71]
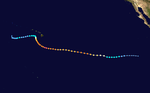
Hector was steered westward during the next several days. The storm was located over warm sea surface temperatures, fueling a 30-hour period of rapid intensification. Hector reached its initial peak on August 2 at 18:00 UTC as a 105 mph (165 km/h) Category 2 hurricane. Shortly after, northerly shear abraded the northern eyewall of the hurricane before intensification resumed later on August 3. While about 1,680 mi (2,705 km) west-southwest of the southern tip of the Baja California peninsula, Hector became a Category 3 major hurricane around 00:00 UTC on August 4. After entering the Central Pacific Ocean, Hector tracked west-northwest. Hector peaked on August 6 at 18:00 UTC as a high-end Category 4 hurricane with winds of 155 mph (250 km/h) and a pressure of 936 mbar (27.64 inHg). The storm's movement gradually shifted westward over the next few days. During this time, lower sea surface temperatures and ocean heat content as well as mid-level dry air caused Hector to gradually weaken into a low-end Category 3 storm. The storm began to intensify again on the next day as a result of improving environmental conditions. Hector reached its secondary peak as a 140 mph (220 km/h) Category 4 hurricane at 18:00 UTC on August 10. Afterward, Hector tracked towards the west-northwest and later northwest. Southerly shear imparted by an upper-level low caused gradual weakening over the next few days. Hector weakened into a tropical storm around 00:00 UTC on August 13. The storm crossed the International Date Line over 12 hours later, entering the western Pacific Ocean.[71]
Hector approached several islands on its journey through the Central Pacific Ocean, prompting the issuance of tropical storm watches and warnings for islands in Papahānaumokuākea Marine National Monument as well as Johnston Atoll. Overall, the impact to land was minimal;[71] high surf was reported along the southern shores of Hawaii's Big Island and several dozen people were rescued on Oahu.[72][73] During Hector's track across the Eastern Pacific, it spent more consecutive days as a major hurricane than any other storm.[20]
Tropical Storm Ileana[]
| Tropical storm (SSHWS) | |
  | |
| Duration | August 4 – August 7 |
|---|---|
| Peak intensity | 65 mph (100 km/h) (1-min) 998 mbar (hPa) |
A tropical wave left the western coast of Africa on July 26 with minimal convection. The wave moved across the tropics and the Caribbean Sea before traversing Central America and entering the Eastern Pacific Ocean on August 4. Despite its close proximity to the larger disturbance which later became Hurricane John, the system rapidly organized into a tropical depression by 18:00 UTC, 230 mi (370 km) south-southeast of Puerto Ángel, Mexico. The larger disturbance imparted northwesterly wind shear, uncovering the low-level center and preventing further intensification for multiple hours. Despite the shear, a central dense overcast soon developed near the depression's center. The system was upgraded into Tropical Storm Ileana around 12:00 UTC on August 5. Warm sea surface temperatures allowed Ileana to strengthen further as it tracked west-northwest, just off the southwestern coast of Mexico. Ileana reached its peak intensity at 12:00 UTC on August 6 with winds of 65 miles per hour (105 km/h) and a pressure of 998 mbar (29.47 inHg), while located 115 mi (185 km) southwest of Acapulco. A combination of disruption from Hurricane John located to the west, as well as the Sierra Madre mountains, caused the storm's structure to decay over the next day. Ileana was absorbed into John's outer bands around 12:00 UTC on August 7, just off the coast from Cabo Corrientes, Mexico.[22]
Tropical Storm Ileana's close proximity to the Mexican coast prompted the issuance of tropical cyclone watches and warnings.[22] Ileana impacted multiple states, causing damaging floods and eight deaths. The storm caused flooding, which inundated houses and streets, as well as power outages in the state of Guerrero.[74][75] Ileana left a total of four people dead in the state.[76][77] In the nearby state of Oaxaca, rainfall peaking at 7.72 in (196 mm) caused a landslide that destroyed a house.[78][79] Another four individuals were killed within the state of Chiapas.[80] The cyclone caused US$737,000 (MX$13.6 million) in damage to roads in Michoacán.[81]
Hurricane John[]
| Category 2 hurricane (SSHWS) | |
  | |
| Duration | August 5 – August 10 |
|---|---|
| Peak intensity | 110 mph (175 km/h) (1-min) 964 mbar (hPa) |
An enervated tropical wave departed from the western coast of Africa on July 25. It then traveled westward across the tropical Atlantic, with most of its convection located within the ITCZ until it arrived at South America on July 30. The wave entered the Eastern Pacific two days later and convection drastically increased as a result of the active portion of the Madden–Julian oscillation. An area of low pressure formed on August 4 and became more organized over the day. A tropical depression formed around 12:00 UTC on August 5, about 335 mi (540 km) south-southwest of Manzanillo, Mexico. The depression then strengthened into Tropical Storm John about 12 hours later as it traveled along the edge of a mid-level ridge, which was located over Mexico. A period of rapid intensification ensued as a result of John being located in a favorable environment of low wind shear, warm sea surface temperatures, and a high quantity of mid-level moisture. John peaked on August 7 at 18:00 UTC as a Category 2 hurricane with winds of 110 mph (175 km/h) and a pressure of 964 mbar (28.47 inHg), while it approached Socorro Island.[82]
A combination of increasing northwesterly wind shear and cooling sea surface temperatures caused John to fall below hurricane strength on August 9. Convection quickly dissipated near the center of the cyclone, causing it to be downgraded to a post-tropical system by 12:00 UTC on August 10, approximately 345 mi (555 km) west-southwest of Punta Eugenia, Mexico. The remnants continued northwestward and later eastward, before opening into a trough of low-pressure around 18:00 UTC on August 13, about 405 mi (650 km) west of Punta Eugenia.[82] Although John never made landfall, it produced high surf along the coastlines of Baja California Sur and Southern California.[83]
Tropical Storm Kristy[]
| Tropical storm (SSHWS) | |
  | |
| Duration | August 6 – August 12 |
|---|---|
| Peak intensity | 70 mph (110 km/h) (1-min) 991 mbar (hPa) |
A tropical wave departed from the western coast of Africa on July 22 and traveled quickly across the Atlantic Ocean and the Caribbean Sea. The wave remained without convection until it entered the Caribbean Sea and moved over South America from July 27–29. Convection began to increase overland before the wave crossed into the Eastern Pacific on July 29–30. Continuing westward, the system slowly organized over the next several days, exhibiting intermittent convection and improving cloud cover. Deep convection increased near the system's center on August 6, resulting in the formation of a tropical depression by 18:00 UTC. The depression strengthened into Tropical Storm Kristy six hours later, approximately 1,035 mi (1,665 km) west-southwest of the southern tip of the Baja California peninsula. During August 7, Kristy became embedded within deep-layer easterlies affiliated with a subtropical ridge which was located to the northeast; this steered the storm westward. The storm continued to increase in organization because it was located within a favorable environment of warm sea surface temperatures and low wind shear. An upper-level low located to the northwest imparted northwesterly wind shear and dry air, causing Kristy to weaken slightly late on August 7.[84]
Hurricane John eroded the subtropical ridge on August 8, causing Kristy to track towards the northwest. The storm resumed strengthening on the same day as wind shear decreased. Kristy peaked on August 10 at 06:00 UTC with 70 mph (110 km/h) winds and a pressure of 991 mbar (29.26 inHg). The cyclone maintained this intensity for around 12 hours before wind shear increased once more and sea surface temperatures cooled. This caused Kristy to rapidly weaken to a tropical depression by 12:00 UTC on August 11. While the storm lost most of its convection as it weakened, it still produced bursts of convection. Kristy was downgraded to a remnant low on August 12 at 12:00 UTC after having been devoid of convection. The remnants then traveled westward as a swirl of low-level clouds before dissipating on August 13.[84]
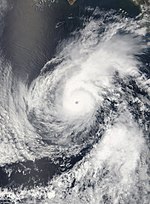
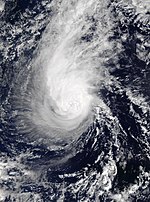
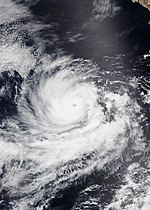
Hurricane Lane[]
| Category 5 hurricane (SSHWS) | |
  | |
| Duration | August 15 – August 28 |
|---|---|
| Peak intensity | 160 mph (260 km/h) (1-min) 926 mbar (hPa) |
A tropical wave departed from the western coast of Africa on July 31 and traveled westward across the Atlantic Ocean with limited thunderstorm activity. The wave entered the Pacific Ocean on August 8 and became more organized by August 11, however, development was significantly impeded after convection became sporadic. A low-pressure area developed on August 13 and gained banding features as it strengthened. A tropical depression spawned around 00:00 UTC on August 15, about 1,075 mi (1,730 km) southwest of the southern tip of the Baja California peninsula. At that time, the depression was tracking west-southwest under the influence of a subtropical ridge, which was located to the north. Over the next few days, the ridge weakened, allowing for a westward and later west-northwestward movement. The depression strengthened into Tropical Storm Lane by 12:00 UTC on August 15.[85]
Soon after, a period of rapid intensification commenced as Lane entered a favorable environment of warm sea surface temperatures, low wind shear, and moist air. Lane became a hurricane by 00:00 UTC on August 17 and reached its initial peak as a 140 miles per hour (230 km/h) Category 4 major hurricane by 12:00 UTC on the next day. The cyclone began to weaken after entering the Central Pacific due to moderate southwesterly wind shear imparted by an upper-level trough located near the Hawaiian Islands. Lane continued slightly north of west after it bottomed out as a Category 3 storm on August 19. Wind shear decreased by midday August 20, allowing Lane to intensify once more. The storm peaked around 06:00 UTC on August 22 as a Category 5 hurricane with winds of 160 miles per hour (260 km/h) and a pressure of 926 mbar (27.34 inHg); this intensity made Lane the fifth storm to achieve Category 5 status in the Central Pacific in recorded history. Over the next few days, Lane weakened as it tracked north-northwest into a region of high wind shear. The cyclone moved around the western edge of a mid-level ridge, shifting its track northward; at its closest point to the state of Hawaii, Lane was about 150 mi (240 km) away from most islands. The cyclone weakened below Category 3 status early on August 24 and then rapidly weakened into a tropical storm by 06:00 UTC on August 25. The storm then turned westward, away from the Hawaiian Islands, while continuing to weaken. Lane fell to tropical depression status by 12:00 UTC on August 26, and became a tropical storm again a day later despite the shear. Lane weakened into a remnant low by 00:00 UTC on August 29, while 185 mi (300 km) north-northeast of Johnston Atoll. The remnants traveled northward and dispersed 12 hours later.[85]
Hurricane Lane warranted the issuance of tropical cyclone watches and warnings for the Hawaiian Islands as it remained in close proximity to them for multiple days. Although the core of Lane remained off-shore,[85] the hurricane dropped a record 58 in (1,473 mm) in Akaka Falls State Park on Hawaii's Big Island. This made Lane the westtest tropical cyclone on record for the state of Hawaii;[23][86] it is also second wettest in the United States, behind 2017's Hurricane Harvey.[24] Landslides on the Big Island covered highways and destroyed multiple homes. Rivers exceeded their banks, flooding homes and necessitating the rescue of 100 people.[87] The excessive rainfall caused sewer pipes to overflow, dumping 9 million US gallons (30 million liters) of raw sewage into Hilo Bay.[88] Damage on the island totaled about US$25 million.[89][90] Windgusts from the cyclone sparked wildfires in the Kauaula Valley on Maui, burning 2,800 acres (11 km2) and causing over US$4.3 million in damage.[91][92] A man drowned in a river near Koloa on Kauaʻi.[93] Overall, the total losses from Lane exceeded US$250 million.[94] President Donald Trump signed a disaster declaration on September 27 for all counties except Honolulu, allowing FEMA to provide about US$10 million in aid.[95] The Hawaii County Council used US$10 million from its budget to help repair county facilities; the cost to repair roads and bridges was estimated at US$35 million.[96]
Hurricane Miriam[]
| Category 2 hurricane (SSHWS) | |
  | |
| Duration | August 26 – September 2 |
|---|---|
| Peak intensity | 100 mph (155 km/h) (1-min) 974 mbar (hPa) |
A tropical wave departed from the western coast of Africa on August 14 and traveled westward with minimal convection. Thunderstorm activity increased by August 15–16 before dwindling as the wave encountered drier, stabler air as well as easterly wind shear. The wave moved across the southern Windward Islands, northern South America, and the southern Caribbean Sea before crossing into the Pacific Ocean on August 20. The wave then entered a favorable environment which caused convection to increase. The system gradually organized over the next several days as it tracked west-northwest. A tropical depression spawned around 06:00 UTC on August 26, approximately 1,130 mi (1,815 km) west-southwest of the southern tip of the Baja California peninsula. The depression strengthened into Tropical Storm Miriam six hours later.[97]
Embedded within a favorable environment of moist air, low wind shear, and 82 °F (28 °C) sea surface temperatures, Miriam strengthened to 65 miles per hour (105 km/h) by 12:00 UTC on August 27, while located 1,485 mi (2,390 km) west-southwest of the southern tip of the Baja California peninsula. The storm encountered moderate northwesterly wind shear after turning westward later in the day; this caused Miriam's intensification to halt. Two days later, the wind shear subsided, allowing convection to reignite around Miriam's uncovered low-level center. Miriam became a hurricane at 18:00 UTC on August 29, while around 1,035 mi (1,665 km) east-southeast of Hilo, Hawaii; the system entered the Central Pacific about six hours later. Soon after, the cyclone was forced northwestward and later northward between a mid-level ridge which was located over the southwestern United States and an upper-level trough which was located northeast of Hawaii. Miriam peaked at 18:00 UTC on August 31 as a Category 2 hurricane with winds of 100 miles per hour (160 km/h) and a pressure of 974 mbar (28.76 inHg), while 910 mi (1,465 km) east of Hilo, Hawaii. Shortly after peaking, high southwesterly wind shear and cooling sea surface temperatures caused Miriam to rapidly weaken. The cyclone fell to tropical storm status by 18:00 UTC on September 1 as its low-level center became entirely vulnerable. Wind shear increased even further, preventing the reformation of convection near the storm's center. Miriam weakened into a tropical depression by 12:00 UTC on September 2 and was downgraded to a remnant low six hours later while more than 805 mi (1,295 km) northeast of the Hawaiian Islands. The low continued northwest before opening up into a trough around 06:00 UTC on September 3.[97]
Hurricane Norman[]
| Category 4 hurricane (SSHWS) | |
  | |
| Duration | August 28 – September 8 |
|---|---|
| Peak intensity | 150 mph (240 km/h) (1-min) 937 mbar (hPa) |
A tropical wave left the western coast of Africa on August 14 and tracked westward across the tropics with little convection. The wave moved over Central America and entered the Pacific Ocean on August 22. Convection subsequently increased and became better organized over the next couple of days. An area of low-pressure developed and convection gradually became more organized. A tropical depression spawned around 12:00 UTC on August 28, at approximately 490 mi (790 km) west-southwest of Manzanillo, Mexico. The depression strengthened into Tropical Storm Norman about six hours later.[98]
The cyclone began traveling towards the west-northwest shortly after, moving along the southern edge of a subtropical ridge that extended over the Eastern Pacific Ocean. Located within a favorable environment of moist air, low wind shear, and 84–86 °F (29–30 °C) sea surface temperatures, Norman began a two-day period of rapid intensification around 18:00 UTC on August 28. The storm strengthened into a hurricane one day later. It reached its peak intensity on August 30 at 18:00 UTC as a Category 4 hurricane with winds of 150 miles per hour (240 km/h) and a pressure of 937 mbar (27.67 inHg), while 520 mi (835 km) southwest of the southern tip of the Baja California peninsula. During this time, the hurricane turned westward and later towards the west-southwest as the ridge consolidated and extended further west. Increasing northeasterly wind shear caused Norman to gradually weaken over the next couple of days. The storm fell to Category 2 status by 06:00 UTC on September 1 and maintained that intensity for around a day. Norman then began tracking west-northwestward while the wind shear relaxed, allowing for another period of rapid strengthening. Norman reached its secondary peak at 18:00 UTC on September 2 as a Category 4 hurricane with winds of 140 miles per hour (230 km/h).[98]
Soon after, the hurricane began to weaken once more as it traveled through a region of cooler sea surface temperatures. Norman crossed into the Central Pacific after 00:00 UTC on September 4 as a high-end Category 1 hurricane. The weakening trend continued as Norman tracked westward under the influence of a subtropical ridge that was located to the north and northeast; the cyclone's eye filled in with clouds. The hurricane began a third period of rapid intensification as it moved across warmer sea surface temperatures and an area of low wind shear. Norman reached its tertiary peak intensity on September 5 at 18:00 UTC as a 120 miles per hour (190 km/h) Category 3 hurricane; at that time, it possessed a well-defined eye. On the next day, declining sea surface temperatures and moderate wind shear caused Norman to weaken as it turned northwest. By 18:00 UTC on September 7, Norman had weakened into a tropical storm, while over several hundred miles northeast of the Hawaiian Islands. Wind shear further increased as the system turned northward, exposing the low-level center and prompting more weakening. Norman was downgraded to a post-tropical cyclone around 00:00 UTC on September 9. The remnants turned northeastward and dissipated on September 10 by 12:00 UTC, around 805 mi (1,295 km) north-northeast of the Hawaiian Islands.[98]
Hurricane Olivia[]
| Category 4 hurricane (SSHWS) | |
  | |
| Duration | September 1 – September 14 |
|---|---|
| Peak intensity | 130 mph (215 km/h) (1-min) 951 mbar (hPa) |
A disturbance spawned over the southwestern Caribbean Sea on August 26 and tracked westward, crossing over Central America and entering the Pacific Ocean a couple of days later. Associated convection increased as the disturbance gradually organized over the next few days. A tropical depression formed by 00:00 UTC on September 1, approximately 405 mi (650 km) southwest of Manzanillo, Mexico. The nascent depression tracked west-northwestward as northeasterly shear inhibited the system from intensifying for nearly a day. Despite the shear, the system became Tropical Storm Olivia around 00:00 UTC on September 2, while it was about 520 mi (835 km) south of Cabo San Lucas, Mexico. The storm then moved northwest and strengthened gradually before the shear abated on September 3. Olivia turned towards the west and began a period of rapid intensification, reaching hurricane intensity on September 4 at 00:00 UTC, while located 575 mi (925 km) southwest of Cabo San Lucas. The cyclone reached its initial peak intensity as a high-end Category 3 hurricane by 00:00 on September 5.[99]
Soon after, increasing shear and dry air caused Olivia to weaken. The storm weakened into a minimal Category 2 hurricane before an unexpected, second period of intensification commenced on September 6. Olivia peaked at 00:00 UTC on September 7 as a Category 4 hurricane with winds of 130 miles per hour (210 km/h) and a pressure of 951 mbar (28.08 inHg), while over 1,265 mi (2,035 km) west of Cabo San Lucas. Lower sea surface temperatures and a more stable environment caused the hurricane to begin weakening before it crossed into the Central Pacific around 00:00 September 9. This trend continued until slightly higher sea surface temperatures allowed the now-minimal Category 1 hurricane to restrengthen slightly and reach a secondary peak by 00:00 UTC on September 10. After 12 hours, the cyclone began to weaken again, falling to tropical storm strength by 06:00 UTC on September 11. Olivia made landfall as a 45 miles per hour (72 km/h) tropical storm at 19:10 UTC on September 12, about 10 mi (15 km) northwest of Kahului, Maui. Just over 40 minutes later, the storm made a second landfall about 5 mi (8.0 km) north-northwest of Lanai City.[99] Olivia's two landfalls were the first time in recorded history that a tropical cyclone had made landfall on both islands.[26][27] The storm moved west-southwestward, away from the Hawaiian Islands, and weakened into a tropical depression on September 13 at 06:00 UTC. Olivia became a tropical storm once more by 18:00 UTC but failed to intensify further. Strong wind shear and disruption from its two landfalls in Hawaii caused the cyclone to become post-tropical by 06:00 UTC on September 14 and open up into a trough about 12 hours later.[99]
Olivia's approach towards the Hawaiian Islands prompted the issuance of tropical storm watches and warnings for Hawaii County, Oahu, Maui County, and Kauai County.[99] Hawaii Governor David Ige declared Hawaii, Maui, Kalawao, Kauai, and Honolulu counties disaster areas prior to Olivia's landfall in order to activate emergency disaster funds and management.[100] Olivia made brief landfalls in northwest Maui and Lanai on September 12, becoming the first tropical cyclone to impact the islands in recorded history.[26][27] Tropical-storm-force winds mainly affected Maui County and Oahu. Torrential rainfall occurred on both Maui and Oahu, peaking at 12.93 in (328 mm) in West Wailuaiki, Maui.[99] On Maui, Olivia felled trees, caused thousands of power outages, and caused severe flooding.[101] In Honokohau Valley, the Honokohau stream rose over 15 ft (4.6 m), submerging a bridge and inundating over a dozen homes. Multiple homes and vehicles were swept away by floodwaters.[102][103][104][105] Olivia left the valley without potable water for more than a week.[106] Several hundred power outages occurred on Molokai, and around 1,100 lost power in Honolulu.[103][107] A pipe overflowed from excessive rainfall on Oahu, sending raw sewage into Kapalama Stream and Honolulu Harbor.[108] President Donald Trump issued a disaster declaration for Hawaii to aid with emergency response efforts.[109] Olivia caused a total of US$25 million in damage throughout Hawaii.[94]
Tropical Storm Paul[]
| Tropical storm (SSHWS) | |
  | |
| Duration | September 8 – September 11 |
|---|---|
| Peak intensity | 45 mph (75 km/h) (1-min) 1002 mbar (hPa) |
A tropical wave departed from the western coast of Africa on August 17. It then moved westward across the Atlantic Ocean with minimal convection until it crossed over Central America, entering the Eastern Pacific Ocean. Convection began to increase during the next few days, but this trend was hampered by strong northeasterly wind shear. The system produced sporadic convection until September 8, when thunderstorm activity became continuous. A tropical depression formed around 06:00 UTC on September 8, approximately 680 mi (1,095 km) south-southwest of the southern tip of the Baja California peninsula. The system intensified into Tropical Storm Paul by 00:00 UTC on September 9. The storm traveled westward before turning northwest as it rounded the southwestern edge of a mid-level ridge, which was located over Central Mexico. Paul intensified slightly, peaking at 18:00 UTC with winds of 45 miles per hour (72 km/h) and a pressure of 1,002 mbar (29.59 inHg).[110]
By September 10, Paul began to be affected by an unfavorable environment of dry air, wind shear, and cooling sea surface temperatures. This caused the storm to weaken into a tropical depression by 06:00 UTC on September 11. The depression's convection dispersed later in the day, resulting in the system being downgraded to a remnant low around 00:00 UTC on September 12 while it was about 1,035 mi (1,665 km) west of the southern tip of the Baja California peninsula. A low-level ridge located north of the remnants caused them to return to a westward motion for a couple of days, before a high-pressure system located over the Central Pacific caused them to quickly turn southwestward. The system became elongated and dissipated by 00:00 UTC on September 15.[110]
Tropical Depression Nineteen-E[]
| Tropical depression (SSHWS) | |
  | |
| Duration | September 19 – September 20 |
|---|---|
| Peak intensity | 35 mph (55 km/h) (1-min) 1002 mbar (hPa) |
A tropical wave departed from the western coast of Africa on August 29 and traveled across the tropical Atlantic before reaching the Pacific Ocean around September 6–7. The wave then meandered south of Mexico for around a week. Around the same time, a mid-level trough, which was moving southward, sent moisture into the region. This allowed a surface trough to develop in a north to south orientation over Baja California Sur and the Gulf of California. Initially quite disorganized, thunderstorm activity gathered around a circulation center on September 19, causing a tropical depression to spawn around 12:00 UTC, just off the coast of Loreto, Mexico. This made the system the first tropical cyclone to form in the Gulf of California in recorded history. Tropical Depression Nineteen-E moved mainly northward and reached its peak intensity by 18:00 UTC with winds of 35 miles per hour (56 km/h) and a pressure of 1,002 mbar (29.59 inHg). Wind shear and land interaction inhibited further intensification before the cyclone made landfall between Guaymas and Ciudad Obregón on the Sonoran coast, around 03:00 UTC on September 20. The depression dissipated by 06:00 UTC, about 60 mi (95 km) inland.[28]
Tropical Depression Nineteen-E brought torrential rainfall to western Mexico, with a peak total of 15.06 in (382.5 mm) occurring in Ahome, Sinaloa.[111] In Nogales, Sonora, over 300 metric tons (330.7 US tons) of debris had to be cleared from roadways.[112] Floodwaters killed and swept away the bodies of two people in the state.[113] The depression directly killed five people and indirectly killed two in Sinaloa state.[114][115] Over 300,000 structures were inundated in state,[116] leaving behind hundreds of millions (USD) in flood damage.[117] The storm caused an additional US$41 million (MX$800 million) in damage after destroying 35,000 acres (14,000 hectares) of crops and associated equipment.[28] Nineteen-E also left over 500,000 livestock dead in the state.[118] The cyclone killed another three people in Chihuahua state.[119] The remnants of Nineteen-E drew moisture from the Gulf of Mexico and entered the U.S. states of Arizona, Texas, Oklahoma, and Arkansas,[120] causing US$250 million in damage.[94] The highest rainfall in the United States, 15.81 in (401.6 mm), occurred in Johnston County, Oklahoma.[120] One person was killed by flooding in the state of Texas.[121] Fonden announced that it would provide US$1.5 million (MX$33 million) for the reconstruction of Culican, Sinaloa, in 2019.[122]
Hurricane Rosa[]
| Category 4 hurricane (SSHWS) | |
  | |
| Duration | September 25 – October 2 |
|---|---|
| Peak intensity | 150 mph (240 km/h) (1-min) 936 mbar (hPa) |
A robust tropical wave departed from the western coast of Africa on September 6 and was located south of the Gulf of Tehuantepec by September 22. Upon arrival, thunderstorm activity increased significantly and the system developed a center of circulation. A tropical depression spawned at 06:00 UTC on September 25, around 405 mi (650 km) south-southwest of Manzanillo, Mexico. Despite being affected by northeasterly shear, the depression developed banding features. This increase in organization led to the depression becoming Tropical Storm Rosa around 12:00 UTC on the same day. While tracking northwest, Rosa began to develop a low-level eye feature. A period of rapid intensification ensued with Rosa becoming a hurricane at 12:00 UTC on September 26. This trend continued as Rosa turned more westward. Rosa peaked as a Category 4 hurricane on September 28 at 06:00 UTC with winds 150 miles per hour (240 km/h) and a pressure of 936 mbar (27.64 inHg). An eyewall replacement cycle began shortly after, causing a period of weakening to commence. As Rosa turned northwestward, a worsening environment aloft caused the weakening trend to continue. The cyclone was tracking northeastward by September 30 and rapidly weakened. Rosa made landfall around 11:00 UTC on October 2 as a 35 miles per hour (56 km/h) tropical depression, about 70 mi (115 km) southeast of Punta San Antonio on the Baja California Peninsula. Rosa interacted with mountainous terrain after landfall and dissipated by 18:00 UTC.[32]
Rosa warranted the issuance of tropical storm watches and warnings along the western and eastern coasts of the Baja California Peninsula.[32] Rainfall from Rosa was heaviest in Baja California, with a peak total of 6.54 in (166 mm) occurring in Percebu.[123] Flooding caused road damage and sinkholes in San Felipe, Baja California;[124] the town's port lost US$530,000 (MX$10 million) after having been closed.[125] In Sonora, thunderstorms caused power outages and flooding; the flooding swept away vehicles, left roadways impassable, damaged dozens of homes and businesses, and killed one woman.[126][127][128] In the United States, Rosa's remnants caused torrential rainfall and flooding in the Four Corners region; 6.89 in (175 mm) of rain was reported at Towers Mountain, Arizona.[129] In addition to flooding, Rosa's remnants caused power outages,[128] several dozen accidents near Phoenix,[130] and two traffic-related deaths outside Phoenix.[128] A community near Sells, Arizona had to be evacuated on October 2 after an earthen dam neared maximum capacity;[131] the dam did not breach and residents were allowed to return two weeks later.[132] Damage caused by Rosa's remnants totaled about US$50 million in the Southwestern United States.[94]
Hurricane Sergio[]
| Category 4 hurricane (SSHWS) | |
  | |
| Duration | September 29 – October 13 |
|---|---|
| Peak intensity | 140 mph (220 km/h) (1-min) 942 mbar (hPa) |
A disturbance located over South America on September 24 crossed over Central America during the next couple of days. Convection associated with the system increased, however, the system remained quite disorganized. Continual convection occurred by September 28 as the system began producing gale-force winds. A low-level center developed on September 29 and became better defined. Tropical Storm Sergio formed by 12:00 UTC on that day, around 385 mi (620 km) south of Zihuatanejo, Mexico. During its first few days, Sergio tracked westward and later towards the west-southwest. It only slowly strengthened as a result of its large size and dry air entanglement. The cyclone became a hurricane at about 00:00 UTC on October 2 after its eyewall fully closed. The storm then rapidly intensified over the next day. An eyewall replacement cycle that took place during October 3 caused the intensification to temporarily cease; Sergio began to intensify again by 18:00 UTC. Sergio peaked around 06:00 UTC on October 4 as a Category 4 hurricane with winds of 140 miles per hour (230 km/h) and a pressure of 942 mbar (27.82 inHg), while located 825 mi (1,325 km) southwest of Cabo San Lucas, Mexico.[33]
A second eyewall replacement cycle caused the cyclone to weaken into a Category 3 on October 5 before it reintensified later in the day. Sergio traveled towards the west and west-southwest throughout this period. The cyclone went through a third eyewall replacement cycle on October 8 as it tracked northeastward. Sergio acquired annular characteristics as it weakened slightly during the next couple of days. The storm then quickly weakened as it was propelled towards the Baja California Peninsula. Sergio made landfall near Los Castros, Baja California Sur around 12:00 UTC on October 12 with 50 miles per hour (80 km/h) winds. The tropical storm then emerged into and traversed the Gulf of California before making a second landfall as a tropical depression around 18:00 UTC, about 25 mi (40 km) west-northwest of Guaymas, Sonora. Sergio dissipated over mountainous terrain a few hours later.[33]
Sergio necessitated the issuance of tropical storm watches and warnings for the Baja California Peninsula.[33] Gale-force winds damaged infrastructure in Guaymas, Sonora, causing US$2.12 million (MX$40 million) in damage.[133] Rainfall from the storm peaked at 5.05 in (128 mm) in Punta de Aqua II.[134] Houses were inundated by floodwaters in the states of Sonoroa and Chihuahua, leaving behind damage.[135][136] Moisture from Sergio's remnants led to the development of thunderstorms over Texas around October 12–13.[137] Ten tornadoes spawned across the state as a result, collectively inflicting about US$445,000 in damage.[138][139][140] Strong winds and hail from the thunderstorms caused another US$30,000 in damage.[138] Sergio's remnants also caused flash flooding in the state of Arizona, dealing US$73,000 in damage.[141]
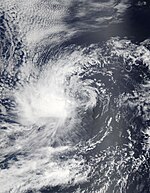
Hurricane Walaka[]
| Category 5 hurricane (SSHWS) | |
  | |
| Duration | September 29 – October 6 |
|---|---|
| Peak intensity | 160 mph (260 km/h) (1-min) 921 mbar (hPa) |
A weak surface trough entered the Central Pacific Ocean on September 26 and continued westward for the next couple of days. The system began to organize on September 29 as continual convection and banding features developed near its center. A tropical depression formed around 12:00 UTC and strengthened into Tropical Storm Walaka six hours later, while located around 690 mi (1,110 km) south of Honolulu, Hawaii. A favorable environment below the storm and aloft allowed Walaka to rapidly intensify into a hurricane by 18:00 UTC on September 30. The cyclone's eye and the surrounding clouds became well established late on October 1. Walaka peaked as a Category 5 hurricane at 00:00 UTC on October 2 with winds of 160 miles per hour (260 km/h) and a pressure of 921 mbar (27.20 inHg). This intensity made Walaka the fourth major hurricane in the Central Pacific and second Category 5 hurricane of the season.[29]
After peaking, Walaka began to undergo an eyewall replacement cycle. The cyclone weakened into a minimal Category 4 hurricane by 00:00 UTC on October 3 before briefly reintensifying later in the day. Increasing wind shear and lower sea surface temperatures caused Walaka to quickly weaken over the next couple of days, with the system falling to tropical storm strength by 06:00 UTC on October 5. Walaka transitioned into an extratropical system by 12:00 UTC on October 6 as it traveled north-northeastward. The extratropical system continued in that direction and dissipated by 18:00 UTC on October 7.[29]
Tropical cyclone watches and warnings were issued for Johnston Atoll and the Northwestern Hawaiian Islands as a result of the threat Walaka posed. The cyclone made landfall 35 mi (55 km) west-northwest of French Frigate Shoals as a high-end Category 3 hurricane around 06:20 UTC on October 4.[29] Walaka's only impact to land was that its storm surge completely destroyed East Island, wiping out the nesting grounds for the endangered green sea turtle and critically endangered Hawaiian monk seal.[142]
Tropical Storm Tara[]
| Tropical storm (SSHWS) | |
  | |
| Duration | October 14 – October 17 |
|---|---|
| Peak intensity | 65 mph (100 km/h) (1-min) 995 mbar (hPa) |
A low-level gyre located over Central America, which was also associated with the formation of Hurricane Michael in the Caribbean Sea, contributed to the genesis of Tropical Storm Tara. During the period of October 7–10, the disturbance moved into the Gulf of Tehuantepec, after which convection increased. The system then traveled west-northwest over the next several days, parallel to the western coast of Mexico. The system's convection then increased in organization, resulting in the genesis of a tropical depression at approximately 12:00 UTC on October 14, around 185 mi (300 km) southeast of Manzanillo, Mexico. The nascent depression turned from the west-northwest to the north-northwest as it tracked through a weakness in a trough located over northern Baja California and a mid-level high located over the Gulf of Mexico.[143]
Despite the presence of easterly wind shear, the system became a tropical storm around 06:00 UTC on October 15, while located about 110 mi (175 km) south-southeast of Manzanillo, Mexico. The cyclone continued to intensify and peaked at 00:00 UTC on October 16 with winds of 65 miles per hour (105 km/h) and a pressure of 995 mbar (29.38 inHg). Steering currents around Tara significantly weakened, almost halting the cyclone's forward motion. A combination of land interaction and increasing southeasterly wind shear caused weakening to commence. Tara opened into a trough just west of Manzanillo around 00:00 on October 17 and dissipated soon after.[143]
Tropical Storm Vicente[]
| Tropical storm (SSHWS) | |
  | |
| Duration | October 19 – October 23 |
|---|---|
| Peak intensity | 50 mph (85 km/h) (1-min) 1002 mbar (hPa) |
A tropical wave departed from the western coast of Africa on October 6 and traveled westward, arriving at Central America on October 16. Soon after, convection formed along the monsoon trough near the wave. Convection increased and gradually organized over the next few days. A tropical depression formed on October 19 around 06:00 UTC, around 90 mi (145 km) west-southwest of Puerto San José, Guatemala. Located within a favorable environment, the nascent depression quickly became better organized, developing banding features around its center. This led to the development of Tropical Storm Vicente by 18:00 UTC on the same day. During the course of the day, the cyclone tracked northwestward at around 6 mph (9.7 km/h), while it was also very close to the Guatemalan shore. Vicente began traveling west-northwest on October 20, just off the coast of southeastern Mexico. Vicente peaked at 18:00 UTC with winds of 50 miles per hour (80 km/h) and a pressure of 1,002 mbar (29.59 inHg), while less than 115 mi (185 km) off the Mexican coast.[35]
During the overnight, Vicente began tracking westward. Dry air intrusion caused the tropical storm to weaken on October 21 as it traveled south of west. The dry air abated on October 22, allowing for some re-intensification. Outflow from Hurricane Willa, which was located to the northwest, produced northerly wind shear, which caused Vicente to weaken to a tropical depression by 06:00 UTC on October 23. Vicente made landfall near Playa Azul in Michoacán around 13:30 UTC and dissipated by 18:00 UTC after interacting with land.[35]
Vicente brought torrential rainfall to southern Mexico, peaking at over 12 in (300 mm) in the state of Oaxaca.[144] Twenty-seven neighborhoods were flooded in Morelia, Michoacán;[145] hundreds of homes were inundated throughout several neighborhoods after flooding 3.3 ft (1 m) deep occurred.[146] Heavy rainfall caused flooding and landslides in Oaxaca, leaving 13 people dead.[147] Roadways in the state suffered severe damage after dozens of landslides occurred.[148][149][150] Flood waters swept away cars, created a sinkhole,[151] and inundated dozens of homes and businesses.[152][153] Flooding in the state of Veracruz left another three people dead.[154] Nearly two dozen landslides occurred in the state, damaging over three dozen roads and schools.[155] The overflow of the Coatzacoalcos River flooded several hundred houses.[156] The storm left agricultural losses of US$7.05 million (MX$136 million) in Colima state.[157]
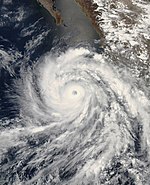
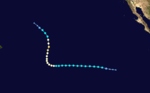
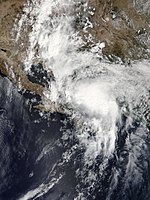
Hurricane Willa[]
| Category 5 hurricane (SSHWS) | |
  | |
| Duration | October 20 – October 24 |
|---|---|
| Peak intensity | 160 mph (260 km/h) (1-min) 925 mbar (hPa) |
A tropical wave departed from the western coast of Africa on October 2 and moved across the tropical Atlantic with minimal convection. The wave arrived at Central America on October 15 and entered the Pacific Ocean on the next day. Convection formed around the wave on October 17; a low-pressure system developed in association with the wave early on October 18. Thunderstorm activity continued to coalesce, and a tropical depression formed by 00:00 UTC on October 20, approximately 265 mi (425 km) south of Manzanillo, Mexico. The system tracked west-northwest and northwest as it continued to organize. An increase in convection and the formation of a central dense overcast resulted in the depression being upgraded to Tropical Storm Willa by 12:00 UTC on the same day, about 290 mi (465 km) south-southwest of Manzanillo. A favorable environment along with Willa's smaller size allowed the cyclone to rapidly intensify for nearly two days. Willa reached hurricane intensity by 06:00 UTC on October 21 and became a major hurricane around 18:00 UTC. Willa peaked as a Category 5 hurricane on October 22 at 06:00 UTC with winds of 160 miles per hour (260 km/h) and a pressure of 925 mbar (27.32 inHg), while located 195 mi (315 km) south-southwest of Cabo Corrientes, Mexico.[34]
After peaking, a combination of cooling sea surface temperatures and an eyewall replacement cycle caused Willa to steadily weaken. The hurricane's eye increased sixfold in size between Willa's peak intensity and the start of October 23. After the replacement cycle ended later that day, the now-Category 3 hurricane tracked northeastward. Around 01:20 UTC on October 24, Willa made landfall near Palmito del Verde, Sinaloa with 115 miles per hour (185 km/h). Strong southwesterly shear along with the mountainous terrain of Mexico caused Willa to rapidly decline in intensity; the cyclone was a mid-grade tropical storm around 06:00 UTC, while located only 10 mi (15 km) southeast of Durango, Mexico. The storm dissipated six hours later and sent remnant moisture into southern Texas and Louisiana.[34]
Hurricane Willa necessitated the issuance of tropical cyclone watches and warnings along the southwestern coast of Mexico.[34] As a precautionary measure, over 200,000 people were evacuated from coastal regions in advance of the storm.[158] Willa brought winds up to 115 miles per hour (185 km/h) to the region where it made landfall and torrential rainfall to multiple states; rainfall peaked at 15.39 in (391 mm) in San Andrés Milpillas, Nayarit.[34] Willa wrought catastrophic damage throughout the region where it made landfall, with damage totaling US$825 million (MX$17.2 billion).[159][160][161][162] The town of Los Sandovales in Acaponeta Municipality, Nayarit, was completely destroyed by Willa.[163][164] The cyclone left a total of 9 people dead throughout four Mexican states.[165][166][167][168] The storm isolated multiple communities in Sinaloa and Nayarit; the San Pedro and Acaponeta rivers flooded, leaving 180,000 people without food and outside communication for at least one week after the storm.[169][170] Multiple cities in the states of Sinaloa and Nayarit were left without any potable water,[171][170] and in some cases, this remained the case for several months after the storm.[122] Around 100,000 people were left homeless in Nayarit.[172] In Sinaloa, 2,000 families were living under plastic rooves half a year after the storm.[173] Reconstruction in Sinaloa did not occur in the months after the storm;[122] a state official stated it could take years to receive federal funding.[174] Reconstruction efforts in Nayarit were hampered by the state government's bankruptcy.[175] The Mexican federal government allocated US$94 million (MX$2.25 billion) towards Nayarit reconstruction, with work slated to begin in February 2019.[176]
Tropical Storm Xavier[]
| Tropical storm (SSHWS) | |
  | |
| Duration | November 2 – November 5 |
|---|---|
| Peak intensity | 65 mph (100 km/h) (1-min) 995 mbar (hPa) |
A tropical wave moved off of the western coast of Africa on October 17 and traveled westward across the tropics and the Caribbean Sea with limited thunderstorm activity. The wave moved over Central America on October 26 and later into a cyclonic gyre that extended over a large portion of the Eastern Pacific on October 31. A passing Kelvin wave fueled an increase in convection along the wave, leading to the formation of a low-pressure system. Over the next couple of days, associated convection continued to increase and organize. A tropical depression spawned at 12:00 UTC on November 2, about 520 mi (835 km) southwest of Manzanillo. The nascent depression tracked towards the east-northeast between a mid-level ridge which was located to the southeast and a mid- to upper-level trough which was located to the north and northwest. Despite being located in a region of high southwesterly wind shear, disparate upper-level flows allowed the depression to intensify into Tropical Storm Xavier by 00:00 UTC on November 3. The tropical storm continued to gradually strengthen over the next day and a half. Xavier reached its peak intensity at 12:00 UTC on November 4 with winds of 65 miles per hour (105 km/h) and a pressure of 995 mbar (29.38 inHg), while around 130 mi (210 km) southwest of Manzanillo.[177]
At its closest position to the coast, Xavier was only 90 mi (145 km) southwest of Manzanillo. Meanwhile, the storm turned northward and subsequently entered a region of dry mid-level air and more powerful southwesterly wind shear. This caused Xavier to quickly weaken; the low-level center completely detached from the storm's convection by 12:00 UTC on November 5. Xavier was downgraded to a post-tropical cyclone by 00:00 UTC on November 6. The remnants traveled west-northwest and later west-southwest while continuing to weaken. The post-tropical system opened up into a trough by 00:00 UTC on November 9, while located around 345 mi (555 km) west-southwest of Socorro Island.[177]
Other systems[]

An upper-level low absorbed the remnants of Hurricane Lane to the west-northwest of Hawaii on August 29.[178] The storm was assigned the designation 96C by the United States Naval Research Laboratory (NRL).[179] Traversing an area of sea surface temperatures about 3.6 °F (2 °C) above-normal,[180] the system coalesced into a subtropical storm by August 31.[178] However, the National Oceanic and Atmospheric Administration's Satellite Products and Service Division analyzed it as a tropical storm through the Dvorak technique.[181] At 23:30 UTC that day, Scatterometer data revealed that 96C attained peak winds of 45 miles per hour (72 km/h) about 980 mi (1,575 km) south of Adak, Alaska.[182] The system reached its peak intensity early on September 2, displaying an eye feature.[179] Afterward, 96C gradually began to weaken, while accelerating northward into colder waters. The system weakened into an extratropical low on September 3. The system was absorbed by a larger extratropical storm in the Bering Sea on September 4.[179]
Storm names[]
The following list of names was used for named storms that form in the Northeastern Pacific Ocean during 2018. No names were retired, so this list will be used again in the 2024 season.[183] This is the same list used in the 2012 season. The name Vicente was used for the first time this year, while the names Willa and Xavier were both used once in 1962 and 1992, respectively.[2]
For storms that form in the Central Pacific Hurricane Center's area of responsibility, encompassing the area between 140 degrees west and the International Date Line, all names are used in a series of four rotating lists.[184] Only the name Walaka was used during the 2018 season.[2]
Season effects[]
This is a table of all the storms that have formed in the 2018 Pacific hurricane season. It includes their duration, names, affected areas, damages, and death totals. Deaths in parentheses are additional and indirect (an example of an indirect death would be a traffic accident), but were still related to that storm. Damage and deaths include totals while the storm was extratropical, a tropical wave, or a low, and all the damage figures are in USD. Potential tropical cyclones are not included in this table.
| Saffir–Simpson scale | ||||||
| TD | TS | C1 | C2 | C3 | C4 | C5 |
| Storm name |
Dates active | Storm category
at peak intensity |
Max 1-min wind mph (km/h) |
Min. press. (mbar) |
Areas affected | Damage (USD) |
Deaths | Refs | ||
|---|---|---|---|---|---|---|---|---|---|---|
| One-E | May 10–11 | Tropical depression | 35 (55) | 1007 | None | None | None | |||
| Aletta | June 6–11 | Category 4 hurricane | 140 (220) | 943 | None | None | None | |||
| Bud | June 9–16 | Category 4 hurricane | 140 (220) | 943 | Western Mexico, Baja California Sur, Southwestern United States | Minimal | 1 | |||
| Carlotta | June 14–18 | Tropical storm | 65 (100) | 997 | Southwestern Mexico | >$7.6 million | 2 (1) | |||
| Daniel | June 24–26 | Tropical storm | 45 (75) | 1004 | None | None | None | |||
| Emilia | June 27 – July 1 | Tropical storm | 60 (95) | 997 | None | None | None | |||
| Fabio | June 30 – July 6 | Category 2 hurricane | 110 (175) | 964 | None | None | None | |||
| Gilma | July 26–29 | Tropical storm | 45 (75) | 1005 | None | None | None | |||
| Nine-E | July 26–27 | Tropical depression | 35 (55) | 1007 | None | None | None | |||
| Hector | July 31 – August 13[nb 3] | Category 4 hurricane | 155 (250) | 936 | Hawaii, Johnston Atoll | Minimal | None | |||
| Ileana | August 4–7 | Tropical storm | 65 (100) | 998 | Western Mexico, Baja California Sur | ≥$737,000 | 8 | |||
| John | August 5–10 | Category 2 hurricane | 110 (175) | 964 | Western Mexico, Baja California Sur, Southern California | None | None | |||
| Kristy | August 7–12 | Tropical storm | 70 (110) | 991 | None | None | None | |||
| Lane | August 15–28 | Category 5 hurricane | 160 (260) | 926 | Hawaii | ≥$250 million | 1 | |||
| Miriam | August 26 – September 2 | Category 2 hurricane | 100 (155) | 974 | None | None | None | |||
| Norman | August 28 – September 8 | Category 4 hurricane | 150 (240) | 937 | Hawaii | None | None | |||
| Olivia | September 1–14 | Category 4 hurricane | 130 (215) | 951 | Hawaii | $25 million | None | |||
| Paul | September 8–11 | Tropical storm | 45 (75) | 1002 | None | None | None | |||
| Nineteen-E | September 19–20 | Tropical depression | 35 (55) | 1002 | Baja California Sur, Northwestern Mexico | >$296 million | 12 (2) | |||
| Rosa | September 25 – October 2 | Category 4 hurricane | 150 (240) | 936 | Baja California Peninsula, Northwestern Mexico, Southwestern United States | $50.5 million | 1 (2) | |||
| Sergio | September 29 – October 13 | Category 4 hurricane | 140 (220) | 943 | Baja California Peninsula, Northwestern Mexico, Southwestern United States, Texas | $2.67 million | 1 | |||
| Walaka | September 29 – October 6 | Category 5 hurricane | 160 (260) | 921 | Johnston Atoll, Northwestern Hawaiian Islands | Minimal | None | |||
| Tara | October 14–17 | Tropical storm | 65 (100) | 995 | Southwestern Mexico | Minimal | None | |||
| Vicente | October 19–23 | Tropical storm | 50 (85) | 1002 | Honduras, El Salvador, Guatemala, Southwestern Mexico | Unknown | 16 | |||
| Willa | October 20–24 | Category 5 hurricane | 160 (260) | 925 | Central America, Mexico, Texas | $825 million | 9 | |||
| Xavier | November 2–5 | Tropical storm | 65 (100) | 995 | Southwestern Mexico | None | None | |||
| Season aggregates | ||||||||||
| 26 systems | May 10 – November 5 | 160 (260) | 920 | >$1.46 billion | 51 (5) | |||||
See also[]
- 2018 Atlantic hurricane season
- 2017–18 Australian region cyclone season
- 2018–19 Australian region cyclone season
- 2018 North Indian Ocean cyclone season
- 2017–18 South Pacific cyclone season
- 2018–19 South Pacific cyclone season
- 2017–18 South-West Indian Ocean cyclone season
- 2018–19 South-West Indian Ocean cyclone season
- List of Pacific hurricanes
- Pacific hurricane season
- Tropical cyclones in 2018
Notes[]
- ^ The totals represent the sum of the squares for every (sub)tropical storm's intensity of over 33 knots (38 mph, 61 km/h), divided by 10,000. Calculations are provided at Talk:2018 Pacific hurricane season/ACE calcs.
- ^ A major hurricane is one that ranks at Category 3 or higher on the Saffir–Simpson scale.[9]
- ^ Hector did not dissipate on August 13. It crossed the International Date Line, beyond which point it was then referred to as Tropical Storm Hector. It dissipated on August 16.
References[]
- ^ "Background Information: East Pacific Hurricane Season". Climate Prediction Center. College Park, Maryland: National Oceanic and Atmospheric Administration. 22 May 2014. Archived from the original on 22 September 2012. Retrieved 29 May 2014.
- ^ a b c d e National Hurricane Center; Hurricane Research Division; Central Pacific Hurricane Center. "The Northeast and North Central Pacific hurricane database 1949–2019". United States National Oceanic and Atmospheric Administration's National Weather Service. Retrieved 1 October 2020. A guide on how to read the database is available here.
- ^ a b "Forecasters Predict a Near- or Above-Normal 2018 Hurricane Season". National Oceanic and Atmospheric Administration. 24 May 2018. Archived from the original on 25 May 2018. Retrieved 25 May 2018.
- ^ a b Barrios, Verónica Millán (25 May 2018). "Temporada de Ciclones 2018". Servicio Meteorológico Nacional. Archived from the original on 12 June 2018. Retrieved 3 June 2018.
- ^ "NOAA: 2018 Eastern Pacific Hurricane Season Outlook". Climate Prediction Center. National Oceanic and Atmospheric Administration. 24 May 2018. Archived from the original on 11 June 2009. Retrieved 27 October 2018.
- ^ "Tropical Cyclones - Annual 2018". NOAA. January 2019. Retrieved January 25, 2021.
- ^ "Background Information: The North Atlantic Hurricane Season". Climate Prediction Center. 6 August 2002. Archived from the original on 6 May 2017. Retrieved 5 March 2019.
- ^ "Northeast Pacific Ocean Historical Tropical Cyclone Statistics". Colorado State University. Archived from the original on 1 February 2020. Retrieved 28 July 2020.
- ^ "Saffir–Simpson Hurricane Wind Scale". National Hurricane Center. Archived from the original on 20 June 2020. Retrieved 22 June 2020.
- ^ Erdman, Jonathan; Donegan, Brian (20 October 2018). "Tara, Vicente and Willa Have Made 2018 the Most Active Eastern Pacific Hurricane Season on Record". The Weather Channel. Archived from the original on 28 July 2020. Retrieved 28 July 2020.
- ^ Wood, Kimberly; Klotzbach, Philip; Collins, Jennifer; Schreck, Carl (28 August 2019). "The Record-Setting 2018 Eastern North Pacific Hurricane Season". Geophysical Research Letters. AGU. 46 (16): 10072–10081. doi:10.1029/2019GL083657. Retrieved 20 May 2021.
- ^ Wang, Chao; Wang, Bin; Cao, Jian (28 November 2019). "Unprecedented Northern Hemisphere Tropical Cyclone Genesis in 2018 Shaped by Subtropical Warming in the North Pacific and the North Atlantic". Geophysical Research Letters. AGU. 46 (22): 13327–13337. doi:10.1029/2019GL085406. Retrieved 20 May 2021.
- ^ Dorst Neal. When is hurricane season? (Report). Atlantic Oceanographic and Meteorological Laboratory. Archived from the original on 6 December 2010. Retrieved 25 November 2010.
- ^ Hurricane Specialist Unit (1 June 2018). Tropical Weather Summary for May 2018 (Report). Monthly Tropical Weather Summary. National Hurricane Center. Archived from the original on 28 July 2020. Retrieved 28 July 2020.
- ^ Hurricane Specialist Unit (1 July 2018). Tropical Weather Summary for June 2018 (Report). Monthly Tropical Weather Summary. National Hurricane Center. Archived from the original on 28 July 2020. Retrieved 28 July 2020.
- ^ a b c Pasch, Richard (19 December 2018). Tropical Cyclone Report: Tropical Storm Carlotta (PDF) (Report). National Hurricane Center. Archived (PDF) from the original on 2 March 2019. Retrieved 5 July 2020.
- ^ Hurricane Specialist Unit (1 August 2018). Tropical Weather Summary for July 2018 (Report). Monthly Tropical Weather Summary. National Hurricane Center. Archived from the original on 28 July 2020. Retrieved 28 July 2020.
- ^ @philklotzbach (1 July 2018). "Philip Klotzbach on Twitter" (Tweet). Retrieved 1 July 2018 – via Twitter.
- ^ a b Hurricane Specialist Unit (1 September 2018). Tropical Weather Summary for August 2018 (Report). Monthly Tropical Weather Summary. National Hurricane Center. Archived from the original on 19 August 2020. Retrieved 28 July 2020.
- ^ a b Philip Klotzbach [@philklotzbach] (11 August 2018). "Philip Klotzbach on Twitter" (Tweet). Retrieved 11 August 2018 – via Twitter.
- ^ Philip Klotzbach [@philklotzbach] (12 August 2018). "Philip Klotzbach on Twitter" (Tweet). Retrieved 12 August 2018 – via Twitter.
- ^ a b c Avila, Lixion (9 November 2018). Tropical Cyclone Report: Tropical Storm Ileana (PDF) (Report). National Hurricane Center. Archived (PDF) from the original on 29 March 2019. Retrieved 8 July 2020.
- ^ a b Roth, David (2019). Hurricane Lane - August 22-27, 2018 (Report). Weather Prediction Center. Archived from the original on 24 July 2019. Retrieved 24 July 2019.
- ^ a b Currie, Kristen (19 September 2019). "Tropical Storm Imelda 7th wettest tropical cyclone on U.S. record". Kxan. NBC. Archived from the original on 25 March 2020. Retrieved 25 March 2020.
- ^ Hurricane Specialist Unit (1 October 2018). Tropical Weather Summary for September 2018 (Report). Monthly Tropical Weather Summary. National Hurricane Center. Archived from the original on 10 December 2018. Retrieved 28 July 2020.
- ^ a b c Gomes, Andrew (13 September 2018). "Olivia makes brief but historic landfall on Maui". Honolulu Star Advertiser. Archived from the original on 14 September 2018. Retrieved 15 September 2018.
- ^ a b c Erdman, Jonathan (21 August 2019). "The Strange Places We've Seen Recent Tropical Cyclones". The Weather Channel. Archived from the original on 28 July 2020. Retrieved 28 July 2020.
- ^ a b c Berg, Robbie (29 November 2018). Tropical Cyclone Report: Tropical Depression Nineteen-E (PDF) (Report). National Hurricane Center. Archived (PDF) from the original on 1 December 2018. Retrieved 22 July 2020.
- ^ a b c d Houston, Sam; Birchard, Thomas (9 June 2020). Tropical Cyclone Report: Hurricane Walaka (PDF) (Report). Central Pacific Hurricane Center. Archived (PDF) from the original on 12 June 2020. Retrieved 23 July 2020.
- ^ a b Hurricane Specialist Unit (1 November 2018). Tropical Weather Summary for October 2018 (Report). Monthly Tropical Weather Summary. National Hurricane Center. Archived from the original on 28 July 2020. Retrieved 28 July 2020.
- ^ Blake, Eric. Hurricane Sergio Discussion Number 19. National Hurricane Center (Report). National Oceanic and Atmospheric Administration. Archived from the original on 2 October 2019. Retrieved 4 October 2018.
- ^ a b c Avila, Lixion (23 July 2019). Tropical Cyclone Report: Hurricane Rosa (PDF) (Report). National Hurricane Center. Archived (PDF) from the original on 3 July 2019. Retrieved 23 July 2020.
- ^ a b c d Blake, Eric (26 February 2019). Tropical Cyclone Report: Hurricane Sergio (PDF) (Report). National Hurricane Center. Archived (PDF) from the original on 6 March 2019. Retrieved 23 July 2020.
- ^ a b c d e Brennan, Michael (2 April 2019). Tropical Cyclone Report: Hurricane Willa (PDF) (Report). National Hurricane Center. Archived (PDF) from the original on 10 April 2019. Retrieved 24 July 2020.
- ^ a b c Latto, Andrew; Beven, John (10 April 2019). Tropical Cyclone Report: Tropical Storm Vicente (PDF) (Report). National Hurricane Center. Archived (PDF) from the original on 20 April 2019. Retrieved 23 July 2020.
- ^ Hurricane Specialist Unit (1 December 2018). Tropical Weather Summary for November 2018 (Report). Monthly Tropical Weather Summary. National Hurricane Center. Archived from the original on 19 August 2020. Retrieved 28 July 2020.
- ^ Berg, Robbie (12 July 2018). Tropical Cyclone Report: Tropical Depression One-E (PDF) (Report). National Hurricane Center. Archived (PDF) from the original on 18 July 2018. Retrieved 12 June 2020.
- ^ a b Avila, Lixion (23 July 2019). Tropical Cyclone Report: Hurricane Aletta (PDF) (Report). National Hurricane Center. Archived (PDF) from the original on 1 August 2018. Retrieved 12 June 2020.
- ^ a b c Blake, Eric (24 October 2018). Tropical Cyclone Report: Hurricane Bud (PDF) (Report). National Hurricane Center. Archived (PDF) from the original on 16 December 2018. Retrieved 13 June 2020.
- ^ "Tropical Storm Bud Is Lashing Southern Baja California Peninsula, Including Los Cabos, Mexico, With Gusty Winds, Rain and High Surf". Weather Underground. 14 June 2018. Archived from the original on 17 June 2018. Retrieved 18 June 2018.
- ^ Williams, Juliet (15 June 2018). "Strong winds from Tropical Storm Bud hit Mexico's Los Cabos". Associated Press. Archived from the original on 18 June 2018. Retrieved 18 June 2018.
- ^ Precipitación acumulada (mm) del 11 al 15 de junio de 2018 por el huracan bud [Accumulated Precipitation (mm) for Hurricane Bud from 11 to 15 June 2018] (Map) (in Spanish). Conagua. Archived from the original on 15 November 2020. Retrieved 12 November 2020.
- ^ "Huracán Bud deja daños en infraestructura y evacuados en 2 estados mexicanos" [Hurricane Bud leaves infrastructure damage and evacuees in 2 Mexican states]. Agencia EFE (in Spanish). 11 June 2018. Archived from the original on 16 November 2020. Retrieved 15 November 2020.
- ^ Bañuelos, Jonathan (11 June 2018). "Causa tormenta caos en Jalisco" [Storm causes chaos in Jalisco]. El Heraldo de Aguascalientes (in Spanish). Archived from the original on 16 November 2020. Retrieved 16 November 2020.
- ^ "Huracán Bud se intensifica y causa fuertes lluvias e inundaciones en México" [Hurricane Bud intensifies and causes heavy rains and flooding in Mexico]. CNN Espanol (in Spanish). 11 June 2018. Archived from the original on 12 June 2018. Retrieved 27 November 2020.
- ^ Rodríguez, Gladys; Cabrera, Javier; Torres, Raúl; Arrieta, Carlos (13 June 2018). "Hay alerta en 7 estados por paso del huracán 'Bud'" [Alert in 7 states for the passage of Hurricane Bud]. El Universal (Mexico City) (in Spanish). Archived from the original on 15 November 2020. Retrieved 12 November 2020.
- ^ Memije, Javier Tinoco (12 June 2018). "Empresarios de Pie de la Cuesta piden apoyo y activación del Fonden" [Pie de la Cuesta businessmen ask for support and the activation of Fonden]. El Sol de Acapulco (in Spanish). Archived from the original on 27 November 2020. Retrieved 25 November 2020.
- ^ "Las lluvias provocan la muerte de un menor en la Ciudad de México". Expansion (in Spanish). CNN Español. 15 June 2018. Archived from the original on 31 March 2019. Retrieved 31 March 2019.
- ^ Donegan, Brian (16 June 2018). "Moisture From the Remnants of Bud Is Spreading Needed-Rainfall Into the Southwest". Weather Underground. Archived from the original on 17 June 2018. Retrieved 18 June 2018.
- ^ "Hurricane Bud Leftovers Sweep Helpful Rain Over Colorado, Wyoming Wildfires". Colorado Public Radio. Colorado Public Radio. Archived from the original on 17 December 2018. Retrieved 16 December 2018.
- ^ Semadeni, Alex. "'It's the perfect kind of rain'". The Durango Herald. Archived from the original on 17 December 2018. Retrieved 16 December 2018.
- ^ "Recuperan cuerpo de joven que cayó a arroyo en Oaxaca". Televisa News (in Spanish). 20 June 2018. Archived from the original on 10 August 2019. Retrieved 7 April 2019.
- ^ a b Torres, David Julián (19 June 2018). "[Videos] Cobra dos vidas y deja afectaciones, intensa lluvia en Aguascalientes". El Sol de México (in Spanish). Archived from the original on 31 March 2019. Retrieved 31 March 2019.
- ^ "Video: Tromba deja dos muertos y vehículos arrastrados en Aguascalientes". La Silla Rota (in Spanish). 20 June 2018. Archived from the original on 31 March 2019. Retrieved 31 March 2019.
- ^ "Precipitación acumulada (mm) del 14 al 19 de junio de 2018 por la tormenta tropical Carlotta" (Map). gob.mx (in Spanish). Conagua. Archived from the original on 13 April 2020. Retrieved 12 March 2019.
- ^ Rodriguez, Yazmin (17 June 2018). "Tormenta tropical Carlotta afecta a 170 familias en Yucatán". El Universal (in Spanish). Archived from the original on 25 February 2020. Retrieved 9 April 2019.
- ^ "Carlotta deja daños en 19 municipios de Guerrero". El Sol de México (in Spanish). 18 June 2018. Archived from the original on 31 March 2019. Retrieved 9 April 2019.
- ^ Reyes, Laura (17 June 2018). "La tormenta 'Carlotta' deja daños en Guerrero". Expansion (in Spanish). CNN Espanol. Archived from the original on 25 February 2020. Retrieved 9 April 2019.
- ^ "Lluvias intensas de 'Carlotta' causan inundaciones en Tehuacán, Puebla". Televisa News (in Spanish). 18 June 2018. Archived from the original on 25 February 2020. Retrieved 9 April 2019.
- ^ Fuentes, Christian (19 June 2018). "El agua se mete a las casas en Tiquicheo; el alcalde, damnificado". La Voz de Michoacán (in Spanish). Archived from the original on 7 April 2019. Retrieved 7 April 2019.
- ^ a b ""Carlotta" deja su huella en Michoacán". La Voz de Michoacán (in Spanish). 19 June 2018. Archived from the original on 7 April 2019. Retrieved 7 April 2019.
- ^ "Reportan lluvias en inundaciones en Michoacán por 'Carlotta'". Televisa News (in Spanish). 18 June 2018. Archived from the original on 14 August 2019. Retrieved 7 April 2019.
- ^ ""Carlotta" afecta varias comunidades de Michoacán y cerca de 4 mil hectáreas de cultivo". El Universal (in Spanish). 19 June 2018. Archived from the original on 11 July 2019. Retrieved 7 April 2019.
- ^ Beven, John (11 February 2019). Tropical Cyclone Report: Tropical Storm Daniel (PDF) (Report). National Hurricane Center. Archived (PDF) from the original on 1 March 2019. Retrieved 15 June 2020.
- ^ Stewart, Stacy (7 August 2019). Tropical Cyclone Report: Tropical Storm Emilia (PDF) (Report). National Hurricane Center. Archived (PDF) from the original on 28 August 2018. Retrieved 16 June 2020.
- ^ a b c Brown, Daniel (14 November 2018). Tropical Cyclone Report: Hurricane Fabio (PDF) (Report). National Hurricane Center. Archived (PDF) from the original on 15 January 2019. Retrieved 25 June 2020.
- ^ Berg, Robbie (4 July 2018). Hurricane Fabio Discussion Number 16 (Report). National Hurricane Center. Retrieved 19 October 2020.
- ^ Brown, Daniel (6 July 2018). Tropical Storm Fabio Discussion Number 23 (Report). National Hurricane Center. Retrieved 19 October 2020.
- ^ Cangialosi, John (6 November 2018). Tropical Cyclone Report: Tropical Storm Gilma (PDF) (Report). National Hurricane Center. Archived (PDF) from the original on 15 November 2018. Retrieved 25 June 2020.
- ^ Zelinsky, David (24 August 2018). Tropical Cyclone Report: Tropical Depression Nine-E (PDF) (Report). National Hurricane Center. Archived (PDF) from the original on 6 October 2018. Retrieved 26 June 2020.
- ^ a b c Berg, Robbie; Houston, Sam; Birchard, Thomas (1 July 2019). Tropical Cyclone Report: Hurricane Hector (PDF) (Report). National Hurricane Center and Central Pacific Hurricane Center. Archived (PDF) from the original on 28 October 2018. Retrieved 6 July 2020.
- ^ "Hurricane Hector Passing Hundreds of Miles South of Hawaiian Islands". Star Advertiser. 8 August 2018. Archived from the original on 12 August 2018. Retrieved 12 August 2018.
- ^ "Dozens Rescued from South Shore Waters as Hector Kicks Up Surf". Hawaii News Now. 9 August 2018. Archived from the original on 12 August 2018. Retrieved 12 August 2018.
- ^ "Tormenta Ileana deja apagones a su paso por Acapulco". UnoTV (in Spanish). 6 August 2018. Archived from the original on 15 December 2018. Retrieved 15 December 2018.
- ^ "Tormenta tropical "Ileana" deja cuatro muertos en Guerrero". Diario de Yucatán (in Spanish). 7 August 2018. Archived from the original on 1 April 2019. Retrieved 15 December 2018.
- ^ "Hallan cadáveres de dos niños en laguna de Acapulco". Sipse (in Spanish). 6 August 2018. Archived from the original on 1 April 2019. Retrieved 15 December 2018.
- ^ Cervantes, Juan (6 August 2018). "Arrecian efectos de la tormenta "Ileana" en Guerrero". El Universal (in Spanish). Archived from the original on 28 October 2018. Retrieved 7 August 2018.
- ^ "Precipitación acumulada (mm) del 5 al 6 de agosto de 2018 por la tormenta tropical Ileana" (Map). gob.mx (in Spanish). Conagua. Archived from the original on 19 August 2020. Retrieved 12 March 2019.
- ^ Olivera, Alondra (7 August 2018). "Tormenta "IIeana" provoca deslizamiento y sepulta vivienda en Oaxaca". La Silla Rota (in Spanish). Archived from the original on 1 April 2019. Retrieved 15 December 2018.
- ^ "Tormenta 'Ileana' y huracán 'John' causan 7 muertes". Excélsior (in Spanish). Huffington Post. 7 August 2018. Archived from the original on 8 May 2019. Retrieved 25 October 2018.
- ^ Alfaro, Fatima Paz (7 August 2018). "Sin daños por paso de huracanes Ileana y John en Michoacán". Capital Michoacán (in Spanish). Archived from the original on 23 October 2018. Retrieved 25 October 2018.
- ^ a b Blake, Eric (20 November 2018). Tropical Cyclone Report: Hurricane John (PDF) (Report). National Hurricane Center. Archived (PDF) from the original on 15 January 2019. Retrieved 26 June 2020.
- ^ Sosnowski, Alex (10 August 2018). "Dangerous surf from John to affect Southern California beaches into this weekend". State College, Pennsylvania: AccuWeather. Archived from the original on 10 August 2018. Retrieved 14 August 2018.
- ^ a b Latto, Andrew; Pasch, Richard (6 March 2019). Tropical Cyclone Report: Tropical Storm Kristy (PDF) (Report). National Hurricane Center. Archived (PDF) from the original on 8 May 2019. Retrieved 26 June 2020.
- ^ a b c Beven, John; Wroe, Derek (16 December 2019). Tropical Cyclone Report: Hurricane Lane (PDF) (Report). National Hurricane Center and Central Pacific Hurricane Center. Archived (PDF) from the original on 15 December 2019. Retrieved 8 July 2020.
- ^ Kodama, Kevin (27 August 2018). Lane Possibly Breaks Hawaii Tropical Cyclone Rainfall Record (Public Information Statement). National Weather Service Office in Honolulu, Hawaii. Archived from the original on 28 August 2018. Retrieved 27 August 2018.
- ^ "Lane's 'catastrophic' flooding leaves behind big mess on Big Island". Hawaii News Now. 25 August 2018. Archived from the original on 29 August 2018. Retrieved 30 August 2018.
- ^ Dayton, Kevin (29 August 2018). "Crews fan out to assess storm damage in Hilo". Honolulu Star-Advertiser. Archived from the original on 30 August 2018. Retrieved 30 August 2018.
- ^ Callis, Tom (2 September 2018). "'If you don't smile you're going to cry': Owner of bonsai nursery laments losses caused by heavy rains". Hawaii Tribune-Herald. Archived from the original on 3 September 2018. Retrieved 2 September 2018.
- ^ Flash Flood in Hawaii, Hawaii [2018-08-22 21:35 HST-10] (Report). National Centers for Environmental Information. National Weather Service Office in Honolulu, Hawaii. 2018. Archived from the original on 2020-08-19. Retrieved 24 July 2019.
- ^ Tanji, Melissa (30 January 2019). "Gifts to help rebuild homes, lives". The Maui News. Archived from the original on 27 July 2020. Retrieved 4 May 2020.
- ^ Thiessen, Mark (26 August 2018). "Firefighters fully contain West Maui wildfires that left significant trail of damage". Hawaii News Now. Associated Press. Archived from the original on 31 August 2018. Retrieved 30 August 2018.
- ^ "1 death from Hawaii storm Lane reported on Kauai". Associated Press. 29 August 2018. Archived from the original on 28 March 2020. Retrieved 30 August 2018.
- ^ a b c d Weather, Climate & Catastrophe Insight: 2018 Annual Report (PDF). AON Benfield (Report). AON Benfield. Archived (PDF) from the original on 14 February 2019. Retrieved 25 January 2019.
- ^ "Hawaii Hurricane Lane (DR-4395)". Federal Emergency Management Agency. 27 September 2018. Archived from the original on 24 July 2019. Retrieved 4 May 2020.
- ^ "Hawaii County delays transportation projects to pay for Hurricane Lane repairs". Honolulu Star-Advertiser. 21 September 2018. Archived from the original on 24 July 2019. Retrieved 24 July 2019.
- ^ a b Stewart, Stacy; Jacobson, Chris; Houston, Sam (21 March 2019). Tropical Cyclone Report: Hurricane Miriam (PDF) (Report). National Hurricane Center and Central Pacific Hurricane Center. Archived (PDF) from the original on 15 January 2020. Retrieved 4 July 2020.
- ^ a b c Brown, Daniel; Powell, Jeff (8 August 2019). Tropical Cyclone Report: Hurricane Norman (PDF) (Report). National Hurricane Center and Central Pacific Hurricane Center. Archived (PDF) from the original on 5 July 2020. Retrieved 5 July 2020.
- ^ a b c d e Cangialosi, John; Jelsema, Jon (25 July 2019). Tropical Cyclone Report: Hurricane Olivia (PDF) (Report). National Hurricane Center and Central Pacific Hurricane Center. Archived (PDF) from the original on 9 December 2018. Retrieved 22 July 2020.
- ^ "INTERVIEW: Governor signs emergency proclamation as Olivia heads toward Hawaii". Khon 2. 10 September 2018. Archived from the original on 16 December 2020. Retrieved 21 December 2020.
- ^ "'We'll recover': Maui residents hold on to hope in light of damage". Hawaii News Now. 19 September 2018. Archived from the original on 9 November 2020. Retrieved 25 February 2021.
- ^ Gomes, Andrew (14 September 2018). "Olivia causes flooding and landslides but no injuries on Maui". Star Advertiser. Archived from the original on 9 November 2020. Retrieved 23 February 2021.
- ^ a b Tanji, Melissa (14 September 2018). "County officials begin assessing damage from Tropical Storm Olivia". The Maui News. Archived from the original on 16 November 2018. Retrieved 29 December 2020.
- ^ Larson, Eliza (17 September 2018). "Honokohau Valley residents fear for Olivia's after-effects". KITV Island News. ABC. Archived from the original on 9 November 2020. Retrieved 26 December 2020.
- ^ Davis, Chelsea (14 September 2018). "Maui comes together to help Honokohau Valley residents rebuild". Hawaii News Now. Archived from the original on 18 September 2018. Retrieved 26 December 2020.
- ^ Sugidono, Chris (20 September 2018). "Flood recovery ongoing 'off the grid' in Honokohau Valley". The Maui News. Archived from the original on 19 December 2020. Retrieved 26 December 2020.
- ^ Boyette, Chris; Cullinane, Susannah (13 September 2018). "Tropical Storm Olivia makes landfall in Hawaii". CNN. Archived from the original on 12 September 2018. Retrieved 22 December 2020.
- ^ "The Latest: Honolulu official: Dam not in danger of failing". Fox News. Associated Press. 13 September 2018. Archived from the original on 6 October 2018. Retrieved 22 December 2020.
- ^ "Olivia Is Now a Tropical Depression, More Rain for Hawaii". VOA. 13 September 2018. Archived from the original on 1 October 2020. Retrieved 21 December 2020.
- ^ a b Zelinsky, David (4 October 2018). Tropical Cyclone Report: Tropical Storm Paul (PDF) (Report). National Hurricane Center. Archived (PDF) from the original on 16 November 2018. Retrieved 30 June 2020.
- ^ "Precipitacion accumulada (mm) del 17 al 20 de septiembre de 2018 por la depresion tropical DT19E" (Map). gob.mx (in Spanish). Conagua. Archived from the original on 28 February 2019. Retrieved 26 February 2019.
- ^ "Por lluvias e inundaciones, declaran emergencia en 11 municipios de Sinaloa". Animal Politico (in Spanish). 20 September 2018. Archived from the original on 14 December 2018. Retrieved 4 December 2018.
- ^ Carranza, Rafael. "Monsoon floods wash two bodies across the border in Nogales from Mexico to Arizona". USA Today. Archived from the original on 19 August 2020. Retrieved 1 March 2019 – via AZ Central.
- ^ "Fotos: Fuertes lluvias dejan severas inundaciones en Sinaloa". El Imparcial (in Spanish). 20 September 2018. Archived from the original on 5 December 2018. Retrieved 4 December 2018.
- ^ Blašković, Teo (21 September 2018). "6 dead and missing after major flash floods hit Culiacán, Mexico". The Watchers. Archived from the original on 1 April 2019. Retrieved 5 March 2019.
- ^ "Up to 300,000 homes affected by flooding in Sinaloa; Los Mochis hardest hit". Mexico News Daily. Archived from the original on 1 April 2019. Retrieved 2 December 2018.
- ^ Global Catastrophe Recap September 2018 (PDF). AON (Report). Archived (PDF) from the original on 9 December 2019. Retrieved 2 December 2018.
- ^ Javier Cabrera Martínez (26 September 2018). "Suman 800 mdp en daños a cultivos por lluvias en Sinaloa". El Universal (in Spanish). Culiacán. Archived from the original on 23 October 2018. Retrieved 20 October 2018.
- ^ "Heavy rain in Sinaloa, Chihuahua leaves at least seven people dead". Mexico News Daily. Archived from the original on 23 January 2019. Retrieved 2 December 2018.
- ^ a b Lam, Linda (22 September 2018). "Heavy Rainfall, Flash Flooding Expected in Texas, Oklahoma and Arkansas Through Saturday". The Weather Channel. Archived from the original on 1 March 2019. Retrieved 28 February 2019.
- ^ Johnson, Kaley (25 September 2018). "Body of 23-year-old killed in floodwaters found under bridge in Fort Worth". Fort Worth Star-Telegram. Archived from the original on 7 January 2019. Retrieved 4 April 2019.
- ^ a b c Ibarra, Aaron (25 June 2019). "Sin aterrizar aún apoyos por el huracán 'Willa'y el Fonden busca nuevo recuento de daños". Ríodoce (in Spanish). Archived from the original on 31 July 2019. Retrieved 10 October 2019.
- ^ "Precipitación acumulada (mm) el 1 de octubre de 2018 por el huracan Rosa" (Map). gob.mx (in Spanish). Conagua. Archived from the original on 19 August 2020. Retrieved 12 March 2019.
- ^ "Colapsa vialidad en San Felipe por intensa lluvia". Uniradio Noticias (in Spanish). 1 October 2018. Archived from the original on 19 August 2020. Retrieved 4 June 2019.
- ^ Campos, Diana (3 October 2018). "10 millones de pérdidas en San Felipe por lluvias" (in Spanish). Cadena Noticias. Archived from the original on 23 October 2018. Retrieved 23 October 2018.
- ^ "Las lluvias de 'Rosa' provocan inundaciones en Los Cabos". La Prensa (in Spanish). 28 September 2018. Archived from the original on 29 September 2018. Retrieved 5 June 2019.
- ^ Hernández, Tania Yamileth (3 October 2018). "Declaran emergencia en Puerto Peñasco por "Rosa"". El Imparcial (in Spanish). Archived from the original on 25 October 2018. Retrieved 25 October 2018.
- ^ a b c Wright, Pam (5 October 2018). "At Least 2 Dead in Arizona, 1 in Mexico Following Flash Flooding From Rosa's Remnants". The Weather Channel. Archived from the original on 3 October 2018. Retrieved 15 July 2019.
person reportedly drowned in Mexico after being swept away by floodwaters.
- ^ Kong, Kwan-Yin (October 3, 2018). Storm Summary Number 7 for Heavy Rainfall Associated with Rosa (Report). Weather Prediction Center. Archived from the original on February 3, 2019. Retrieved October 3, 2018.
- ^ "'One of the rainiest days': Streets flooded, schools closed as Rosa takes toll on Arizona". 13wmaz. 2 October 2018. Archived from the original on 19 August 2020. Retrieved 23 February 2019.
- ^ "Southern Arizona dam holding as water recedes". New Haven Register. Associated Press. 3 October 2018. Archived from the original on 5 October 2018. Retrieved 5 October 2018.
- ^ Radwany, Sam (17 October 2018). "Some Tohono O'odham Nation evacuees finally returning home". Kgun 9. ABC. Archived from the original on 19 August 2020. Retrieved 18 June 2019.
- ^ Ojeda, Yesicka (17 October 2018). "Pedirán recursos al Fonden tras daños que causó "Sergio"". El Imparcial (in Spanish). Archived from the original on 23 October 2018. Retrieved 23 October 2018.
- ^ "Precipitación acumulada (mm) del 11 al 12 de octubre de 2018 por el huracan Sergio" (Map). gob.mx (in Spanish). Conagua. Archived from the original on 19 August 2020. Retrieved 12 March 2019.
- ^ Ruiz, Rubén A. (13 October 2018). "Solicitan declarar a Puerto Peñasco como zona de desastre". El Imparcial. Archived from the original on 28 July 2019. Retrieved 28 July 2019.
- ^ "Decenas de damnificados en NCG por lluvias que generó "Sergio"" (in Spanish). Puente Libre.mx. 13 October 2018. Archived from the original on 31 July 2019. Retrieved 31 July 2019.
- ^ "Remnant of Former Hurricane Sergio Triggered Flooding Rain, Some Tornadoes in the Southern Plains". The Weather Channel. Archived from the original on 25 December 2019. Retrieved 25 November 2018.
- ^ a b Event: Tornado in Ellis, TX [2018-10-13 11:47 CST-6] (Report). Storm Events Database. National Centers for Environmental Information. Archived from the original on 13 April 2020. Retrieved 23 July 2019.
- ^ Event: Tornado in Panola, TX [2018-10-13 16:19 CST-6] (Report). Storm Events Database. National Centers for Environmental Information. Archived from the original on 13 April 2020. Retrieved 23 July 2019.
- ^ Event: Tornado in Tom Green, TX [2018-10-13 05:56 CST-6] (Report). Storm Events Database. National Centers for Environmental Information. Archived from the original on 3 July 2019. Retrieved 23 July 2019.
- ^ Event: Flash Flood in Maricopa, AZ [2018-10-13 08:30 MST-7] (Report). Storm Events Database. National Centers for Environmental Information. Archived from the original on 13 April 2020. Retrieved 19 July 2019.
- ^ Milman, Oliver (24 October 2018). "Hawaiian Island Erased by Powerful Hurricane: 'The loss is a huge blow'". The Guardian. Archived from the original on 24 October 2018. Retrieved 24 October 2018.
- ^ a b Pasch, Richard (28 March 2019). Tropical Cyclone Report: Tropical Storm Tara (PDF) (Report). National Hurricane Center. Archived (PDF) from the original on 7 May 2019. Retrieved 1 July 2020.
- ^ "Precipitación acumulada (mm) del 20 al 23 de octubre de 2018 por el tormenta tropical Vicente" (Map). gob.mx (in Spanish). Conagua. Archived from the original on 19 August 2020. Retrieved 12 March 2019.
- ^ Tinoco, Miguel Garcia. "Inundan intensas lluvias 30 colonias de Morelia, Michoacán". Excelsior (in Spanish). 22 October 2018. Archived from the original on 28 March 2020. Retrieved 28 March 2020.
- ^ "La tormenta tropical Vicente causa inundaciones en Morelia, Michoacán" (in Spanish). PSN En Linea. 22 October 2018. Archived from the original on 28 March 2020. Retrieved 28 March 2020.
- ^ Jaque (26 October 2018). "Aumenta cifra de muertos por lluvias en Oaxaca, suman 13". Regeneración (in Spanish). Archived from the original on 1 November 2018. Retrieved 26 October 2018.
- ^ Government of Oaxaca (27 October 2018). "Atienden carreteras afectadas por la tormenta tropical Vicente" (in Spanish). Quadratin. Archived from the original on 19 August 2020. Retrieved 31 March 2020.
- ^ Torres, Humberto A. (27 October 2018). "Decenas de derrumbes impiden comunicación en comunidades de Oaxaca". El Imparcial de Oaxaca (in Spanish). Archived from the original on 3 August 2019. Retrieved 31 March 2020.
- ^ Hernandez, Carlos Alberto (28 October 2018). "Trabaja SCT en 6 tramos carreteros y 30 caminos rurales de Oaxaca". El Imparcial de Oaxaca (in Spanish). Archived from the original on 19 September 2019. Retrieved 31 March 2020.
- ^ Laguna, Raul (21 October 2018). "Tormenta tropical golpea Huatulco y Pochutla en Oaxaca". El Imparcial de Oaxaca (in Spanish). Archived from the original on 1 June 2019. Retrieved 31 March 2020.
- ^ Jimenez, Elfego (21 October 2018). "Costa Chica de Oaxaca afectada por la Iluvia". El Imparcial de Oaxaca (in Spanish). Archived from the original on 1 June 2019. Retrieved 31 March 2020.
- ^ "Tormenta tropical 'Willa' se forma frente a Colima; 'Vicente' inunda casas en Oaxaca" (in Spanish). Ejecentral. 20 October 2018. Archived from the original on 28 March 2020. Retrieved 28 March 2020.
- ^ Zamudio, Isabel (22 October 2018). "Tormenta tropical 'Vicente' deja tres muertos en Veracruz" (in Spanish). Milenio. Archived from the original on 16 January 2019. Retrieved 23 October 2018.
- ^ "Lluvias afectan 52 municipios en Veracruz" (in Spanish). Posta. 22 October 2018. Archived from the original on 24 October 2018. Retrieved 31 March 2020.
- ^ "Desbordamiento de río afecta 790 viviendas en Hidalgotitlán, Veracruz" (in Spanish). Televisa News. 20 October 2018. Archived from the original on 19 August 2020. Retrieved 31 March 2020.
- ^ Munguía, Bertha (24 October 2018). "Daños mínimos deja "Willa" y " Vicente"" (in Spanish). Meganoticias. Archived from the original on 4 November 2018. Retrieved 26 October 2018.
- ^ "Nayarit en alerta roja por huracán 'Willa'". Diario de México (in Spanish). 23 October 2018. Archived from the original on 1 August 2019. Retrieved 1 August 2019.
- ^ Espinosa, Gabriela (11 November 2018). "Ascienden a $10 mil millones los daños que causó 'Willa' en Nayarit". La Jornada (in Spanish). Archived from the original on 15 January 2019. Retrieved 14 January 2019.
- ^ "Estiman en 6 mil millones de pesos los daños dejados por huracán Willa en Escuinapa". Noticias Digitales Sinaloa (in Spanish). 6 February 2019. Archived from the original on 30 August 2019. Retrieved 10 February 2019.
- ^ Piña, Ireri (25 October 2018). "Necesarios 35 mdp para solventar daños por "Willa"". Contramuro (in Spanish). Archived from the original on 4 November 2018. Retrieved 26 October 2018.
- ^ "Hay daños evidentes en Lerdo por lluvias". El Siglo de Durango (in Spanish). 3 November 2018. Archived from the original on 4 November 2018. Retrieved 4 November 2018.
- ^ "Nayarit, paralizado por falta de ayuda tras paso de huracán 'Willa'". Televisa News (in Spanish). 8 December 2018. Archived from the original on 10 August 2019. Retrieved 16 August 2019.
- ^ "TRAGEDIA: Poderoso huracán "Willa" destruye un pueblo de México". La Verdad Noticias (in Spanish). 2 November 2018. Archived from the original on 31 July 2019. Retrieved 17 May 2020.
- ^ Cancino, Karina (25 October 2018). "Cuatro muertos y 150 mil damnificados por paso de 'Willa' en Nayarit". El Financiero (in Spanish). Archived from the original on 26 October 2018. Retrieved 26 October 2018.
- ^ Martinez, Abraham Acosta (21 October 2018). "Van a Colima a esparcir cenizas de familiar, mueren por oleaje de 'Willa'" (in Spanish). Excelsior. Archived from the original on 1 August 2019. Retrieved 21 March 2020.
- ^ "Trabajador de CFE muere electrocutado producto de las lluvias por 'Willa'" (in Spanish). Tribuna. 25 October 2018. Archived from the original on 1 August 2019. Retrieved 21 March 2020.
- ^ "'Willa' pega en Sinaloa y deja 2 muertos en Sonora". Milenio (in Spanish). 25 October 2018. Archived from the original on 26 October 2018. Retrieved 26 October 2018.
- ^ "Huracán Willa deja sin luz y agua a varias comunidades de Sinaloa y provoca daños carreteros" [Hurricane Willa leaves several communities in Sinaloa without light and water and causes road damages] (in Spanish). Animal Politico. 24 October 2018. Archived from the original on 25 October 2018. Retrieved 24 October 2018.
- ^ a b "Nayarit no se recupera tras el paso de 'Willa'; 180 mil habitantes siguen incomunicados". Televisa News (in Spanish). 1 November 2018. Archived from the original on 2 August 2019. Retrieved 21 March 2020.
- ^ Suárez, Karina (25 October 2018). "Willa deja 13.000 evacuados y severos daños materiales a su paso por México" [Willa leaves 13,000 evacuated and severe material damage as it passes through Mexico]. El País (in Spanish). Archived from the original on 23 October 2018. Retrieved 24 October 2018.
- ^ Tello, Antonio; Madrigal, Guadalupe (23 November 2018). "Gobierno de Nayarit se declara en bancarrota para atender emergencia por 'Willa'". Noticieros Televisa (in Spanish). Archived from the original on 14 August 2019. Retrieved 18 March 2020.
- ^ Carlos, Adriana (24 March 2019). "En Sinaloa, aún hay más de 2 mil viviendo en casas provisionales por 'Willa'". Milenio (in Spanish). Archived from the original on 20 April 2019. Retrieved 20 April 2019.
- ^ Gamboa Parra, Jose Luis (3 November 2018). "Sinaloa tendrá que esperar tres años para recibir el apoyo de Fonden". Tribuna (in Spanish). Archived from the original on 31 July 2019. Retrieved 11 March 2020.
- ^ "Nayarit, entre la crisis financiera y los daños de "Willa"". La Silla Rota (in Spanish). 20 November 2018. Archived from the original on 1 August 2019. Retrieved 16 May 2020.
- ^ "¡Por fin!, Reconstrucción de Nayarit tras huracán Willa inicia en febrero". Vallarta Independiente (in Spanish). 28 January 2019. Archived from the original on 1 August 2019. Retrieved 16 May 2020.
- ^ a b Brown, Daniel (8 February 2019). Tropical Cyclone Report: Tropical Storm Xavier (PDF) (Report). National Hurricane Center. Archived (PDF) from the original on 28 March 2019. Retrieved 5 July 2020.
- ^ a b National Weather Service Office in Honolulu, Hawaii [@NWSHonolulu] (31 August 2018). "Thanks for pointing this out. The circulation that was associated with Lane dissipated several days ago and was absorbed by the same upper level low responsible for this feature. This feature is now a sub-tropical gale low, but we will continue to keep an eye on it!" (Tweet). Retrieved 2 September 2018 – via Twitter.
- ^ a b c "2018 Tropical Bulletin Archive". NOAA. Archived from the original on 6 September 2018. Retrieved 3 September 2018.
- ^ Henson, Bob [@bhensonweather] (2 September 2018). ""Son of Lane" (if you will) is sitting over a distinct SST anomaly of around 2°C" (Tweet). Retrieved 2 September 2018 – via Twitter.
- ^ Turk, Michael (September 1, 2020). [96C Tropical Cyclone Position at 17:30 UTC on September 1] (Report). National Oceanic and Atmospheric Administration Satellite Products and Service Division. Retrieved December 28, 2020.
- ^ Turk, Michael (September 1, 2020). [96C Tropical Cyclone Position at 23:30 UTC on September 1] (Report). National Oceanic and Atmospheric Administration Satellite Products and Service Division. Retrieved December 28, 2020.
- ^ "Tropical Cyclone Names". National Hurricane Center. Archived from the original on 27 November 2018. Retrieved 27 November 2018.
- ^ "Pacific Tropical Cyclone Names 2016-2021". Central Pacific Hurricane Center. 12 May 2016. Archived from the original (PHP) on 30 December 2016.
External links[]
| Wikimedia Commons has media related to 2018 Pacific hurricane season. |
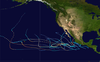
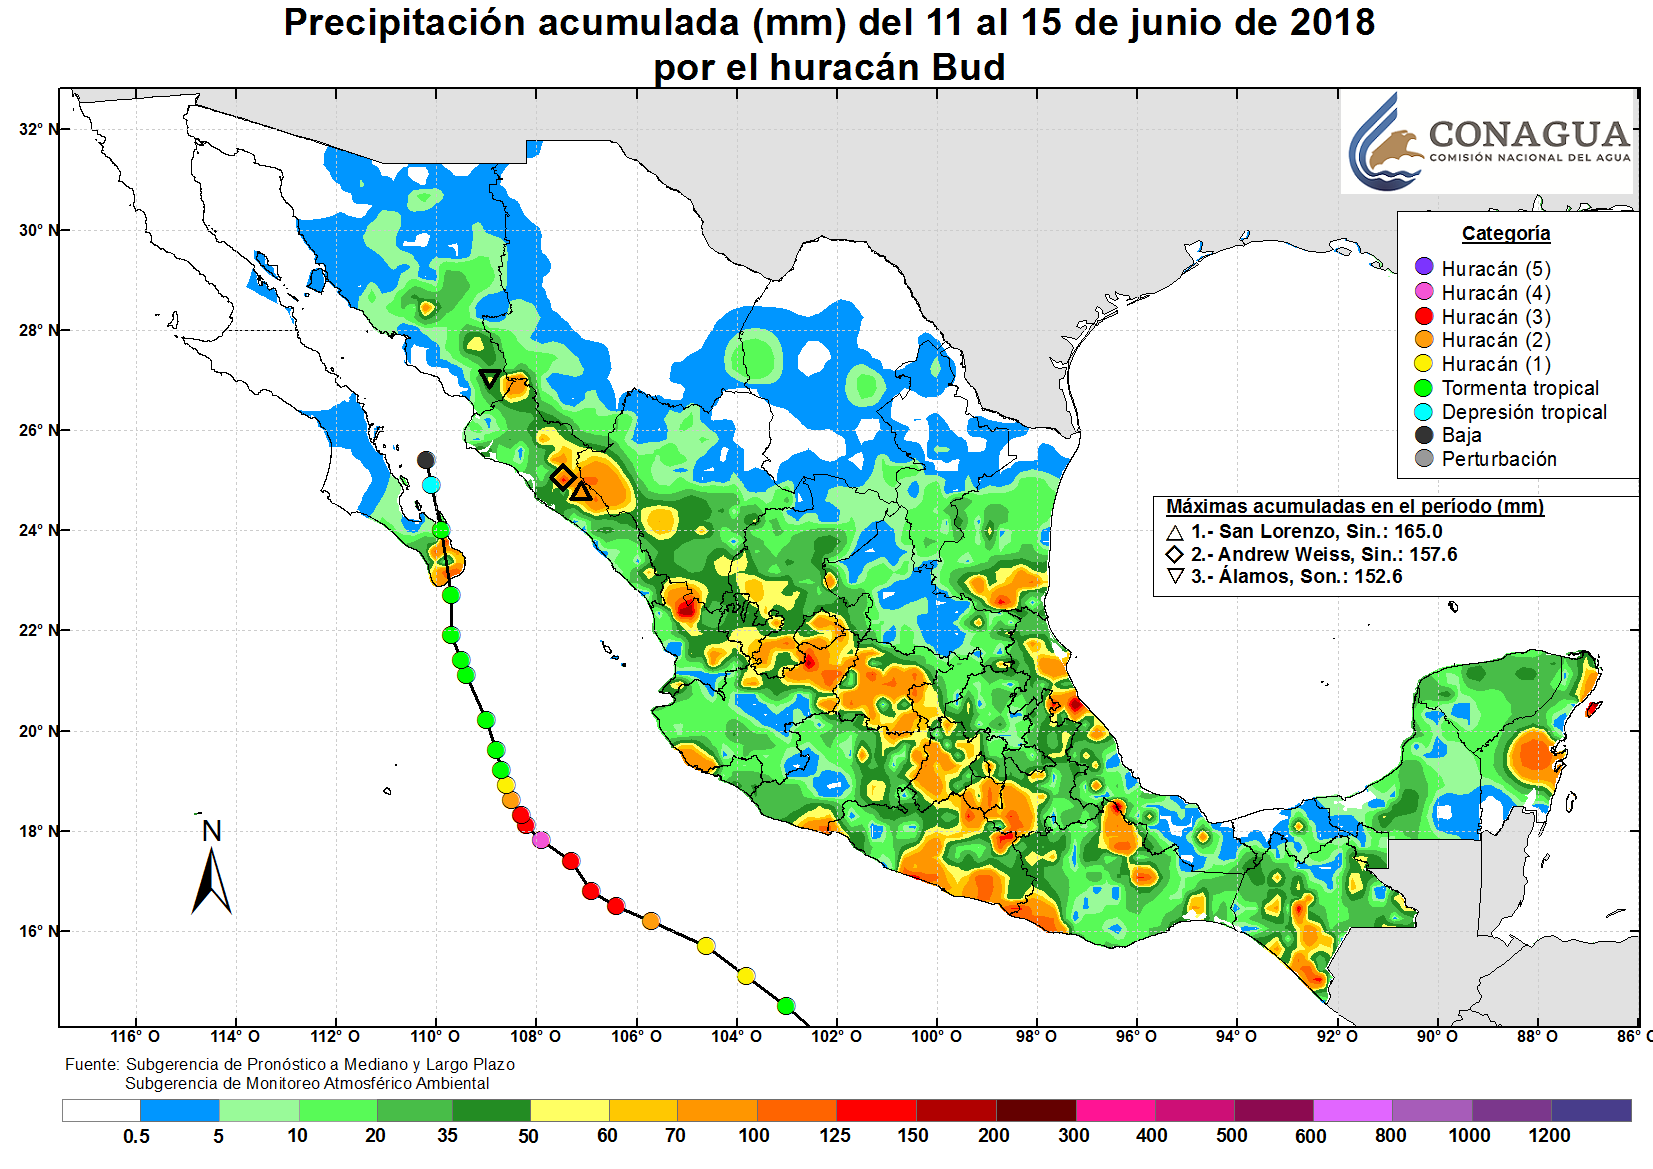
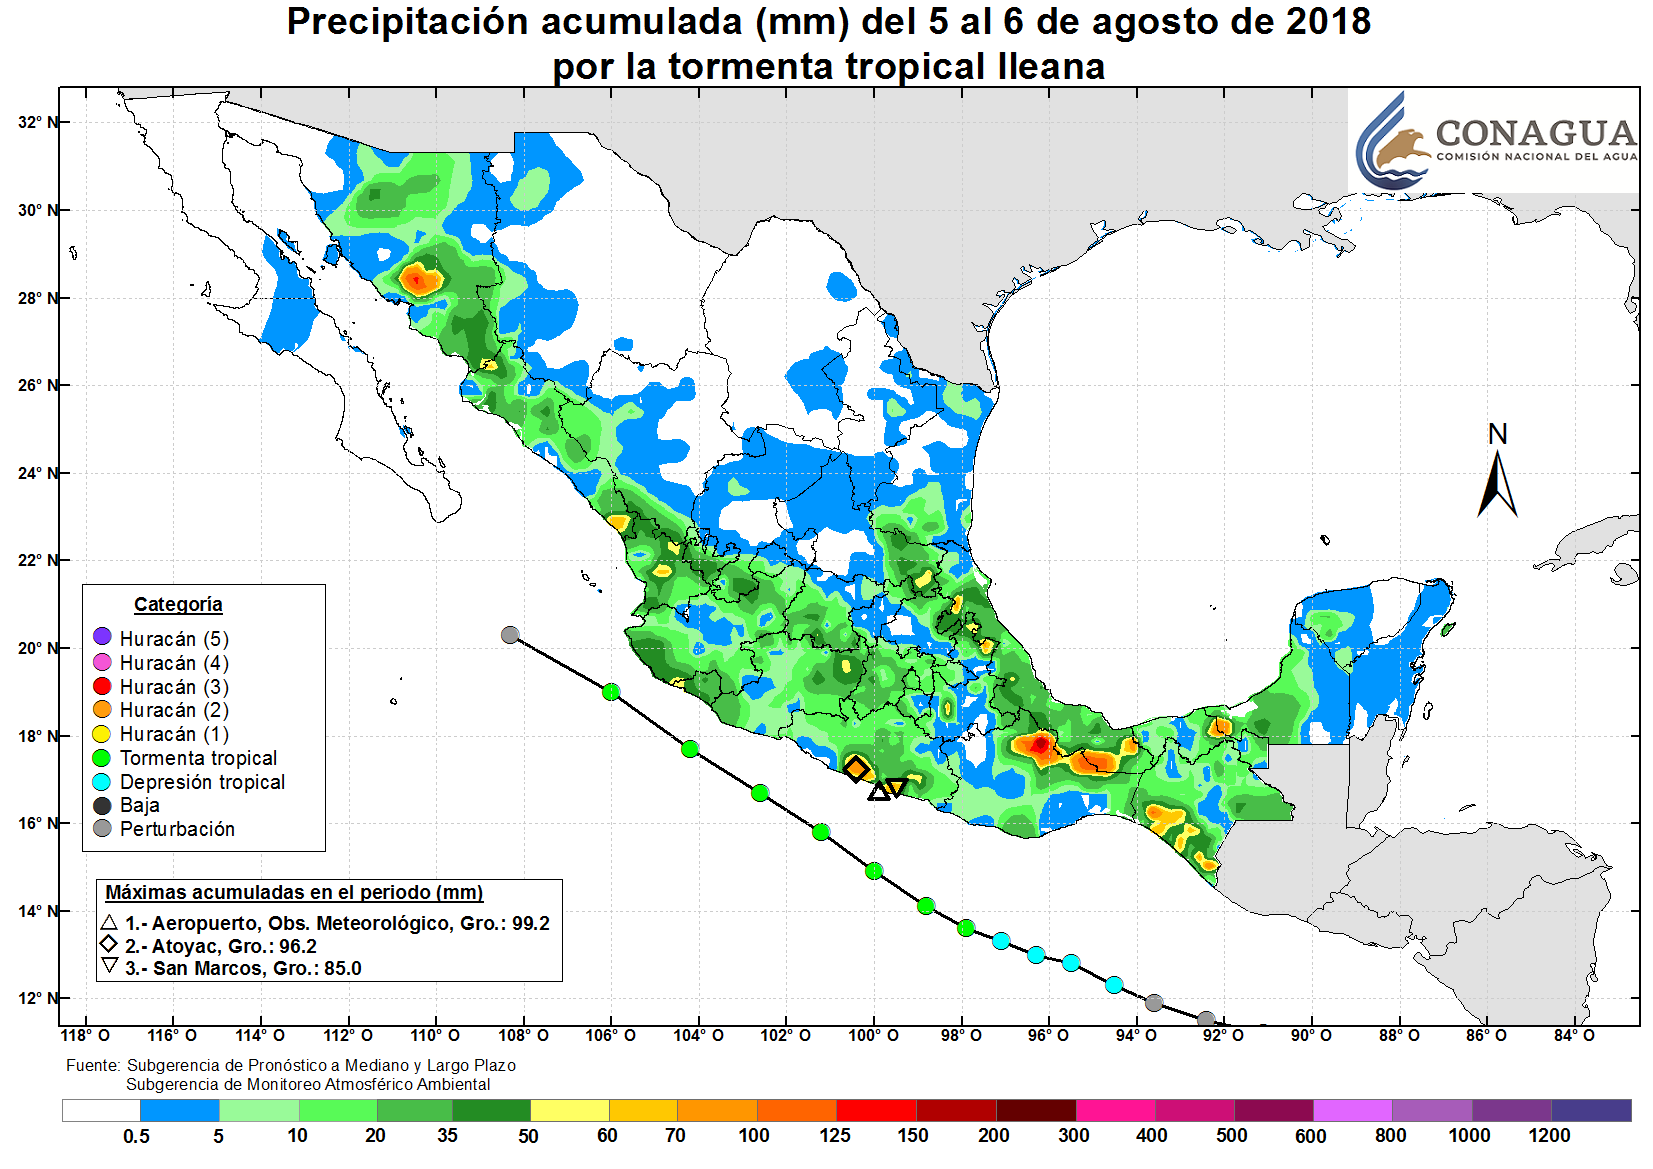
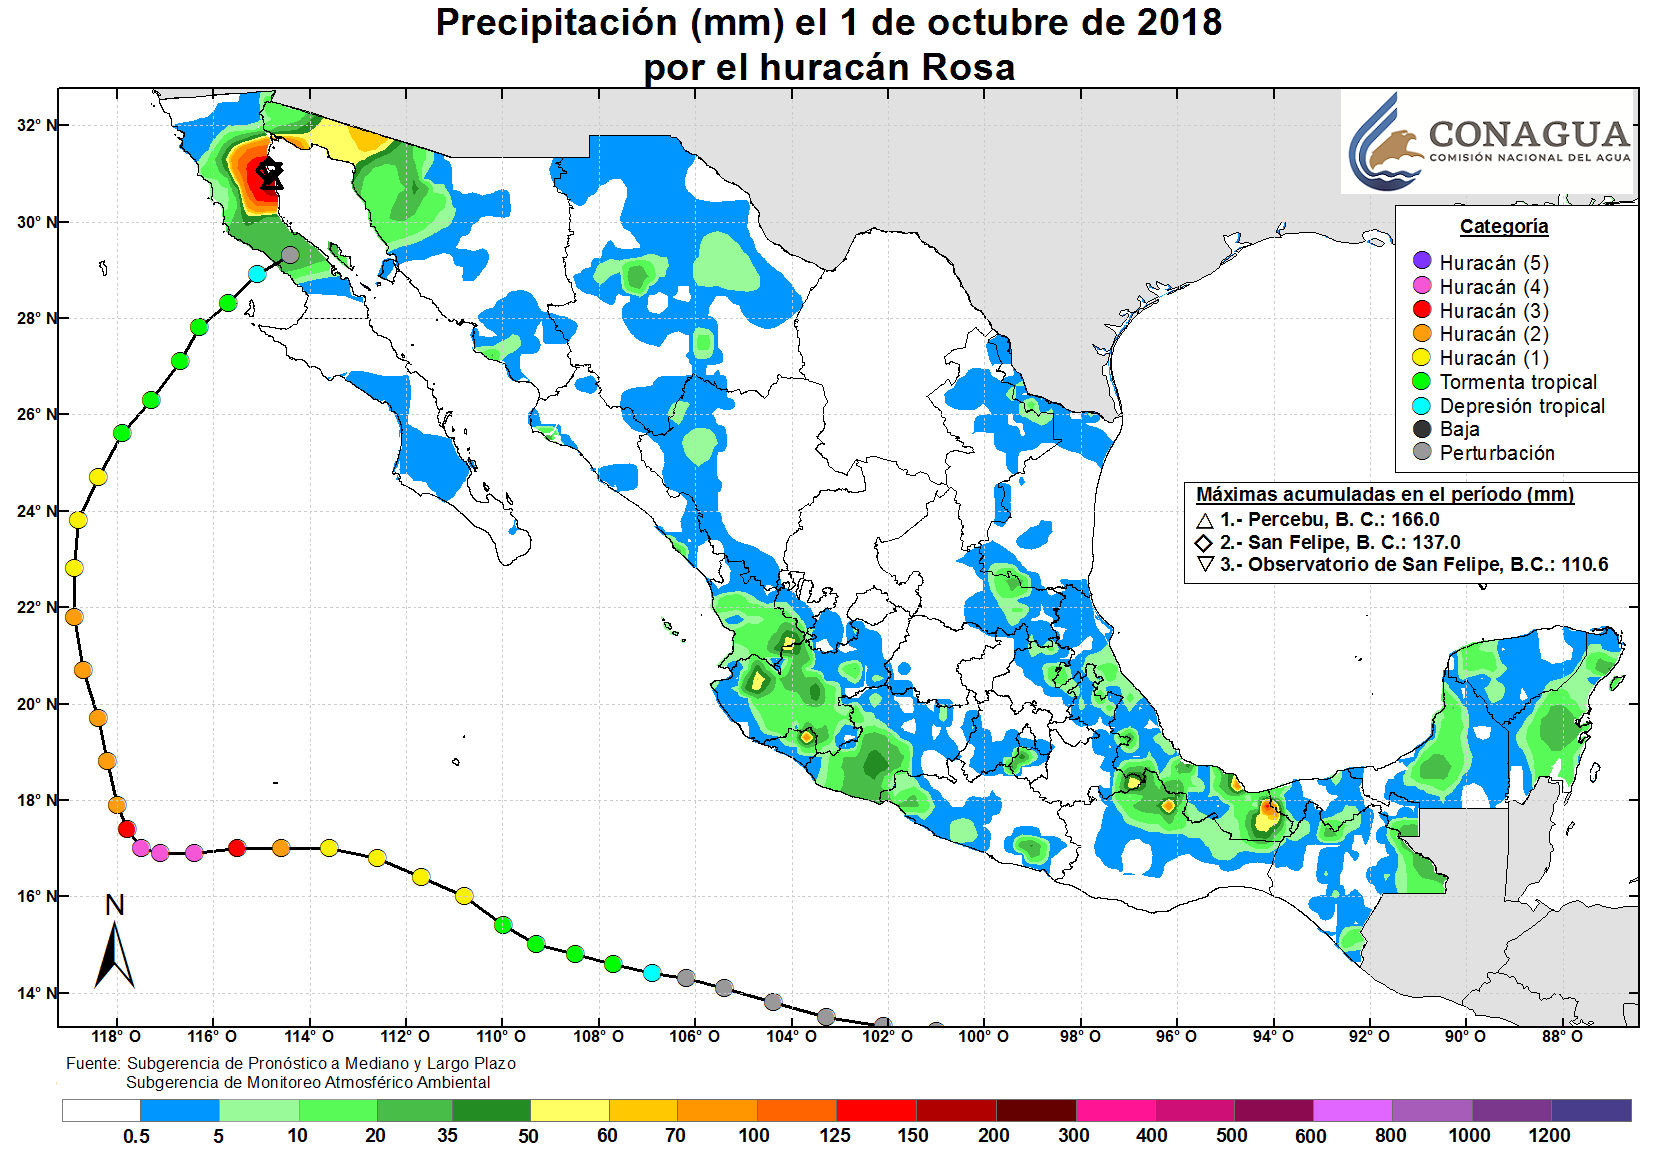
- 2018 Pacific hurricane season
- Pacific hurricane seasons
- Tropical cyclones in 2018