2018–19 South Pacific cyclone season
| 2018–19 South Pacific cyclone season | |
|---|---|
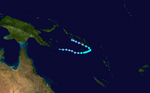
 Season summary map | |
| Seasonal boundaries | |
| First system formed | September 26, 2018 (record earliest) |
| Last system dissipated | May 21, 2019 |
| Strongest storm | |
| Name | Pola |
| • Maximum winds | 165 km/h (105 mph) (10-minute sustained) |
| • Lowest pressure | 950 hPa (mbar) |
| Seasonal statistics | |
| Total disturbances | 12, 1 unofficial |
| Total depressions | 9, 1 unofficial |
| Tropical cyclones | 5 |
| Severe tropical cyclones | 2 |
| Total fatalities | None |
| Total damage | $50 million (2018 USD) |
| Related articles | |
The 2018–19 South Pacific cyclone season was a below-average season that produced 5 tropical cyclones, 2 of which became severe tropical cyclones. The season officially runs from November 1, 2018 to April 30, 2019; however, a tropical cyclone could have formed at any time between July 1, 2018 and June 30, 2019 and would count towards the season total. During the season, tropical cyclones were officially monitored by the Fiji Meteorological Service, Australian Bureau of Meteorology, and New Zealand's MetService. The United States Armed Forces through the Joint Typhoon Warning Center (JTWC) also monitored the basin and issued warnings for American interests. RSMC Nadi attaches a number and an F suffix to tropical disturbances that form in or move into the basin, while the JTWC designates significant tropical cyclones with a number and a P suffix. The FMS, the BoM and MetService all use the Australian Tropical Cyclone Intensity Scale and estimate wind speeds over a period of ten minutes, while the JTWC estimates sustained winds over a 1-minute period, which are subsequently compared to the Saffir–Simpson hurricane wind scale (SSHWS).
Seasonal forecasts[]
| Source/Record | Tropical Cyclone |
Severe Tropical Cyclone |
Ref |
|---|---|---|---|
| Record high: | 1997–98: 16 | 1982–83: 10 | [1] |
| Record low: | 2011–12: 3 | 2008–09: 0 | [1][2] |
| Average (1969–70 – 2017–18): | 7.1 | — | [2] |
| NIWA October | 7-11 | 4 | [3] |
| Fiji Meteorological Service | 7-9 | 2-4 | [2] |
| Region | Chance of above average |
Average number |
Actual activity |
| Western South Pacific | 53% | 7 | 6 |
| Eastern South Pacific | 43% | 4 | 4 |
| Source:BOM's South Pacific Tropical Cyclone Season Outlook.[4] | |||
Ahead of the cyclone season formally starting, the Fiji Meteorological Service (FMS), Australian Bureau of Meteorology (BoM), New Zealand's MetService and National Institute of Water and Atmospheric Research (NIWA) and various other Pacific Meteorological services, all contributed towards the Island Climate Update tropical cyclone outlook that was released during October 2018.[3] The outlook took into account the ENSO neutral conditions that had been observed across the Pacific and analogue seasons that had ENSO neutral and El Niño conditions occurring during the season.[3] The outlook called for a near-average number of tropical cyclones for the 2018–19 season, with seven to eleven named tropical cyclones, predicted to occur between 135°E and 120°W compared to an average of about 10.[3] At least three of the tropical cyclones were expected to intensify further and become severe tropical cyclones, while it was noted that a Category 5 severe tropical cyclone could occur during the season.[3]
In addition to contributing towards the Island Climate Update outlook, the FMS and the BoM issued their own seasonal forecasts for the South Pacific region.[2][4] The BoM issued two seasonal forecasts for the Southern Pacific Ocean, for their self-defined eastern and western regions of the South Pacific Ocean.[4] They predicted that the Western region between 142.5°E and 165°E, had a 48% chance of seeing activity above its average of 7 tropical cyclones. The BoM also predicted that the Eastern Region between 165°E and 120°W, had a 55% chance of seeing activity above its average of 4 tropical cyclones.[4] Within their outlook the FMS predicted that between seven and nine tropical cyclones, would occur within the basin compared to an average of around 7.1 cyclones.[2] At least two of the tropical cyclones were expected to intensify further and become Category 3 or higher severe tropical cyclones.[2]
Both the Island Climate Update and the FMS tropical cyclone outlooks assessed the risk of a tropical cyclone affecting a certain island or territory.[2][3] The Island Climate Update Outlook predicted that the Austral Islands, American Samoa, the Cook Islands and Samoa had an elevated chance, while the Northern Cook Islands had a normal to elevated chance of being impacted by a tropical cyclone.[3] They also predicted that Fiji, Niue, Papua New Guinea, Tonga, Tokelau, Tuvalu, Wallis and Futuna, the Society and the Solomon Islands all had a near-normal risk of being impacted.[3] The outlook noted that Vanuatu and New Caledonia had a normal to reduced risk of being impacted by multiple tropical cyclones while it was considered unlikely that the Pitcairn Islands, Kiribati and parts of French Polynesia such as the Marquesas Islands and the Tuamotu Archipelago would be impacted by a tropical cyclone.[3] The FMS's outlook predicted that Tuvalu, Wallis and Futuna, Tokelau, Samoa, Niue, the Cook, Society and Austral Islands had an increased chance of being impacted by a tropical cyclone.[2] Their outlook also predicted that the Solomon Islands, Vanuatu, Fiji, Tonga, the Pitcairn Islands and Tuamotu Archipelago and the Gambier Islands had a normal chance of being impacted by a tropical cyclone.[2] It was also noted that New Caledonia had a reduced chance of being affected by a tropical cyclone, while tropical cyclone activity near Kiribati and the Marquesas Islands was considered unlikely.[2] It was thought by the FMS that there was an increased risk of Wallis & Futuna, the Cook, Society and the Austral Islands being impacted by at least one severe tropical cyclone, while other areas such as Fiji, New Caledonia, Niue, the Solomon Islands, Tokelau, Samoa, Tonga and Niue had a normal to reduced chance of being impacted by a severe tropical cyclone.[2]
Seasonal summary[]

This section needs expansion. You can help by . (December 2020) |
Systems[]
Tropical Cyclone Liua[]
| Category 1 tropical cyclone (Australian scale) | |
| Tropical storm (SSHWS) | |
  | |
| Duration | September 26 (Entered basin) – September 28 (Exited basin) |
|---|---|
| Peak intensity | 75 km/h (45 mph) (10-min) 994 hPa (mbar) |
A disturbance which initially formed in the Australian region basin crossed into the South Pacific basin on September 26 and strengthened, and was designated as Tropical Depression 01F by RSMC Nadi.[5] Late on September 26, the storm intensified into a tropical cyclone, and was given the name Liua. Liua is the earliest-forming named tropical cyclone in the South Pacific basin since reliable records began, surpassing Cyclone Lusi in 1997.[6]
Tropical Depression 03F[]
| Tropical depression (Australian scale) | |
  | |
| Duration | December 28 – January 1 |
|---|---|
| Peak intensity | 55 km/h (35 mph) (10-min) 998 hPa (mbar) |
During December 28, the FMS reported that Tropical Disturbance 03F had developed within a trough of low pressure, about 685 km (425 mi) to the east of Honiara in the Solomon Islands.[7] The disturbance was located within a favourable environment for further development to the south of an upper-level ridge, while deep atmospheric convection persisted over the systems elongated low-level circulation.[7][8] During the next day, as the organisation of the system improved, the FMS relocated the system to be located near the Solomon Island of San Cristobal.[9] The system subsequently moved eastwards through Temotu Province and gradually developed further, before it was classified as a tropical depression during December 30.
Tropical Cyclone Mona[]
| Category 2 tropical cyclone (Australian scale) | |
| Tropical storm (SSHWS) | |
  | |
| Duration | December 31 (Entered basin) – January 7 |
|---|---|
| Peak intensity | 95 km/h (60 mph) (10-min) 985 hPa (mbar) |
Mona entered this basin as a tropical low from the Australian region basin. The system then intensified into Tropical Depression 04F on January 3. Later that day, it intensified into a Category 1 cyclone on the Australian scale. On January 7, the system dissipated. About 2,000 people took shelter in 40 evacuation centers over the weekend, and thirty roads were closed, mostly due to floods and some landslides. People in the Lau group have been warned to expect gale-force and heavy rain as Mona tracked south, before arching south west over Fiji over the next 24 hours.[10]
Tropical Disturbance 05F[]
| Tropical disturbance (Australian scale) | |
  | |
| Duration | December 31 – January 2 |
|---|---|
| Peak intensity | Winds not specified 998 hPa (mbar) |
Tropical Depression 06F[]
| Tropical depression (Australian scale) | |
  | |
| Duration | February 3 – February 9 |
|---|---|
| Peak intensity | Winds not specified 994 hPa (mbar) |
On February 3, Tropical Depression 06F formed to the north of Fiji. The system moved in a south-easterly direction and was predicted to reach Category 1 status while the system was located to the NNW of Niua Fo'ou Island. However, due to strong wind shear and cool air flowing from the south of the system, 06F was not named. Tonga was largely affected by TD 06F. On the island, gale-force winds flattened banana plantations and crops, especially the casava plant. The system disrupted schools and transportation. All schools were cancelled on Friday, February 8 and all sea and air transportation was disrupted.
On Saturday, the Cyclone Alert and Gale warning that was issued for Tonga regarding TD 06F was lifted. However, another Tropical Cyclone Formation Alert was issued together with new warnings was issued regarding the thread from TD 07F (which later become Neil) which recently formed north of Fiji. TD 06F was one of 4 tropical systems to directly impact the island nation (the others are Tropical Cyclone Neil, Tropical Depression 08F and Tropical Depression 10F) within 1 week.
Tropical Cyclone Neil[]
| Category 1 tropical cyclone (Australian scale) | |
| Tropical storm (SSHWS) | |
  | |
| Duration | February 8 – February 10 |
|---|---|
| Peak intensity | 65 km/h (40 mph) (10-min) 994 hPa (mbar) |
On February 8, a tropical low developed into Tropical Depression 07F. The system intensified into a Category 1 tropical cyclone on February 9, 2019, and was assigned the name Neil. The system reached its peak intensity later that day with 10-minute sustained winds of 65 km/h (40 mph). On February 10, Neil weakened into a tropical depression, before dissipating soon afterward. Tonga issued warnings for Neil while it was active, but lifted those warnings once the storm weakened. No structural damage was reported from the storm.[11]
Tropical Depression 08F[]
| Tropical depression (Australian scale) | |
  | |
| Duration | February 10 – February 13 |
|---|---|
| Peak intensity | Winds not specified 996 hPa (mbar) |
Severe Tropical Cyclone Oma[]
| Category 3 severe tropical cyclone (Australian scale) | |
| Category 1 tropical cyclone (SSHWS) | |
  | |
| Duration | February 11 (Entered basin) – February 22 |
|---|---|
| Peak intensity | 130 km/h (80 mph) (10-min) 974 hPa (mbar) |
On February 7, a tropical low developed within an active monsoon trough, along the coast of Vanuatu.[12]
The low crossed into the South Pacific Basin and began intensifying into a tropical cyclone on February 11, earning the name Oma, and quickly reaching Category 2 tropical cyclone intensity.
It then strengthened into a severe tropical cyclone on February 15, reaching its initial peak intensity on February 16, as a Category 3 tropical cyclone on the Australian region scale. Oma then briefly weakened on February 17, before it restrengthened into a severe tropical cyclone and reached its peak intensity on February 19. Oma exited the South Pacific basin and returned to the Australian Region as a tropical cyclone on February 21. Oma weakened to a Category 2 tropical cyclone while approaching the Australian coast. On February 22, Tropical Cyclone Oma crossed over into the South Pacific basin once again. Late on February 22, Oma transitioned into an subtropical cyclone, while turning to the northeast. For the next several days, Oma continued drifting northeastward, weakening further into a subtropical depression on February 25. On February 27, Oma turned eastward, while situated over Vanuatu, and the storm subsequently dissipated on February 28.
Persistent heavy rain, damaging surf, and strong winds battered the northern provinces of Malampa, Sanma, Torba in Vanuatu for several days. Storm surge inundated coastal communities on February 17, extending up to 50 m (160 ft) inland in some areas. Multiple traditionally constructed homes were destroyed while flooding from swollen rivers washed out roads. The strong winds downed trees across the affected region. Communications with Torba were disrupted, with authorities unable to reach the Torres Islands.[13]
Damaging winds up to 140 km/h (87 mph) and heavy rain from the cyclone had battered New Caledonia, leaving thousands of residents without power and isolating some villages.[14] Agriculture was particularly hard-hit with losses reported in all provinces. The French government declared a state of calamity, directed at agriculture, for the entire island which freed ₣150 million (US$1.43 million) for recovery.[15]
Oma sunk a bulk carrier near the Solomon Islands, and it resulted in an oil spill. The cleaning cost were about US$50 million.[16]
Tropical Depression 10F[]
| Tropical depression (Australian scale) | |
  | |
| Duration | February 11 – February 13 |
|---|---|
| Peak intensity | Winds not specified 996 hPa (mbar) |
Severe Tropical Cyclone Pola[]
| Category 4 severe tropical cyclone (Australian scale) | |
| Category 3 tropical cyclone (SSHWS) | |
  | |
| Duration | February 23 – March 2 |
|---|---|
| Peak intensity | 165 km/h (105 mph) (10-min) 950 hPa (mbar) |
During February 23, the FMS reported that Tropical Disturbance 11F had developed, about 525 km (325 mi) to the northwest of Apia, Samoa. The system gradually organized while slowly moving southward. Situated in an environment with sea surface temperatures of 28-30 degrees Celsius and low vertical wind shear, the system intensified into Tropical Cyclone Pola on February 26. Later that day, Pola intensified into a Category 2 tropical cyclone, before becoming a severe tropical cyclone on February 27. On February 28, the system reached its peak intensity, as a Category 4 tropical cyclone on the Australian scale, with 10-minute sustained winds of 105 mph (170 km/h) and a minimum central pressure of 950 hPa (mbar). On March 1, Pola began to weaken while turning eastward, as a result of cooler sea surface temperatures and shear from a high-pressure system over New Zealand. Early on March 2, Pola weakened into a subtropical depression, before dissipating later that day.
Tropical Depression 12F[]
| Tropical depression (Australian scale) | |
  | |
| Duration | May 16 – May 21 |
|---|---|
| Peak intensity | 55 km/h (35 mph) (10-min) 1002 hPa (mbar) |
On May 16, the FMS started tracking a disturbance for possible cyclone development north of Fiji, in an environment of moderate wind shear and sea surface temperatures of 30 °C (86 °F). By May 18, the FMS classed the system as a tropical depression, giving it the identifier 12F, and they forecast the system to reach tropical cyclone intensity within 12–24 hours, and to ultimately attain 10-minute sustained winds of 85 km/h (55 mph). Later the same day, 12F began to move towards the southeast, and the FMS reported that the system was unlikely to intensify further, due to moderately-high wind shear in the area.
Other systems[]
During November 11, the FMS reported that Tropical Disturbance 02F had developed about 340 km (210 mi) to the north-northeast of Honiara in the Solomon Islands.[17] At this stage the system was located within an area of low vertical windshear, while deep convection surrounding the system's low level circulation was poorly organised. Over the next few days, the system's organization slightly improved as it moved south-eastwards, before it was last noted during November 16, while located about 575 km (355 mi) to the northeast of Port Vila in Vanuatu.
On May 7, the Bureau of Meteorology (BOM) reported that a weak tropical low had developed within a low-pressure trough, to the east of the Solomon Islands.[18] Over the next couple of days, the system gradually moved south-westwards and moved into the Australian region during May 10, where it later developed into a Category 2 tropical cyclone, and received the name Ann from the BOM.
Season effects[]
This table lists all the storms that developed in the South Pacific to the east of longitude 160°E during the 2018–19 season. It includes their intensity on the Australian tropical cyclone intensity scale, duration, name, landfalls, deaths, and damages. All data is taken from the FMS and/or MetService, and all of the damage figures are in 2018 USD.
| Name | Dates active | Peak classification | Sustained wind speeds |
Pressure | Areas affected | Damage (USD) |
Deaths | Refs |
|---|---|---|---|---|---|---|---|---|
| Liua | September 26–28 | Category 1 tropical cyclone | 75 km/h (45 mph) | 994 hPa (29.35 inHg) | Solomon Islands | None | 0 | |
| 02F | November 11–16 | Tropical disturbance | Not specified | 1003 hPa (29.62 inHg) | Solomon Islands | None | 0 | |
| 03F | December 28 – January 1 | Tropical depression | 55 km/h (35 mph) | 998 hPa (29.47 inHg) | Solomon Islands, Fiji | None | 0 | |
| Mona | December 31 – January 7 | Category 2 tropical cyclone | 95 km/h (60 mph) | 985 hPa (29.09 inHg) | Solomon Islands, Fiji | Minimal | 0 | |
| 05F | December 31 – January 2 | Tropical disturbance | Not specified | 998 hPa (29.47 inHg) | Rotuma | None | 0 | |
| 06F | February 3–9 | Tropical depression | Not specified | 994 hPa (29.35 inHg) | Wallis and Futuna, Fiji, Tonga | None | 0 | |
| Neil | February 8–10 | Category 1 tropical cyclone | 65 km/h (40 mph) | 994 hPa (29.35 inHg) | Wallis and Futuna, Fiji, Tonga | None | 0 | |
| 08F | February 10–13 | Tropical depression | Not specified | 996 hPa (29.41 inHg) | Fiji, Tonga | None | 0 | |
| Oma | February 11–22 | Category 3 severe tropical cyclone | 130 km/h (80 mph) | 974 hPa (28.76 inHg) | Solomon Islands, Vanuatu, New Caledonia | $50 million | 0 | |
| 10F | February 11–13 | Tropical depression | Not specified | 996 hPa (29.41 inHg) | Wallis and Futuna, Fiji | None | 0 | |
| Pola | February 23 – March 2 | Category 4 severe tropical cyclone | 165 km/h (105 mph) | 950 hPa (28.05 inHg) | Wallis and Futuna, Fiji, Tonga | |||
| Ann | May 7–18 | Category 2 tropical cyclone | 95 km/h (60 mph) | 993 hPa (29.09 inHg) | Solomon Islands, New Caledonia | None | 0 | |
| 12F | May 16–21 | Tropical depression | 55 km/h (35 mph) | 1002 hPa (29.59 inHg) | None | None | 0 | |
| Season aggregates | ||||||||
| 13 systems | September 26 – May 21 | 165 km/h (105 mph) | 950 hPa (28.05 inHg) | $50 million | 0 | |||
See also[]
- List of off-season South Pacific tropical cyclones
- Tropical cyclones in 2018 and 2019
- List of South Pacific cyclone seasons
- Atlantic hurricane seasons: 2018, 2019
- Pacific hurricane seasons: 2018, 2019
- Pacific typhoon seasons: 2018, 2019
- North Indian Ocean cyclone seasons: 2018, 2019
- 2018–19 South-West Indian Ocean cyclone season
- 2018–19 Australian region cyclone season
References[]
- ^ Jump up to: a b Climate Services Division (October 26, 2010). Tropical Cyclone Guidance for Season 2010/11 for the Fiji and the Southwest Pacific (PDF) (Report). Fiji Meteorological Service. Archived from the original (PDF) on February 27, 2012. Retrieved October 17, 2016.
- ^ Jump up to: a b c d e f g h i j k "2018–19 Tropical Cyclone Season Outlook [in the] Regional Specialised Meteorological Centre Nadi – Tropical Cyclone Centre (RSMC Nadi – TCC) Area of Responsibility (AOR)" (PDF). Fiji Meteorological Service. October 23, 2018. Archived (PDF) from the original on October 23, 2018. Retrieved October 23, 2018.
- ^ Jump up to: a b c d e f g h i "Southwest Pacific Tropical Cyclone Outlook - October 2018". National Institute of Water and Atmospheric Research. October 11, 2018. Archived from the original on October 23, 2018. Retrieved October 11, 2018.
- ^ Jump up to: a b c d National Climate Centre (October 11, 2018). "South Pacific Tropical Cyclone Outlook for 2018 to 2019". Australian Bureau of Meteorology. Retrieved October 11, 2018.
- ^ "Tropical Disturbance Advisory Number A1". RSMC Nadi. 2018-09-26. Archived from the original on 2018-09-26. Retrieved 2018-09-26.
- ^ "Liua becomes earliest tropical cyclone on record to form in the South Pacific Ocean". Accuweather.com. Archived from the original on 28 September 2018. Retrieved 28 September 2018.
- ^ Jump up to: a b Tropical Disturbance Summary December 28, 2018 21z (Report). Fiji Meteorological Service. December 28, 2018.
- ^ Significant Tropical Weather Advisory for the Western and South Pacific Oceans December 28, 2019 21z (Report). United States Joint Typhoon Warning Center. December 28, 2019.
- ^ Tropical Disturbance Summary December 29, 2018 04z (Report). Fiji Meteorological Service. December 29, 2018.
- ^ https://www.radionz.co.nz/international/pacific-news/379628/fiji-largely-escapes-as-cyclone-mona-heads-off
- ^ https://www.radionz.co.nz/international/pacific-news/382127/tropical-cyclone-neil-weakens-tonga-lifts-warning
- ^ "Eastern Region Tropical Cyclone Outlook". Bureau of Meteorology. 7 February 2019. Archived from the original on 25 January 2019. Retrieved 7 February 2019.
- ^ "Cyclone Oma strengthens to a category 3". Radio New Zealand. February 17, 2019. Retrieved February 17, 2019.
- ^ "Cyclone Oma en Nouvelle-Calédonie : Philippe Gomès fait appel à la solidarité de l'État" (in French). France Télévisions. February 19, 2019. Retrieved February 27, 2019.
- ^ Françoise Tromeur (February 27, 2019). "Le cyclone Oma est reconnu calamité agricole sur toute la Calédonie" (in French). France Télévisions. Retrieved February 27, 2019.
- ^ Lisa Martin (March 8, 2019). "Solomon Island oil spill clean-up could cost $50m, experts say". The Guardian. Retrieved March 28, 2019.
- ^ Tropical Disturbance Summary November 11, 2018 23z (Report). November 11, 2018. Archived from the original on November 13, 2018. Retrieved November 13, 2018.
- ^ "Eastern Region Tropical Cyclone Outlook". Australian Bureau of Meteorology. May 8, 2019. Archived from the original on May 8, 2019. Retrieved 8 May 2019.
External links[]
| Wikimedia Commons has media related to 2018-19 South Pacific cyclone season. |
- World Meteorological Organization
- Australian Bureau of Meteorology
- Fiji Meteorological Service
- New Zealand MetService
- Joint Typhoon Warning Center
| show Tropical cyclones of the 2018–19 South Pacific cyclone season |
|---|

- 2018–19 South Pacific cyclone season
- South Pacific cyclone seasons
- Tropical cyclones in 2018
- Tropical cyclones in 2019