1985 Pacific hurricane season
| 1985 Pacific hurricane season | |
|---|---|
 Season summary map | |
| Seasonal boundaries | |
| First system formed | June 5, 1985 |
| Last system dissipated | November 21, 1985 |
| Strongest storm | |
| Name | Rick |
| • Maximum winds | 145 mph (230 km/h) (1-minute sustained) |
| • Lowest pressure | 951 mbar (hPa; 28.08 inHg) |
| Seasonal statistics | |
| Total depressions | 28 |
| Total storms | 24 |
| Hurricanes | 13 |
| Major hurricanes (Cat. 3+) | 8 |
| Total fatalities | 1 indirect |
| Total damage | $1 million (1985 USD) |
| Related articles | |
The 1985 Pacific hurricane season is the third-most active Pacific hurricane season on record. It officially started on May 15, 1985, in the eastern Pacific, and on June 1, 1985, in the central Pacific, and lasted until November 30, 1985. These dates conventionally delimit the period of each year when most tropical cyclones form in the northeastern Pacific Ocean.[1] At the time, the 1985 season was the most active on record in the eastern north Pacific, with 28 tropical cyclones forming. Of those, 24 were named, 13 reached hurricane intensity, and 8 became major hurricanes by attaining Category 3 status or higher on the Saffir–Simpson scale. At that time, the 24 named storms was a record; however, this record was broken seven years later in 1992, and was therefore recognized as the second busiest season within the basin, until it was surpassed exactly thirty years later by the 2015 season.
Despite the activity, only one system made landfall in 1985. Hurricane Waldo caused moderate damage in Northwestern Mexico and one death in Kansas. Surf from Hurricanes Pauline and Rick caused minor damage in Hawaii. Hurricane Nele resulted in disruption in the Northwestern Hawaiian Islands, while Hurricane Ignacio threatened Hawaii, but only ended up producing light rainfall and minimal damage.
Seasonal summary[]

| Most intense Pacific hurricane seasons | ||
|---|---|---|
| Rank | Season | ACE |
| 1 | 2018 | 317 |
| 2 | 1992 | 295 |
| 3 | 2015 | 287 |
| 4 | 1990 | 245 |
| 5 | 1978 | 207 |
| 6 | 1983 | 206 |
| 7 | 1993 | 201 |
| 8 | 2014 | 199 |
| 9 | 1984 | 193 |
| 10 | 1985 | 192 |
| Overall reference for winds used to calculate ACE:[2] | ||
This year, 25 tropical cyclones formed in the eastern north Pacific (140°W to North America). Of those systems, three never strengthened beyond the depression stage, while 22 were named. This total was six storms above the 1966–1985 average[3] seven above the 1971–2006 average and nine above the 1949–2006 average of 13.[4] With a total 26 tropical cyclones and 24 named storms,[3][5] this season was the most active on record, breaking the short-lived record held by the 1983 Pacific hurricane season,[6] though the 1992 Pacific hurricane season surpassed this record. This season is now the third-most active, being recently also surpassed by the 2015 Pacific hurricane season, which is now the second-most active overall.[2]
Of the named systems, 10 peaked as tropical storms, 12 as hurricanes, and 8 reached the intensity of major hurricanes by attaining Category 3 strength or higher on the Saffir–Simpson hurricane wind scale. The season lasted 170 days, three days longer than the 1984 Pacific hurricane season, but still then days longer than normal. The Eastern Pacific Hurricane Center (EPHC) issued 620 bulletins during the season, 35 more than the previous season.[3] In the Central Pacific Hurricane Center's area of responsibility (140°W to the International Date Line), three tropical cyclones formed. One of those stayed as a tropical depression through its life. One strengthened into a hurricane, and another crossed into the northwestern Pacific before eventually returning to the central Pacific.[5]
Although meteorologists expected a below-normal season, the season got on to a fast start[7] though no storms formed in May. The activity picked up significantly thereafter, with five storms forming in June, including one major hurricane and was the most active month of June on record at the time, although this mark was tied in 2018.[2] By the middle of July, a total of 10 storms had formed[7] with another tropical storm forming off the coast of Central America roughly every 10 days.[8] Throughout July, a record seven named storms formed, although this mark was matched in 2015 and 2016.[2]
Within two more weeks, 13 tropical storms or hurricanes had formed, including 4 major hurricanes. By August 23, 2 more storms had been named. By early September, a total of 17 named storms had developed, 6 of which became hurricanes. Roughly two weeks later, two additional named storms were classified. After a lull in late September and early October, a total of 22 storms had formed by mid-October[2] 21 of which developed in the EPHC's area of responsibility and the list of names was exhausted, forcing the agency to request emergency names.[9]
The cause of the high activity in 1985 is unknown; however, this year continued a trend of above average seasons that began in 1982.[9] The hurricane season took place during a La Niña event,[10] which tends to inhibit Pacific hurricane activity.[11] However, 1985 was during a warm phase of the Pacific decadal oscillation[12] and in the middle of an era where all but the 1988 Pacific hurricane season were near or above average.[11]
Several storms were investigated by hurricane hunter aircraft in 1985;[3] the first was on July 24 during Hurricane Ignacio. On September 10, a flight was made into Hurricane Rick, where the storms lowest pressure was recorded.[5] Hurricane Sandra was investigated on September 12 on the way from Hawaii, where the hunters were on standby. The final two flights of the season were made on September 21 and 22 into Hurricane Terry while the storm was located off the west coast of the Baja California Peninsula. In addition to observations from Hurricane Hunter aircraft, the National Weather Service satellite station provided the basin with adequate satellite converge. The earlier loss of a GOES-East satellite and the move of a GOES-west satellite further west had little effect on EPHC operations. Enhanced infrared imagery was especially useful in determining cold-core centers.[3]
Even though the early season storms were no threat to land,[13] there were several notable storms during the season, with one writer describing the season as the "worst year ever".[9] The first storm of series of storms to affect Hawaii, Hurricane Ignacio produced 10 ft (3.0 m) to 15 ft (4.6 m) waves along south-facing beaches. However, rainfall from Ignacio was light. The second storm to affect the state, Tropical Storm Linda dropped heavy rainfall along the windward slopes of the island chain. In early September, Hurricane Pauline came close enough to require a hurricane watch, but the watch was discontinued when Pauline veered north. However, the storm did produce high waves, with amplitudes of 10 ft (3.0 m) to 15 ft (4.6 m) on the eastern side of Puna and Kau. Days later, Hurricane Rick generated high waves; however, the waves were not nearly as high as they were during Pauline. The final storm to affect Hawaii was Hurricane Nele.[5] Due to fears of a repeat from Hurricane Iwa, which struck during the 1982 Pacific hurricane season, a hurricane watch was issued.[14] Although the watch was discontinued when Nele veered west, it later re-curved and struck the Northwestern Hawaiian Islands, giving boats a rough night.[5]
The only storm to make landfall during the year was Hurricane Waldo.[3] Waldo destroyed hundreds of homes in Sinaloa and later produced significant rainfall across the Southwestern United States and Great Plains. One person was killed in Kansas.[9][15] In addition, two trop cyclones affected California. The first, Tropical Storm Guillermo, helped firefighters put out fires during mid-July.[16] The second, Tropical Storm Nora, brought light rainfall to the northern portion of the state in late August.[3]
Systems[]
Tropical Storm Andres[]
| Tropical storm (SSHWS) | |
  | |
| Duration | June 5 – June 12 |
|---|---|
| Peak intensity | 70 mph (110 km/h) (1-min) |
On June 1, an area of thunderstorms south of Acapulco developed. It increased in size and, by June 5, was organized enough to be considered a tropical depression. The depression was upgraded to a tropical storm shortly after thereafter. While the Monthly Weather Review reported that Tropical Storm Andres operationally started out as a tropical depression.[17] the HURDAT database does not give Andres an initial depression stage.[2] Andres headed west, and two days after formation, it reached its maximum intensity of 70 mph (110 km/h) while located south of the Baja California Peninsula. It then slowly weakened as it moved around a weak upper-level high. It weakened to a depression on June 8. The low stayed a depression as it continued west until it dissipated on June 12 as the cyclone gradually increased in speed.[17]
Hurricane Blanca[]
| Category 3 hurricane (SSHWS) | |
  | |
| Duration | June 6 – June 16 |
|---|---|
| Peak intensity | 120 mph (195 km/h) (1-min) |
Blanca originated from a tropical disturbance south of Nicaragua. A tropical depression formed on June 6 south of the Mexican coast. Shortly thereafter, it strengthened and was upgraded to Tropical Storm Blanca. By June 8, the EPHC reported that Blanca had intensified into a hurricane.[3] Blanca fluctuated in intensity for several days, but Blanca did not intensify into a major hurricane, Category 3 or higher, until June 13. After reaching its peak intensity that day with winds of 120 mph (195 km/h) later that day, Hurricane Blanca began to weaken. It held on to hurricane strength until June 14, when the agency reported that Hurricane Blanca had fallen to tropical storm intensity. Steadily weakening, Blanca deteriorated into a tropical depression, before dissipating on June 16.[2]
As a precaution, maritime operations were closed in the western states of Colima, Guerrero and Michoacán. Travel on the high seas and along the coast was also restricted.[18]
Tropical Storm Carlos[]
| Tropical storm (SSHWS) | |
  | |
| Duration | June 7 – June 10 |
|---|---|
| Peak intensity | 40 mph (65 km/h) (1-min) |
Carlos originated from a tropical disturbance moving that was moving westward along the northern edge of the Intertropical Convergence Zone (ITCZ). The wave developed into the third tropical cyclone of the season at 1800 UTC on June 7. Due to weak steering currents, the depression moved north and then south, which subsequently resulted in a very small cyclonic loop. By 0000 UTC on June 10, the depression was upgraded to a Tropical Storm Carlos; at the time, the storm also attained its maximum sustained winds of 40 mph (65 km/h). However, six hours later, Carlos weakened back to a tropical depression. Thereafter, the storm accelerated somewhat, and quickly merging with the remnants of Tropical Storm Andres at 1800 UTC on June 10.[3]
Hurricane Dolores[]
| Category 3 hurricane (SSHWS) | |
  | |
| Duration | June 26 – July 5 |
|---|---|
| Peak intensity | 115 mph (185 km/h) (1-min) |
A disturbance located south of the Gulf of Tehuantepec moved westward along 10°N between June 24 and June 25. After interacting with an upper trough, the disturbance strengthened, and by the following day, it developed into the fourth tropical depression of the season at 0600 UTC. The depression steadily intensified and was upgraded to Tropical Storm Dolores late on June 27. Dolores strengthened further while tracking west-northwestward around the southern end of a deep layer ridge. By 1800 UTC on June 28, the storm had reached hurricane intensity. Thereafter, Dolores continued to steadily deepen, and by 0600 UTC on July 1, the storm peaked as a 115 mph (185 km/h) Category 3 hurricane. However, due to colder sea surface temperatures and increasing vertical wind shear, Dolores quickly weakened, and by early on July 2, it was downgraded to a tropical storm. Later that day, the storm further weakened to a tropical depression. At around 1800 UTC on July 5, Dolores dissipated.[3]
Tropical Storm Enrique[]
| Tropical storm (SSHWS) | |
  | |
| Duration | June 27 – July 5 |
|---|---|
| Peak intensity | 40 mph (65 km/h) (1-min) |
Enrique began as a tropical disturbance in the ITCZ[3] west of the larger and very intense Hurricane Dolores.[5] Moving west over 81 °F (27 °C) water, the system was designated as a tropical depression on June 27. Shortly thereafter, it intensified Tropical Storm Enrique. Turning west-northwest, the storm moved over slightly warmer water. Despite this, Enrique never strengthened beyond 40 mph (65 km/h) winds, and entered the CPHC's warming responsibility on July 1. Turning west beneath a ridge,[3] Enrique rapidly weakened to tropical depression status.[2] On July 4, the shallow and weak system turned slightly south of west. Enrique had dissipated by July 5. Despite its weak intensity, moisture carried by the system caused a few localized heavy showers on the windward side of the Big Island of Hawaii on July 5 and over the Kona slopes throughout the night hours of July 5 and 6.[5]
Tropical Storm Fefa[]
| Tropical storm (SSHWS) | |
  | |
| Duration | July 2 – July 6 |
|---|---|
| Peak intensity | 70 mph (110 km/h) (1-min) |
A tropical disturbance moved westward across the warm sea surface temperatures of the Gulf of Tehuantepec on July 1. At 1200 UTC on the following day, the disturbance was classified as Tropical Depression Six, while centered about 215 miles (346 km) south of Acapulco. Early on July 3, the depression was upgraded to Tropical Storm Fefa, while moving parallel to the Pacific coast of Mexico. Fefa approached hurricane status and peaked as a 70 mph (110 km/h) tropical storm at 0000 UTC on July 4. However, thereafter, the storm began weakening as a short-wave trough in the westerlies moved into northern Mexico, which caused increased wind shear on Tropical Storm Fefa. Additionally, colder sea surface temperatures over the west coast of the Baja California Peninsula further weakened Fefa. By 1800 UTC on July 6, Fefa dissipated. At the time of dissipation, the low while located about 170 miles (270 km) east of La Paz.[3]
Tropical Storm Guillermo[]
| Tropical storm (SSHWS) | |
  | |
| Duration | July 7 – July 12 |
|---|---|
| Peak intensity | 60 mph (95 km/h) (1-min) |
The origins of Guillermo were from a tropical disturbance that formed within 300 mi (485 km) south of the Gulf of Tehuantepec. Moving rapidly west-northwest over moderately warm water, the disturbance was classified as a tropical depression. At this time, the depression was centered 270 mi (435 km) south of Acapulco on July 7. Roughly 24 hours later, the storm intensified slightly, enough to warrant an upgraded into Tropical Storm Guillermo. Tropical Storm Guillermo moved northwest at almost 15 mph (30 km/h) around the southwest side of a high pressure area over Central Mexico. Passing 50 mi (80 km) north of Socorro Island, Guillermo attained its maximum intensity of 60 mph (95 km/h) during the evening of July 9.[3]
Shortly after its peak, Guillermo began to weaken rapidly due to a combination of strong wind shear and 77 °F (25 °C) waters. By 1800 UTC, most of the thunderstorm activity had dissipated and only a weak low-pressure area remained. Based on this, Guillermo was downgraded into a tropical depression. Finally, Guillermo turned west and ceased to exist as a tropical cyclone on July 12.[3] The remnants of the storm brought light rainfall to the mountains and valleys of California, helping re-fill dry reservoirs and put out large fires.[16]
Tropical Storm Hilda[]
| Tropical storm (SSHWS) | |
  | |
| Duration | July 18 – July 20 |
|---|---|
| Peak intensity | 40 mph (65 km/h) (1-min) |
Tropical Depression Nine developed at 0000 UTC on July 18. Initially, the depression tracked northward due to weak southerly flow associated with an upper-level high centered near the southern tip of Baja California Sur. By 0000 UTC on July 19, the depression was upgraded to Tropical Storm Hilda; the storm reached its maximum sustained winds of 40 mph (65 km/h) at this time. Thereafter, Hilda turned westward. Due to sea surface temperatures of only 75 °F (24 °C), Hilda began to weaken and it dissipated on 1200 UTC July 20.[3]
Hurricane Jimena[]
| Category 4 hurricane (SSHWS) | |
  | |
| Duration | July 20 – July 29 |
|---|---|
| Peak intensity | 130 mph (215 km/h) (1-min) |
Jimena originated from a tropical wave that moved across Central America and southern Mexico on July 18 and 19. Located along the northern edge of the ITCZ, a tropical depression formed by July 20. Initially moving west, the depression turned west-northwest and was upgraded into Tropical Storm Jimena early on July 21. Jimena attained hurricane intensity two days later. Hurricane Jimena remained a Category 1 hurricane for roughly another day, only to undergo a burst of intensification[2] despite being above marginally warm ocean temperatures. The storm attained peak wind speed of 130 mph (210 km/h) while located roughly 600 mi (965 km) southwest of Cabo San Lucas.[3]
After maintaining peak intensity for 12 hours, Jimena turned northwest, and respectively began a slow decline. Jimena fell below hurricane status on 1800 UTC July 26. Tropical Storm Jimena was downgraded into a tropical depression late on July 27. Jimena was no longer considered a tropical cyclone by July 29, as its center had dissipated over fairly cold water.[3]
Hurricane Ignacio[]
| Category 4 hurricane (SSHWS) | |
  | |
| Duration | July 21 – July 27 |
|---|---|
| Peak intensity | 130 mph (215 km/h) (1-min) 960 mbar (hPa) |
A tropical depression was spotted early on July 21 while located 1,623 mi (2,612 km) southwest of San Diego. Situated over warm waters, the depression attained tropical storm intensity a couple hours later.[3] Ignacio reached winds of 70 mph (110 km/h) on July 22, roughly 24 hours after formation, and subsequently entered the CPHC's warning zone. A Hurricane Hunter aircraft investigated Ignacio at daybreak on July 22, and thus upgraded Ignacio into hurricane status. Continuing to rapidly intensify, a Hurricane Hunter aircraft discovered that Hurricane Ignacio had reached its peak wind speed of 130 mph (215 km/h) and an estimated central pressure of 960 mbar (28 inHg).[5] Operationally, Ignacio was believed to have peaked as a Category 5 hurricane.[19] Shortly after its peak, the environment was rapidly becoming less conductive. By the evening on July 24, Ignacio was no longer a major hurricane.[5] The hurricane resumed its westerly course, and Ignacio was re-assessed as a tropical storm on July 26. Passing south of the island chain, Ignacio dissipated on July 27.[5]
On July 24, a high surf advisory was issued for east-facing shores of Hawaii;[20] subsequently, a hurricane watch was issued the next day for the Big Island.[5] Roughly 24 hours after the watch was issued, it was cancelled[5] though a small craft advisory remained in effect for the Hawaiian Islands.[21] Ignacio resulted in 10 ft (3.0 m) to 15 ft (4.6 m) surf, peaking midday on July 25. Rainfall from the storm was generally light[5] though many secondary roads that lead to the beaches were closed.[21][22]
Tropical Storm Kevin[]
| Tropical storm (SSHWS) | |
  | |
| Duration | July 29 – August 6 |
|---|---|
| Peak intensity | 65 mph (100 km/h) (1-min) |
A tropical wave crossed the Gulf of Tehuantepec on July 27 and developed into a tropical depression at 0000 UTC on July 29. While tracking west-northwestward between 7 and 11 mph (11 and 18 km/h), the depression slowly intensified, and was upgraded to Tropical Storm Kevin at 1800 UTC on July 31. Crossing marginally warm sea surface temperatures, Kevin maintained tropical storm intensity while tracking westward. However, by August 5, vertical wind shear began increasing, which was generated by an upper-level trough. As a result, Kevin weakened to a tropical depression at 0600 UTC on August 6 and dissipated 12 hours later.[3]
Tropical Storm Linda[]
| Tropical storm (SSHWS) | |
  | |
| Duration | July 29 – August 9 |
|---|---|
| Peak intensity | 50 mph (85 km/h) (1-min) |
A tropical wave formed on July 28 over fairly warm water. Moving west-northwest, the system was declared a tropical depression far from land the next day. It became Tropical Storm Linda later on July 29. A relatively weak cyclone, Linda peaked as a moderate tropical storm at 1200 UTC on July 31. Shortly after its peak, Tropical Storm Linda began to weaken over cooler waters and increased wind shear. Linda began to weaken and was downgraded into a tropical depression on August 2. Two days later, it passed into the CPHC's area of responsibility.[3]
Upon entering the warning zone, the tropical depression was moving slowly toward the northwest and within six hours, Tropical Depression Linda began to re-intensify. On August 4, the storm had regained tropical storm status. Subsequently, Linda reaches its secondary peak with winds of 45 mph (75 km/h). Linda remained a tropical storm for about 24 hours before it started to weaken again on August 5. It was downgraded to a tropical depression early the next day. Meanwhile, Linda turned west under the influence of northerly trade winds. The depression came within 150 mi (240 km) of South Point, Hawaii, before dissipating early on August 9. Some heavy showers associated with the outer rainband's of the low fell on the windward slopes of the Big Island of Hawaii and Maui, where rainfall totals of 5–10 in (130–250 mm) were recorded.[5]
Hurricane Marty[]
| Category 1 hurricane (SSHWS) | |
  | |
| Duration | August 6 – August 13 |
|---|---|
| Peak intensity | 75 mph (120 km/h) (1-min) |
A tropical disturbance crossed the coast of El Salvador and entered the Pacific Ocean on August 3. After moving westward over sea surface temperatures of 84 °F (29 °C), the disturbance developed into Tropical Depression Fourteen at 1800 UTC on August 6, while centered about 460 mi (740 km) southwest of Acapulco. While tracking west-northwestward at about 13 mph (21 km/h), the depression was upgraded to Tropical Storm Marty at 1200 UTC August 7. Further strengthening occurred and Marty became a hurricane on 0000 UTC August 9. However, after 18 hours as a hurricane, Marty weakened back to a tropical storm as it began tracking across colder sea surface temperatures. Early on August 13, Marty weakened to a tropical depression and dissipated later that day at 1800 UTC.[3]
Tropical Storm Nora[]
| Tropical storm (SSHWS) | |
  | |
| Duration | August 19 – August 23 |
|---|---|
| Peak intensity | 45 mph (75 km/h) (1-min) |
A tropical disturbance detached from the ITCZ on August 18. While tracking across an area of sea surface temperatures of 81 °F (27 °C), the disturbance slowly intensified and the EPHC reported that the system had developed tropical depression at 1800 UTC on August 19. Initially, the depression remained weak, though by 1200 UTC on August 21, it was upgraded to Tropical Storm Nora. Thereafter, Nora turned northwestward toward a deep-layer low-pressure area offshore of California. During this time, the storm began to weaken due to a decrease in sea surface temperatures. Nora weakened back to a tropical depression on August 22. Nora began to dissipate at 1200 UTC August 23 over 73 °F (23 °C) waters. Meanwhile, low-level clouds began to enter the storm's circulation. The high-level outflow associated with the storm moved northward and then eastward, resulting in light rainfall in Northern California on August 22 and 23.[3]
Hurricane Olaf[]
| Category 1 hurricane (SSHWS) | |
  | |
| Duration | August 22 – August 31 |
|---|---|
| Peak intensity | 85 mph (140 km/h) (1-min) |
Olaf originated from a disturbed south of Acapulco on August 21 over extremely warm waters. Moving slowly west, the EPHC reported that a tropical depression formed on August 22. The depression attained tropical storm status the next day, and subsequently began to rapidly intensify. While turning northwest, Olaf became a hurricane 460 mi (740 km) south-southwest of La Paz. It headed west-northwest, and reached its peak intensity as a moderate Category 1 hurricane late on August 26, with winds of 85 mph (140 km/h).[3]
Hurricane Olaf then moved slowing towards the west beneath a ridge and into progressively cooler waters. Olaf weakened into a tropical storm on August 28, and then degenerated into a tropical depression the next afternoon. Tropical Depression Olaf suddenly turned north towards an upper-level through off the U.S. West Coast. However, hostile conditions caused the system to cease to exist as a tropical cyclone early on August 31 several hundred miles west-southwest of San Diego, California.[3]
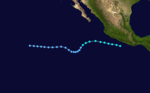
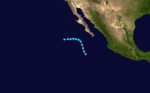
Hurricane Pauline[]
| Category 1 hurricane (SSHWS) | |
  | |
| Duration | August 27 – September 9 |
|---|---|
| Peak intensity | 85 mph (140 km/h) (1-min) |
A small, westward moving area of thunderstorm activity become the 17th cyclone of the season. Turning southwest between an upper-level high over Baja California and a low near the southern coast of Mexico, the depression intensified into Tropical Storm Pauline. Over the next couple of day, the cyclone turned west, and then west-northwest. Slowly strengthening despite underneath warm waters, Pauline attained hurricane intensity on September 7. Subsequently, Pauline turned towards the south. After peaking in intensity as a moderate Category 1 hurricane, the system crossed into the CPHC's area of responsibility.[3]
It remained at hurricane intensity for three days. Shortly thereafter, Pauline began to weaken and turn northwest away from Hawaii. Due to interaction with trough, the hurricane veered north into an environment of strong wind shear. The result was rapid weakening; Hurricane Pauline was downgraded to a tropical storm late on September 8 and a tropical depression well north of the islands the next day. Pauline ceased to exist as a tropical cyclone by the evening hours of September 9. However, the remnants of Pauline moved northwest into an area of low pressure of the Gulf of Alaska. A recognizable circulation in the low level flow was visible for several days as it drifted westward far to the north of the Hawaiian Islands.[5]
Hurricane Pauline threatened the islands enough to prompt the issuance of a hurricane watch on September 6. Around this time, officials drew plans to evacuate coastal residents[23] and 100,000 people were asked to make emergency preparations.[24] Instead, Pauline turned away from the islands and the watch was cancelled. However, Pauline did cause high surf along the east facing shores of all the Islands. up to 10–15 ft (3.0–4.6 m) surf was measured along the Big Island, Puna, and Kau coastlines. As a result, some roads were temporarily closed due to washed debris.[5]
Tropical Storm Skip[]
| Tropical storm (SSHWS) | |
  | |
| Duration | August 30 – September 8 |
|---|---|
| Peak intensity | 70 mph (110 km/h) (1-min) |
The origins of Skip were from a disturbance that passed well south of Hawaii in late August. The CPHC monitored the disturbance for several days and was classified as Tropical Depression Two-C on August 30. Two-C crossed the International dateline the next day and into the western Pacific. Initially moving west, the depression was upgraded into Tropical Storm Skip at 0900 UTC September 9. A Tropical Upper Tropospheric Trough then steered tip to the north and later towards the northeast. It underwent two strengthened phases. Skip reached typhoon intensity on two occasions, the first on September 1 and the second on September 7. The system subsequently recrossed the dateline as Skip was rapidly weakening and gaining extratropical features.[25] Shortly thereafter, Skip was declared extratropical despite still producing hurricane-force winds. The typhoon briefly threatened Wake Island.[5]
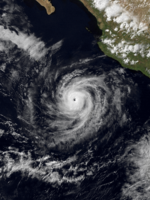
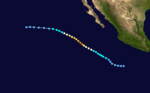
Hurricane Rick[]
| Category 4 hurricane (SSHWS) | |
  | |
| Duration | September 1 – September 12 |
|---|---|
| Peak intensity | 145 mph (230 km/h) (1-min) 951 mbar (hPa) |
A tropical wave that moved slowly westward over the warm waters south of Salina Cruz. Moving westward, the EPHC upgraded the low into Tropical Depression Eighteen on 0000 UTC September 1. The depression was upgraded into Tropical Storm Rick midday on September 2. Initially, further intensification was slow; the storm did not attain hurricane status until the low was located 1,000 mi (1,600 km) away from land.[3] After becoming a hurricane, Rick began to intensify more rapidly. Early the next day, the EPHC re-assessed the intensity of Rick to Category 4 status.[3] Shortly thereafter, Rick reached its peak intensity of 145 mph (235 km/h).[2] Operationally, it was believed to be much stronger, with winds of 145 mph (230 km/h), equivalent to Category 5 strength.[26]
Following a path similar to the one Pauline made a few days earlier, the powerful hurricane moved northwest. A weakening trend commenced on September 10; Hurricane Rick began to rapidly deteriorate. On September 11, Tropical Storm Rick merged with the same trough though weak low-level circulation persisted for several more days.[5] Early forecasts noted uncertainty in the storm's path and meteorologists noted the potential to be more of a threat to Hawaii than Pauline.[27] The hurricane approached the islands, coming close enough to require a high surf advisory.[28] Even though Hurricane Rick turned north sooner than Pauline, the surf did rise somewhat.[3]
Hurricane Sandra[]
| Category 3 hurricane (SSHWS) | |
  | |
| Duration | September 5 – September 17 |
|---|---|
| Peak intensity | 125 mph (205 km/h) (1-min) 972 mbar (hPa) |
During the late evening of September 4, a large intense area of thunderstorm activity formed near the Guatemala–El Salvador coast. The thunderstorm developed a circulation about 24 hours later, and was thus upgraded into a tropical depression a few hundred miles south of the Mexican coast. Turning west-northwest over 84 °F (29 °C) waters, the depression was upgraded into Tropical Storm Sandra early on September 7. By 0600 UTC September 8, winds had increased to75 mph (120 km/h), and Sandra was upgraded into a hurricane. Sandra turned west,[3] and quickly intensified, reaching Category 3 status later that day after bypassing the Category 2 stage.[2] On 0000 UTC September 9, Sandra peaked in intensity with winds of 125 mph (200 km/h).[3]
After moving towards the west for an additional 18 hours, it subsequently began a sharp turn northwest and later west-northwest due to an intensifying trough off the west coast of Baja California.[3] Meanwhile, Sandra slowly weakened.[2] At 1746 UTC September 12, a Hurricane Hunter aircraft intersected Hurricane Sandra after being on standby in Hawaii. The aircraft penetrated Sandra twice, reaching the 700 mbar (700.00 hPa; 20.67 inHg) level. It also measured surface winds of 75 mph (120 km/h) and a surface pressure of 972 mbar (972.00 hPa; 28.70 inHg). The eye was reportedly open to the west with low-level banding, and the eye was 37 mi (60 km) in diameter.[3]
Shortly after the flight, the cyclone then began to turn to the west and weaken further over 78 °F (26 °C) waters.[3] Sandra was downgraded into a tropical storm the next day; however, the storm briefly regained minimal hurricane status.[2] On 1800 UTC September 14, Sandra weakened back into a tropical storm roughly 600 mi (970 km) west of the Baja California Peninsula. Now over 77 °F (25 °C) sea surface temperatures,[3] Sandra weakened into a tropical depression on September 15[2] and dissipated two days later.[3]
Hurricane Terry[]
| Category 3 hurricane (SSHWS) | |
  | |
| Duration | September 15 – September 24 |
|---|---|
| Peak intensity | 115 mph (185 km/h) (1-min) |
A tropical wave moved through Nicaragua on September 14. Moving rapidly west over 86 °F (30 °C) warms, a circulation became evident and tropical depression developed at 1800 UTC September 15, the twentieth of the season. The system turned northwest; subsequently, the depression was upgraded into Tropical Storm Terry 24 hours after formation approximately 300 mi (480 km) south of Acapulco. Early on September 17, Terry attained hurricane status.[3] Terry quickly reached Category 2 status and briefly reached Category 3 intensity,[2] peaking with winds of 115 mph (185 km/h) on September 21 over 300 mi (485 km) south of Cabo San Lucas.[3]
Shortly after its peak, a cold trough moved southward into Baja California Norte. This steered Hurricane Terry northward into cooler waters. A U.S. Air Force weather reconnaissance aircraft investigated the weakening Terry on 1800 UTC September 21 and 22 while the storm was west-southwest of the peninsula. Two penetrations were made in both flights. The second flight suggested that the hurricane had a poorly defined eye. A combination of cooler water and increased wind shear took its toll on Terry. The system weakened into a tropical storm at 0600 UTC September 23 due west of the Baja California Peninsula, and a tropical depression early the following day. By 1800 UTC, Terry dissipated while its center dissipated 500 mi (800 km) west-southwest of San Diego.[3] The hurricane at one point in time was predicted to make landfall in central Baja California and threaten San Diego;[29] however, this did not occur.[3]
Tropical Storm Vivian[]
| Tropical storm (SSHWS) | |
  | |
| Duration | September 18 – September 21 |
|---|---|
| Peak intensity | 40 mph (65 km/h) (1-min) |
A disturbance emerged from the northern ITCZ on September 17. By 0600 UTC on the following day, it developed into a tropical depression. Initially, the depression tracked northwestward in response to a strong upper-level trough centered over northern Baja California. After crossing an area of sea surface temperatures in excess of 82 °F (28 °C), the depression was able to strengthen into Tropical Storm Vivian at 0000 UTC on September 20. Under the influence of Hurricane Terry and an upper-level high pressure, Vivian turned west, southwest, and eventually southward. While tracking to the south, the storm re-entered the ITCZ, which caused Vivian to weaken and become indistinguishable. Vivian was downgraded to a tropical depression on September 21, shortly before dissipating on 1800 UTC on that same day.[3]
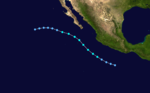
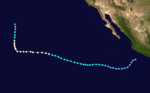
Hurricane Waldo[]
| Category 2 hurricane (SSHWS) | |
  | |
| Duration | October 7 – October 9 |
|---|---|
| Peak intensity | 105 mph (165 km/h) (1-min) 982 mbar (hPa) |
Tropical Depression Twenty-Three formed from a disturbance on October 7. In a favorable environment over warm waters, It rapidly intensified, reaching tropical storm intensity the same day it formed. Tropical Storm Waldo then began to turn to the north and while located 130 mi (210 km) south of Baja California Sur, Waldo was upgraded into a Category 1 hurricane. A trough started re-curving Waldo towards the Mexican coast. Shortly after peaking as a Category 2 hurricane, Waldo made landfall southwest of Culiacán. Waldo rapidly dissipated over land[3] and eventually merged with a cold front.[30]
Prior to the arrival of Waldo, the Mexican Army was put on standby in the event the Fuerte River flooded.[31] While no deaths or injuries were reported,[32] much farmland and 600 houses were destroyed.[3] The Juarez River bursts its banks, flooding at least eight neighborhoods in Culiacán. Telephone service in Los Mochis, Guarmuchil, and Guasave was cut when a communications tower was blown over.[31] A total of 10,000 people were left homeless across the state.[33]
In combination with a cold front, Waldo contributed to major flooding in Kansas that forced many rivers and creeks to overflow their banks. One indirect death was reported and roughly 15 people were evacuated from their homes in one town. In Kansas City, Waldo produced 1 ft (30 cm) of water on roads, but none of the nearby homes received extensive damage. The Sedgwick County, the county fire department freed 35 trapped people from rising flood waters.[15] Flash floods affected the southern one–third of New Mexico from rainfall associated from Waldo. Damage was estimated between $100,000–$1 million (1985 USD), mostly to crops, roads, and buildings.[34] In all, Waldo's rain was comparable to Atlantic Hurricane Gloria.[35]
Hurricane Nele[]
| Category 1 hurricane (SSHWS) | |
  | |
| Duration | October 23 – October 30 |
|---|---|
| Peak intensity | 90 mph (150 km/h) (1-min) 982 mbar (hPa) |
The origins of Nele were from a tropical disturbance to the south-southeast of Hawaii on October 20. The tropical disturbance developed into Tropical Depression Three-C while located south-southeast of Hawaii on October 23. Although difficult to observe on satellite imagery, the CPHC upgraded it to Tropical Storm Nele early on October 24. Continuing to intensify, the storm tracked northwestward, following a similar path to Hurricane Iwa in 1982 and Hurricane Nina in 1957. On October 25, Nele attained hurricane strength as it turned to the north. On October 26 it attained peak winds of 90 mph (145 km/h). It entered an area of weaker steering currents due to a nearby trough.[5] This caused concern for the CPHC, who noted that a continued path would result in the hurricane moving through the island chain.[36] Instead, Nele turned to the northwest at a steady pace and instead moved through the Hawaiian Leeward Islands, passing about 100 mi (160 km) west of French Frigate Shoals and very near Tern Island. Around that time, reconnaissance aircraft measured winds of 85 mph (140 km/h) and a pressure of 982 mbar (982.00 hPa; 29.00 inHg). After passing through the island chain, the storm finally weakened and accelerated towards the north. Nele re-curved to the northeast, transitioning into an extratropical cyclone on October 30.[5]
Due to fears of a repeat of Hurricane Iwa, a hurricane watch was issued for Hawaii.[5][14] Officials moved beach equipment away from the beach in preparation. About 24 hours after the hurricane watch was issued, it was dropped as Nele moved away from the islands, alongside the cancellation of a high surf advisory.[37] The hurricane produced 10 ft (3.0 m) waves along south-facing beaches.[38] Upon passing through the Leeward Islands, a weather station on Tern Island recorded winds of 34 mph (55 km/h) with gusts of 50 mph (80 km/h), along with a pressure of 1,000 mbar (1,000.00 hPa; 29.53 inHg). Many fishing boats spent a tough night at French Frigate Shoals due to high waves and seas. One vessel was partially disabled due to a broken rudder and required assistance from the U.S. Coast Guard. Another vessel reported winds of hurricane-force and 30 ft (9.1 m) to 40 ft (12 m). Other fishing vessels near Maro Reef and Laysan Island had an easier time as they were in the weaker left of the hurricane.[5]
Hurricane Xina[]
| Category 3 hurricane (SSHWS) | |
  | |
| Duration | October 25 – November 5 |
|---|---|
| Peak intensity | 115 mph (185 km/h) (1-min) |
Tropical Depression Twenty-Four developed at 0600 UTC on October 25, in the southwest quadrant of a quasi-stationary deep-layer mean anticyclone. The depression moved generally westward and slowly strengthened, becoming Tropical Storm Xina about 72 hours after becoming a tropical cyclone. Thereafter, the storm curved northwestward and gradually intensified, and by late on October 28, it was upgraded to a hurricane. Xina then rapidly deepened, peaking as a 115 mph (185 km/h) Category 3 hurricane at 1800 UTC on October 29. However, due to decreasing sea surface temperatures, Xina almost immediately began to weaken.[3]
Shortly thereafter, the storm curved eastward, later followed by a south-southwestward turned early on October 31. Later that day, Xina was downgraded to a tropical storm. At around 0600 UTC on November 1, the storm had further weakened to a tropical depression.[3] Xina briefly re-strengthened to a tropical storm at 0600 UTC on November 2, though it quickly weakened back to a tropical depression about six hours later.[2] After weakening back to a tropical depression, the circulation of Xina became very disorganized and difficult to locate. Early on November 4, the depression curved southwestward, and by 0600 UTC on November 5, Xina had dissipated.[3]
Tropical depressions[]
Of the four tropical cyclones that did not reach tropical storm strength, the first was a weak disturbance that began to develop in the northern Intertropical Convergence Zone on July 10. After convection increased and a circulation formed, the system was upgraded to Tropical Depression Eight at 1800 UTC on July 11. However, deep convection quickly began to diminish, and by early on the following day, the depression dissipated.[3]

The only tropical depression to develop in the CPHC's area of responsibility developed from a disturbance embedded in the trade wind flow south of the Hawaiian Islands that was about 35 mi (56 km) south of the Hawaiian Islands. A tropical depression was declared on August 20 as the system appeared to be intensifying while moving rapidly west-northwest. However, increased wind shear from a trough, an elongated area of low pressure, took toll on the storm and it weakened on August 21 near the Johnston Atoll. Due to the lack of a well-defined atmospheric circulation, the storm ceased to exist as a tropical cyclone two days after formation.[5]
An area of convection within the ITCZ developed into Tropical Depression Twenty-Two at 0000 UTC on October 1. However, the depression never separated from the ITCZ. Despite sea surface temperatures in excess of 82 °F (28 °C), the depression did not strengthen, and on the following day, the center became ill-defined and difficult to locate on satellite imagery. Convection began decreasing, and as a result, the depression is estimated to have dissipated at 1800 UTC on October 2. Over a month later, a weak disturbance located about 345 mi (555 km) southwest of the southern tip of Baja California Sur developed a circulation; the system was promptly classified as Tropical Depression Twenty-Five at 0600 UTC on November 21. The depression drifted slowly southward at 3 mph (4.8 km/h), shortly before curving west-southwestward. Thereafter, the depression turned north-northwestward and dissipated later on November 21.[3]
Storm names[]
The following names were used for named storms that formed in the eastern Pacific in 1985. No names were retired, so it was used again in the 1991 season, although the name Dolores was misspelled as Delores in 1991. This is the same list used for the 1979 season, except for the added names. Storms were named Kevin, Linda, Marty, Nora, Olaf, Rick, Sandra, Terry, Vivian, Waldo, and Xina for the first time in 1985.[39] The name Pauline was previously used in the 1961 and 1968 seasons respectively.
|
|
|
Because of the level of activity, these names were added during the season:[40] Later during the 80's, the added names were made a permanent part of the Eastern Pacific lists, and other names were added for even-numbered years, which were Xavier, Yolanda, and Zeke. All three names were first used in 1992, and Xavier was used a second time in 2018.[40]
|
|
|
One name from the Central Pacific list was used – Nele. It was the first usage for this name. One storm, Typhoon Skip, formed in the central Pacific but did not receive a name until it reached the west Pacific.[5]
|
|
|
|
See also[]
- List of Pacific hurricanes
- Pacific hurricane season
- 1985 Atlantic hurricane season
- 1985 Pacific typhoon season
- 1985 North Indian Ocean cyclone season
- Southern Hemisphere tropical cyclone seasons: 1984–85, 1985–86
References[]
- ^ Dorst, Neal. "When is hurricane season?". Atlantic Oceanographic and Meteorological Laboratory. Archived from the original on December 6, 2010. Retrieved November 25, 2010.
- ^ a b c d e f g h i j k l m n o p National Hurricane Center; Hurricane Research Division; Central Pacific Hurricane Center. "The Northeast and North Central Pacific hurricane database 1949–2019". United States National Oceanic and Atmospheric Administration's National Weather Service. Retrieved 1 October 2020. A guide on how to read the database is available here.
- ^ a b c d e f g h i j k l m n o p q r s t u v w x y z aa ab ac ad ae af ag ah ai aj ak al am an ao ap aq ar as at au av Gunther, Emil B.; R.L. Cross (October 1986). "Eastern North Pacific Tropical Cyclones of 1985". Monthly Weather Review. 114 (10): 1931–1949. Bibcode:1986MWRv..114.1931G. doi:10.1175/1520-0493(1986)114<1931:ENPTCO>2.0.CO;2.
- ^ Blake, Eric S; Gibney, Ethan J; Brown, Daniel P; Mainelli, Michelle; Franklin, James L; Kimberlain, Todd B; Hammer, Gregory R (2009). Tropical Cyclones of the Eastern North Pacific Basin, 1949-2006 (PDF). Archived from the original on July 28, 2013. Retrieved June 14, 2013.
- ^ a b c d e f g h i j k l m n o p q r s t u v w x "The 1985 Central Pacific Tropical Cyclone Season". Central Pacific Hurricane Center. Retrieved October 1, 2011.
- ^ Gunther & Cross 1932
- ^ a b "Signs in Atlantic, Pacific point to Active Hurricane Season". The Dallas Morning News. July 20, 1985.
- ^ Kirkman, Don (July 25, 1985). "Hurricane signs point to big season". Pittsburgh Press. Retrieved June 30, 2012.
- ^ a b c d "Hurricanes hitting the southwest, they do". The Lewiston Journal.
- ^ "Historical El Nino/La Nina episodes (1950-present)". Climate Prediction Center. Retrieved September 29, 2012.
- ^ a b "NOAA: 2011 Eastern Pacific Hurricane Season Outlook". Climate Prediction Center. Archived from the original on June 6, 2011. Retrieved June 9, 2011.
- ^ "Variability of rainfall from tropical cyclones in Northwestern Mexico" (PDF). ejournal. Atmosfera: 8. 2008. Archived from the original (PDF) on June 16, 2015. Retrieved October 30, 2011.
- ^ Kirkman, Don (July 25, 1985). "Hurricane signs point to big season". Pittsburgh Press. Retrieved June 30, 2012.
- ^ a b "Hurricane Nele aims for Hawaii, Juan stirs up Gulf". Star-News. October 26, 1985. Retrieved October 2, 2011.
- ^ a b "One killed in flooding across the state". Junction City Daily Union. October 11, 1985. Retrieved July 23, 2011.
- ^ a b "Hills Still Smoldering, but Fire 90% Contained". San Jose Mercury News. July 13, 1985.
- ^ a b Gunther & Cross 1935-6
- ^ "Some Pacific Ports Close in Storm Precaution". Associated Press. June 12, 1985.
- ^ "Hawaii spared from hurricane". The Pittsburgh Press. United Press International. July 26, 1985. Retrieved July 24, 2012.
- ^ "Hawaii Preparing For Hurricane Ignacio". Orlando Sentinel. United Press International. Retrieved July 24, 2012.
- ^ a b "Hurricane Ignacio Down to Tropical Storm Status". Associated Press. June 26, 1985. Retrieved July 24, 2012.
- ^ "Hurricane's 10-foot Waves Strike Hawaii". San Jose Mercury News. July 26, 2012.
- ^ "Pauline to pass Hawaii". The Evening Independent. Associated Press. September 7, 1985. Retrieved July 12, 2012.
- ^ "Hurricane nears Hawaii". Sunday Tribune. Associated Press. September 7, 1985. Retrieved July 12, 2012.
- ^ Pao-Shin Chu; Peng Wu (2008). Climatic Atlas of Tropical Cyclone Tracks over the Central North Pacific (PDF) (Report). University of Hawaii-Manoa. Retrieved August 2, 2015.
- ^ "Hurricane Rick veers away from Hawaii". Lodi News-Sentinel. United Press International. September 11, 1985. Retrieved July 4, 2012.
- ^ "Hurricane threat eases". Times Daily. September 8, 1985. Retrieved July 4, 2012.
- ^ "Severe hurricane near Hawaii". Lawrence Journal-World. Associated Press. September 10, 1985. Retrieved July 4, 2012.
- ^ Nancy, Reed (September 20, 1985). "Sunny Skies Due Back--at Least Today". Los Angeles Times. Retrieved July 3, 2012.
- ^ Roth, David M. "Hurricane Waldo" (GIF). Hydrometeorological Prediction Center. Retrieved 2009-03-06.
- ^ a b "Hurricane Waldo Floods Mexico". Gettysburg Times. October 10, 1985. p. 3.
- ^ "Hurricane damage slight". Pittsburgh Post-Gazette. October 11, 1985. Retrieved July 23, 2011.
- ^ "Hurricane hits Mexican coast". Eugene Register-Guard. October 9, 1985. Retrieved October 23, 2010.
- ^ "Storm Data October 1985" (PDF). 27 (10). National Climatic Data Center: 25. Archived from the original (PDF) on March 20, 2013. Retrieved March 26, 2012. Cite journal requires
|journal=(help) - ^ "Hurricanes hitting Southwest They do?". The Lewiston Journal. October 15, 1985. Retrieved July 23, 2012.
- ^ "Hurricane Nearing Hawaii". Record-Journal. October 27, 1985. Retrieved October 2, 2011.
- ^ "Hurricane Nele veers away from Hawaiian Islands". Gainesville Sun. October 28, 1985. Retrieved October 2, 2011.
- ^ "From Wire Reports". The Atlanta Journal and The Atlanta Constitution. October 27, 1985. pp. A/13.
- ^ "Eastern North Pacific Tropical Cyclone Name History". Atlantic Tropical Weather Center. Archived from the original on September 29, 2007. Retrieved February 28, 2013.
- ^ a b Padgett, Gary (February 2002). "Monthly Global Tropical Cyclone Summary". Archived from the original on September 27, 2007. Retrieved October 14, 2007.
External links[]
- CPHC Season Summary
- Unisys Weather archive for the Eastern Pacific, 1985
- ATCR for Tropical Storm/Typhoon Skip
Tropical cyclones of the 1985 Pacific hurricane season | ||||||||||||||||||||||||||||||||||||||||||||||||||||||||||
|---|---|---|---|---|---|---|---|---|---|---|---|---|---|---|---|---|---|---|---|---|---|---|---|---|---|---|---|---|---|---|---|---|---|---|---|---|---|---|---|---|---|---|---|---|---|---|---|---|---|---|---|---|---|---|---|---|---|---|
 |
| |||||||||||||||||||||||||||||||||||||||||||||||||||||||||
| ||||||||||||||||||||||||||||||||||||||||||||||||||||||||||
- 1985 Pacific hurricane season
- Pacific hurricane seasons
- Tropical cyclones in 1985