1978 Pacific hurricane season
| 1978 Pacific hurricane season | |
|---|---|
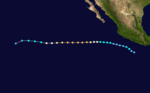
 Season summary map | |
| Seasonal boundaries | |
| First system formed | May 30, 1978 |
| Last system dissipated | October 21, 1978 |
| Strongest storm | |
| Name | Fico, Hector, and Norman |
| • Maximum winds | 140 mph (220 km/h) (1-minute sustained) |
| • Lowest pressure | 955 mbar (hPa; 28.2 inHg) |
| Seasonal statistics | |
| Total depressions | 23 official, 2 unofficial |
| Total storms | 19 |
| Hurricanes | 14 |
| Major hurricanes (Cat. 3+) | 7 |
| Total fatalities | 4 |
| Total damage | $301 million (1978 USD) |
| Related articles | |
The 1978 Pacific hurricane season was the first Pacific hurricane season to use both masculine and feminine names for tropical cyclones and the first season to use the modern 6-year naming lists, although this was the fourth list of six; the first list was used the following year. It officially began May 15, 1978, in the eastern Pacific, June 1, 1978, in the central Pacific, and officially ended on November 30, 1978. These dates conventionally delimit the period of time when tropical cyclones form in the eastern north Pacific Ocean.
Activity this year was slightly above-average, with eighteen named storms forming. Five of those were tropical storms, thirteen were hurricanes, and six were major hurricanes that reached Category 3 or higher on the Saffir–Simpson scale. In the Central Pacific, a tropical depression and a major hurricane formed. Also, this season is the fourth-most active season within the basin when calculating by ACE Index, as the season had an index of 207. Atlantic Hurricane Greta crossed into the basin and was renamed Olivia. The 1978 Pacific Hurricane Season was the first season on record to have an ACE total at least 200; it rests at 207 units.
Seasonal summary[]
Activity during the 1978 season began on May 30 and ended on October 20. It was a very busy season, with 19 named tropical storms. Fourteen of those storms developed into hurricanes, while seven of those fourteen hurricanes further intensified into major hurricanes, a Category 3 or stronger storm on the Saffir–Simpson scale. In addition to the official cyclones, several unofficial tropical depressions were documented.[1] Within the confines of the Central Pacific basin, 13 tropical cyclones or their remnants were observed by forecasters at the Central Pacific Hurricane Center, a record number of occurrences at the time.[2] In May, Hurricane Aletta became one of three cyclones to move onshore during the season. It was succeeded by the formations of Tropical Storm Bud and hurricanes Carlotta and Daniel in June, all of which remained offshore. In July, consecutive major hurricanes – Fico, Gilma, and Hector – in addition to Tropical Storm Emilia formed. Fico became the longest-lived hurricane and longest-tracked hurricane on record in the Central Pacific at the time. Hurricanes Iva, John, Kristy, Miriam, and Norman, plus Tropical Storm Lane, developed in August. September was comparatively quieter, harboring Hurricane Olivia and Tropical Storm Paul. October saw the genesis of Hurricane Rosa and Tropical Storm Sergio in the East Pacific,[1] in addition to Hurricane Susan in the Central Pacific, one of the strongest hurricanes on record at the time there.[3]

Systems[]
Hurricane Aletta[]
| Category 1 hurricane (SSHWS) | |
  | |
| Duration | May 30 – May 31 |
|---|---|
| Peak intensity | 75 mph (120 km/h) (1-min) |
A small tropical disturbance, originating within the Intertropical Convergence Zone (ITCZ) across the Caribbean Sea,[4] in the Gulf of Tehuantepec on May 27. The system increased in both size and organization over the coming days,[1] and it was upgraded to Tropical Storm Aletta around 12:00 UTC on May 30.[5] Tracking northwest, the system continued to intensify over warm ocean waters, and an eye became evident on satellite. This development coincided with a ship report of 75 mph (120 km/h) winds,[1] and Aletta strengthened into the season's first hurricane by 00:00 UTC on May 31.[5] The system subsequently weakened as it curved north-northwest ahead of an upper-level trough over northwestern Mexico, and it made landfall about 50 mi (75 km) west of Zihuatanejo, Guerrero, at 17:30 UTC on May 31.[5] Aletta transitioned to an extratropical cyclone about six hours later before it degenerated to a disturbance over southwestern Mexico on June 1.[1]
Tropical Storm Bud[]
| Tropical storm (SSHWS) | |
  | |
| Duration | June 17 – June 20 |
|---|---|
| Peak intensity | 60 mph (95 km/h) (1-min) |
The season's second tropical cyclone began as a disturbance spawned by an African tropical wave southwest of the Mexico coastline on June 15.[4] It moved generally westward over very warm waters, and observations from satellite imagery and ships outlined the formation of a tropical depression by 00:00 UTC on June 17.[1] Six hours later, the depression intensified into Tropical Storm Bud.[5] Continued ship observations relayed Bud's intensification to a 60 mph (95 km/h) cyclone on June 18, but the storm weakened thereafter as it moved west-northwest,[1] and it ultimately dissipated within the ITCZ after 06:00 UTC on June 20 while located over the open East Pacific.[5][3]
Hurricane Carlotta[]
| Category 4 hurricane (SSHWS) | |
  | |
| Duration | June 17 – June 25 |
|---|---|
| Peak intensity | 130 mph (215 km/h) (1-min) |
To the east of Tropical Storm Bud, a new tropical disturbance – originating as a Caribbean ITCZ disturbance – was identified south of Acapulco on June 15.[4] The comparatively small system became a tropical depression around 06:00 UTC on June 17 and Tropical Storm Carlotta eighteen hours later.[1][5] After formation, Carlotta embarked toward the west-southwest, steered by the same ridge that directed Bud. The storm displayed a small eye in satellite imagery early on June 19,[1] and it was upgraded to a hurricane by 06:00 UTC that day.[5] Carlotta continued to intensify as it curved west-northwest but remained over warm ocean waters,[1] becoming the season's first major hurricane around 06:00 UTC on June 20 and ultimately peaking as a Category 4 hurricane with winds of 130 mph (215 km/h) by 12:00 UTC on June 21.[5] Carlotta maintained its strength for a time before it encountered cooler waters and dry air on June 23.[1] The cyclone steadily lost strength and degenerated to a disturbance after 18:00 UTC on June 25 but remained a traceable entity as it moved across the Central Pacific. The disturbance moved across the Hawaiian island chain on June 28 and continued west, ultimately merging with a cold-core low. It was last identified over the West Pacific near Minami-Tori-shima on July 10.[3]
Although wind effects across Hawaii were minimal, the remnants of Carlotta delivered heavy rainfall across much of the Hawaiian island chain. Accumulations exceeded 6 in (150 mm), particularly on the island of Oahu.[3]
Hurricane Daniel[]
| Category 3 hurricane (SSHWS) | |
  | |
| Duration | June 26 – July 3 |
|---|---|
| Peak intensity | 115 mph (185 km/h) (1-min) |
A tropical disturbance, first identified in association with a tropical wave west of Nicaragua on June 24,[4][1] moved west-northwest and organized into a tropical depression by 18:00 UTC on June 26.[5] It intensified into Tropical Storm Daniel within twelve hours but weakened to a tropical depression again while tracking over 26 °C (79 °F) ocean waters. After moving into a more favorable environment again,[1] Daniel regained tropical storm strength before 18:00 UTC on June 28 and intensified into a hurricane 24 hours later. Around 12:00 UTC on June 30, the hurricane attained major hurricane strength with winds of 115 mph (185 km/h).[5] The cyclone tracked west and then west-southwest over steadily cooler waters,[1] which resulted in its weakening and degeneration to a disturbance after 18:00 UTC on July 3.[5] The remnant system moved across the Central Pacific and through the Hawaiian islands, where it lost definition on July 11.[3]
As the circulation of Daniel moved over the Hawaiian islands, it produced rainfall totals of 5–7 in (130–180 mm) across the Big Island and Maui. Accumulation over windward sections of opposing islands was more isolated and generally confined under 2 in (51 mm).[3]
Tropical Storm Emilia[]
| Tropical storm (SSHWS) | |
  | |
| Duration | July 6 – July 10 |
|---|---|
| Peak intensity | 65 mph (100 km/h) (1-min) |
An area of disturbed weather and associated tropical wave was observed east of Acapulco on July 3.[4] It moved southwest during the early stages of its existence before curving more toward the northwest. Satellite imagery identified the existence of a tropical depression by 18:00 UTC on July 6,[1] and that depression quickly intensified into Tropical Storm Emilia six hours later. The newly-named storm gathered strength over subsequent days, attaining peak winds of 65 mph (100 km/h) around 06:00 UTC on July 9.[5] Beyond that time, Emilia crossed into cooler waters and began to rapidly weaken,[1] dissipating after 18:00 UTC on July 10.[5]
Hurricane Fico[]
| Category 4 hurricane (SSHWS) | |
 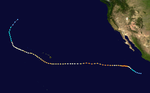 | |
| Duration | July 9 – July 28 |
|---|---|
| Peak intensity | 140 mph (220 km/h) (1-min) ≤ 955 mbar (hPa) |
Fico, similar to the season's preceding cyclones, began as an area of disturbed weather in association with a tropical wave east of Acapulco.[1] It moved west-northwest over warm waters, becoming a tropical depression around 00:00 UTC on July 9 and intensifying into a tropical storm 24 hours later. Fico continued to rapidly gain strength and became a hurricane around 18:00 UTC on July 10.[5] As it did so, the hurricane was characterized with a well-defined eye and outflow radiating far away from the center.[1] Fico intensified into a major hurricane by 12:00 UTC on July 11 and later peaked as a Category 4 hurricane with winds of 140 mph (220 km/h) a day later.[5] On July 13–14, the cyclone passed over a pocket of 26 °C (79 °F) ocean waters, which caused it to rapidly weaken to Category 1 intensity. However, underlying waters soon warmed again,[1] allowing Fico to regain Category 4 strength. Fico fluctuated in intensity over many days as it crossed into the Central Pacific basin and passed south of Hawaii.[5] After July 20, the hurricane curved northwest ahead of an upper-level trough, bringing the storm over cooler waters again.[1] The system rapidly weakened, finally dissipating after 18:00 UTC on July 28 after having traveled 6,645 mi (10,695 km).[5]
At the time, Fico was the longest-duration hurricane and furthest-traveled hurricane on record in the Central Pacific. It tracked further than any West Pacific typhoon by that point, and only one typhoon – Rita – persisted at that intensity longer than Fico. In the Atlantic, only hurricanes Ginger, Carrie, and Faith exceeded Fico with regard to distance traveled or time spent as a hurricane.[6] Fico produced considerable impacts in Hawaii. Southerly flow in association with a cyclone over the Southern Hemisphere combined with east-northeasterly flow from the hurricane, producing beach road flooding along the southeastern shore of the Big Island while Fico was still 500 mi (800 km) away. Ocean waves, breaking at 15–20 ft (4.6–6.1 m) at the coast and larger values offshore, caused severe damage to beachfront homes and roads. Similar waves were observed along the coasts of Oahu and Kauai. A 43 ft (13 m) sloop became stranded in the cyclone's circulation, forcing a Navy torpedo boat to rescue six people onboard. A 65 ft (20 m) tugboat was run aground on a reef along the southern shore of Kauai. By July 21, a strong trade wind gradient exacerbated by the presence of Fico caused widespread winds over 60 mph (95 km/h), which resulted in downed trees and power outages. Overall damage in Hawaii totaled $200,000.[7] A week later, the remnants of the storm became intertwined with a strong frontal system, producing heavy rain and winds up to 45 mph (75 km/h) to the Aleutian Islands.[3]
Hurricane Gilma[]
| Category 3 hurricane (SSHWS) | |
  | |
| Duration | July 13 – July 20 |
|---|---|
| Peak intensity | 115 mph (185 km/h) (1-min) |
An area of disturbed weather spawned by a tropical wave developed southeast of Acapulco and rapidly grew in size.[1] It developed into a tropical depression around 00:00 UTC on July 13 and further into Tropical Storm Gilma six hours later while curving from west-southwest to west-northwest.[1][5] Further organization brought Gilma to hurricane strength around 18:00 UTC on July 15 and major hurricane intensity by 06:00 UTC the next day.[5] By this point, satellite imagery revealed a system with a cloud shield about 920 mi (1,480 km) in diameter and an eye about 15 mi (25 km) wide. Immediately after peak, the effects of cold waters and dry air began to affect Gilma, and the storm weakened rapidly.[1] It degenerated to a disturbance after 00:00 UTC on July 20 while located well west of Baja California.[5] Its well-defined circulation tracked north of Hawaii before dissipating on July 27.[3]
Hurricane Hector[]
| Category 4 hurricane (SSHWS) | |
  | |
| Duration | July 22 – July 29 |
|---|---|
| Peak intensity | 140 mph (220 km/h) (1-min) 955 mbar (hPa) |
The third in a series of major hurricanes began as a tropical disturbance and accompanying tropical wave south of Guatemala on July 19.[1] The system moved west-northwest, becoming a tropical depression around 00:00 UTC on July 22 and Tropical Storm Hector six hours later. Further strengthening brought the system to hurricane strength by 12:00 UTC on July 23,[5] after which time a well-defined eye developed on satellite imagery.[1] Hector became a major hurricane around 00:00 UTC on July 25 before rapidly strengthening to a Category 4 storm with winds of 140 mph (220 km/h) six hours later.[5] The cyclone continued west-northwest into a sharply more hostile environment of cold waters and dry air,[1] causing weakening that resulted in Hector's degeneration to a disturbance after 18:00 UTC on July 29.[5] The remnants of the storm drifted westward and dissipated northeast of Hawaii on August 2.[3]
Hurricane Iva[]
| Category 1 hurricane (SSHWS) | |
  | |
| Duration | August 11 – August 15 |
|---|---|
| Peak intensity | 75 mph (120 km/h) (1-min) |
In early August, the Atlantic's Tropical Storm Bess crossed Mexico. Its remnants emerged into the eastern Pacific,[4] where they redeveloped into a tropical depression by 06:00 UTC on August 11.[5] Very warm ocean waters facilitated the system's rapid intensification,[1] and it strengthened into Tropical Storm Iva six hours after formation before becoming a hurricane around 06:00 UTC on August 13.[5] Iva moved west-northwest over increasingly cool waters,[1] and it degenerated to a disturbance after 06:00 UTC on August 15 to the west of Baja California.[5] The remnants tracked into the Central Pacific and dissipated on August 21. Rainfall accumulations of 5–6.5 in (130–170 mm) were observed along eastern shores of the Big Island and Maui.[3]
Hurricane John[]
| Category 2 hurricane (SSHWS) | |
  | |
| Duration | August 18 – August 30 |
|---|---|
| Peak intensity | 105 mph (165 km/h) (1-min) |
In mid-August, three tropical disturbances developed in close proximity across the East Pacific basin.[1] The middle disturbance slowly organized as it moved west to west-northwest, becoming a tropical depression by 00:00 UTC on August 18. A day later, it intensified into Tropical Storm John.[5] The system tracked over warm water as it became sandwiched between Hurricane Kristy to the east and Tropical Storm Lane to the west.[1] John attained hurricane strength over the far western reaches of the East Pacific basin around 12:00 UTC on August 22, but it weakened to a tropical storm as it crossed into the Central Pacific. Over subsequent days, the cyclone reorganized, reaching its peak as a Category 2 hurricane with winds of 105 mph (165 km/h) early on August 25. It tracked south of Hawaii while steadily weakening and ultimately dissipated after 06:00 UTC on August 30.[5][3]
Hurricane Kristy[]
| Category 2 hurricane (SSHWS) | |
  | |
| Duration | August 18 – August 28 |
|---|---|
| Peak intensity | 105 mph (165 km/h) (1-min) |
The remnants of the Atlantic's Hurricane Cora crossed into the eastern Pacific in mid-August,[4] becoming the easternmost of successive disturbances across the East Pacific basin.[1] It coalesced into a tropical depression by 18:00 UTC on August 18 and further into Tropical Storm Kristy within six hours.[5] The system acquired an eye on satellite on August 19,[1] and it was upgraded to a hurricane around 18:00 UTC that day. Kristy moved northwest and then west-northwest, further organizing into a Category 2 hurricane with winds of 105 mph (165 km/h) on August 21.[5] Thereafter, the system encountered cooler waters and drier air, which caused it to fall to tropical storm intensity. Environmental conditions improved again by August 25 as Kristy regained hurricane strength, but it soon encountered cooler waters again that prompted a more concrete weakening trend.[1] The cyclone stair-stepped into the Central Pacific prior to dissipating after 00:00 UTC on August 28.[5][3]
Tropical Storm Lane[]
| Tropical storm (SSHWS) | |
  | |
| Duration | August 19 – August 24 |
|---|---|
| Peak intensity | 50 mph (85 km/h) (1-min) |
The westernmost of successive disturbances over the East Pacific, joined by a tropical wave, was identified on August 15.[1] It developed into a tropical depression around 00:00 UTC on August 19 and intensified into Tropical Storm Lane eighteen hours later. The storm moved generally westward and crossed into the Central Pacific as it attained peak winds of 50 mph (85 km/h).[5] Beyond that time, Lane tracked over colder waters and begin to weaken,[1] eventually dissipating south of Hawaii after 00:00 UTC on August 24.[5][3]
Hurricane Miriam[]
| Category 1 hurricane (SSHWS) | |
  | |
| Duration | August 23 – September 2 |
|---|---|
| Peak intensity | 90 mph (150 km/h) (1-min) |
A small disturbance coincident with a tropical wave was first identified south of Acapulco on August 19.[4][1] The system moved west and coalesced into a tropical depression around 18:00 UTC on August 23.[5] The depression failed to intensify over subsequent days, and in fact, it was operationally downgraded back to a disturbance on August 26.[1] In the official database, the cyclone maintained its status and eventually intensified into Tropical Storm Miriam around 00:00 UTC on August 27.[5] Miriam turned west-southwest and entered the Central Pacific,[1] where it intensified into a hurricane at 12:00 UTC on August 28 and reached peak winds of 90 mph (150 km/h) twelve hours later.[5] Miriam then began to steadily weaken as it passed south of Hawaii,[1] and the cyclone dissipated after 00:00 UTC on September 2.[5]
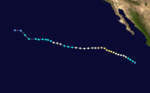
Hurricane Norman[]
| Category 4 hurricane (SSHWS) | |
  | |
| Duration | August 30 – September 7 |
|---|---|
| Peak intensity | 140 mph (220 km/h) (1-min) 955 mbar (hPa) |
On August 29, a tropical wave and attendant disturbance were located southwest of Acapulco.[4][1] The system organized into a tropical depression by 18:00 UTC on August 30, and it became Tropical Storm Norman six hours later. Norman moved west-northwest while gaining strength,[5] intensifying into a hurricane around 06:00 UTC on September 1 and developing a small eye shortly thereafter. The hurricane rapidly intensified over warm waters,[1] catapulting to Category 4 intensity by 06:00 UTC on September 2. Norman peaked with winds of 140 mph (220 km/h) twelve hours later, equaling Fico and Hector as the strongest storm of the 1978 season.[5] A reconnaissance aircraft in the cyclone at this time observed a 45 mi (72 km) diameter eye.[1] High pressure steering the storm west-northwest gave way to strong southwesterly flow aloft, causing the storm to recurve northeast in a much less favorable environment. Subsequent recon missions found a much weakened cyclone,[1] and Norman ultimately dissipated south of San Clemente Island after 00:00 UTC on September 7.[5]
Heavy rains fell across the Sierra Nevada range in California, with a maximum amount of 7.01 inches reported at Lodgepole.[8] The state suffered extensive damage to its crops. Fig, almond, and raisin crops were particularly affected, the latter of which was 95 percent destroyed, the biggest loss to the California raisin industry on record. Lingering cloud cover prevented ample drying in the wake of the storm, exacerbating agricultural losses, which were placed in excess of $300 million.[1]
Hurricane Olivia[]
| Category 1 hurricane (SSHWS) | |
  | |
| Duration | September 20 (Entered basin) – September 23 |
|---|---|
| Peak intensity | 75 mph (120 km/h) (1-min) |
The Atlantic's Hurricane Greta struck Central America and maintained its status as a tropical cyclone while crossing into the East Pacific. It emerged into the Gulf of Tehuantepec as a tropical depression but soon gained strength over warm waters; since it entered a new basin, the depression was reclassified as Tropical Storm Olivia. The cyclone moved erratically after this point while continuing to intensify,[1] becoming a hurricane and attaining peak winds of 75 mph (120 km/h) by 00:00 UTC on September 22.[5] Olivia eventually tracked north-northeast, moving onshore about 60 mi (95 km) east of Salina Cruz between 19:00–20:00 UTC that day;[1] the system maintained winds of 60 mph (95 km/h) at that time. Rapid weakening occurred thereafter, and Olivia dissipated after 00:00 UTC on September 23.[5]
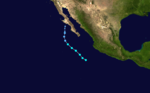
Tropical Storm Paul[]
| Tropical storm (SSHWS) | |
  | |
| Duration | September 23 – September 27 |
|---|---|
| Peak intensity | 45 mph (75 km/h) (1-min) |
Tropical Storm Paul, the second system alongside Hurricane John without any genesis ties to the Atlantic,[4] was first identified north of Hurricane Olivia on September 22.[1] The system developed into a tropical depression by 00:00 UTC on September 23 but failed to intensify for several days thereafter. Finally, by 12:00 UTC on September 25, the system organized into Tropical Storm Paul.[5] It attained peak winds of 45 mph (75 km/h) six hours later as it curved toward the northeast, narrowly missing Baja California Sur.[1] Paul began to weaken as it approached the Mexico coastline, which it struck as a tropical depression around 12:00 UTC on September 26.[1] Six hours later, the depression transitioned into an extratropical cyclone,[5] which only persisted for an additional six hours before dissipating over northern Mexico.[1]
Hurricane Rosa[]
| Category 1 hurricane (SSHWS) | |
  | |
| Duration | October 2 – October 7 |
|---|---|
| Peak intensity | 85 mph (140 km/h) (1-min) |
Two areas of disturbed weather focused south of the Gulf of Tehuantepec on October 1, one of which with origins as a tropical wave, underwent binary interaction and merged into one larger system the next day.[1] The disturbance was upgraded to a tropical depression around 18:00 UTC, and it further intensified into Tropical Storm Rosa by 00:00 UTC on October 3.[5] Rosa moved around the western periphery of an upper-level ridge,[1] strengthening over warm waters as it did so. The cyclone became a hurricane by 00:00 UTC on October 4, ultimately attaining peak winds of 85 mph (140 km/h) on October 4.[5] An aircraft reconnaissance plane intercepted the storm around this time, finding a 35 mi (55 km) elliptical eye open to the southwest.[1] Rosa moved northwest over colder waters, transitioning to an extratropical cyclone around 06:00 UTC on October 7 and ultimately dissipating west of Baja California after twelve hours.[1][5]
Hurricane Susan[]
| Category 4 hurricane (SSHWS) | |
  | |
| Duration | October 18 – October 24 |
|---|---|
| Peak intensity | 130 mph (215 km/h) (1-min) 954 mbar (hPa) |
An area of disturbed weather within the ITCZ developed into Tropical Storm Susan around 00:00 UTC on October 18.[3] The storm intensified over subsequent days, becoming a hurricane around 00:00 UTC on October 20 and further developing into a major hurricane by 18:00 UTC the next day. Susan attained Category 4 strength with winds of 130 mph (215 km/h) six hours later,[5] one of the strongest on record in the Central Pacific at that time. Although the powerful hurricane initially tracked northwest toward Hawaii, it sharply veered toward the southwest while succumbing to strong wind shear.[3] Susan weakened rapidly, with winds falling from 115 mph (185 km/h) to 35 mph (55 km/h) within 24 hours, and dissipated after 00:00 UTC on October 24.[5]
Tropical Storm Sergio[]
| Tropical storm (SSHWS) | |
  | |
| Duration | October 18 – October 21 |
|---|---|
| Peak intensity | 40 mph (65 km/h) (1-min) |
The final storm of the 1978 season began as a disturbance, with origins as an African wave,[4] southeast of Socorro Island on October 18.[1] The system moved northwest, developing into Tropical Storm Sergio at 18:00 UTC that day and reaching peak winds of 40 mph (65 km/h).[5] Sergio maintained this intensity until it began to curve northward into cooler waters,[1] which caused the system to transition into an extratropical cyclone by 00:00 UTC on October 21 and dissipate to the northwest of Baja California Sur after twelve hours.[5][1]
Other systems[]
In addition to the system's numerous tropical cyclones, several unofficial tropical depressions were recorded. The first system developed well to the southwest of Daniel on June 29 and became a tropical depression the next day. It moved west to west-southwest and dissipated on July 2.[1] On August 5, a disturbance developed within a very active portion of the ITCZ over the Central Pacific. The cyclone organized into a tropical depression on or before August 7 but failed to intensify into a tropical storm before dissipating on August 9. Regardless, it produced strong thunderstorms across the Hawaiian islands, with rainfall amounts generally averaging 3–5 in (76–127 mm).[3] Another tropical depression formed on August 8 from a disturbance first identified three days prior. Like the depression in the East Pacific before it, the system curved west-southwest over cooler waters and dissipated after having only existed six hours. On September 7, a new area of disturbed weather was observed, and it intensified into the season's final tropical depression the next day. That cyclone curved north-northeast and dissipated on September 9.[1]
Storm names[]
The following list of names was utilized for named storms that developed in the East Pacific in 1978. This season ended two previous practices: adopting female names, which began with the 1960 season, and using naming lists rotated every four years, which began with the 1966 season. Instead, 1978 began the practice of utilizing naming lists rotated every six years. For the first time, these lists incorporated both male and female names.[9] In addition, the name Susan was utilized in the Central Pacific.
|
|
|
Retirement[]
The World Meteorological Organization retired the name Fico in the spring of 1979. It was replaced with Fabio for the 1982 season.
See also[]
- List of Pacific hurricanes
- Pacific hurricane season
- 1978 Atlantic hurricane season
- 1978 Pacific typhoon season
- 1978 North Indian Ocean cyclone season
- Southern Hemisphere tropical cyclone seasons: 1977–78, 1978–79
References[]
- ^ a b c d e f g h i j k l m n o p q r s t u v w x y z aa ab ac ad ae af ag ah ai aj ak al am an ao ap aq ar as at au av aw ax ay az ba bb bc bd be bf bg Emil B. Gunther (July 1979). "Eastern North Pacific Tropical Cyclones of 1978". Monthly Weather Review. American Meteorological Society. 107 (7). Bibcode:1979MWRv..107..911G. doi:10.1175/1520-0493(1979)107<0911:ENPTCO>2.0.CO;2.
- ^ https://www.tandfonline.com/doi/abs/10.1080/00431672.1979.9930091
- ^ a b c d e f g h i j k l m n o p https://www.nhc.noaa.gov/data/tcr/CP1978_Seasonal_TCR.pdf
- ^ a b c d e f g h i j k Neil L. Frank and Gilbert B. Clark (August 1979). Atlantic Tropical Systems of 1978. National Hurricane Center (Report). Miami, Florida: National Oceanic and Atmospheric Administration. Retrieved June 3, 2014.
- ^ a b c d e f g h i j k l m n o p q r s t u v w x y z aa ab ac ad ae af ag ah ai aj ak al am an ao ap aq ar as at au av aw ax ay National Hurricane Center; Hurricane Research Division; Central Pacific Hurricane Center. "The Northeast and North Central Pacific hurricane database 1949–2019". United States National Oceanic and Atmospheric Administration's National Weather Service. Retrieved 1 October 2020. A guide on how to read the database is available here.
- ^ http://nwafiles.nwas.org/digest/papers/1980/Vol05No2/1980v005no02-Cochran.pdf
- ^ The State of Hawaii Data Book (2000). "Geography and Environment of Hawaii" (PDF). Archived from the original (PDF) on 2012-11-05. Retrieved 2006-12-10.
- ^ Hydrometeorological Prediction Center. Hurricane Norman. Retrieved on 2007-02-28.
- ^ https://www.nhc.noaa.gov/pdf/TC_Book_Epac_1949-2006_hires.pdf
External links[]
Tropical cyclones of the 1978 Pacific hurricane season | ||
|---|---|---|
 | ||
| ||
- 1978 Pacific hurricane season
- Pacific hurricane seasons