Tropical cyclones in 2010
This article needs additional citations for verification. (December 2020) |
| Tropical cyclones in 2010 | |
|---|---|
 Year summary map | |
| Year boundaries | |
| First system | Edzani |
| Formed | January 1, 2010 |
| Last system | 08U |
| Dissipated | January 2, 2011 |
| Strongest system | |
| Name | Megi |
| Lowest pressure | 885 mbar/hPa; 26.13 inHg |
| Longest lasting system | |
| Name | Megi |
| Duration | 19 days |
| Year statistics | |
| Total systems | 111 |
| Named systems | 64 |
| Total fatalities | 1,553 total |
| Total damage | $15.34 billion (2010 USD) |

During 2010, tropical cyclones formed within seven different tropical cyclone basins, located within various parts of the Atlantic, Pacific and Indian Oceans. During the year, a total of 111 tropical cyclones had formed this year to date. 64 tropical cyclones had been named by either a Regional Specialized Meteorological Center (RSMC) or a Tropical Cyclone Warning Center (TCWC).
The most active basin was the North Atlantic, which documented 19 named systems, while the North Indian Ocean, despite only amounting to five named systems, was its basin's most active since 1998. Conversely, both the West Pacific typhoon and East Pacific hurricane seasons experienced the fewest cyclones reaching tropical storm intensity in recorded history, numbering 14 and 8, respectively. Activity across the southern hemisphere's three basins—South-West Indian, Australian, and South Pacific—was spread evenly, with each region recording seven named storms apiece. That hemisphere's strongest tropical cyclone was Cyclone Edzani, which bottomed out with a barometric pressure of 910 mbar (hPa; 26.87 inHg) in the South-West Indian Ocean. Four Category 5 tropical cyclones were formed in 2010.
The strongest of these tropical cyclones was Typhoon Megi, which strengthened to a minimum barometric pressure of 885 mbar (hPa; 26.13 inHg) before striking the east coast of Luzon in the Philippines. The costliest tropical cyclone in 2010 was Hurricane Karl, which struck the Veracruz, Mexico area in September, causing US$5.6 billion in damage.[nb 1] Hurricane Alex and tropical storms Matthew, and Agatha were the only other tropical cyclones worldwide in 2010 to accrue over US$1 billion in damage. Agatha was also the year's deadliest storm, killing 190 people primarily in Guatemala after lasting for only one day over the waters of the East Pacific.
Global atmospheric and hydrological conditions[]
Previous El Niño event broke down during the first quarter of 2010.[1] The climate of the Pacific Ocean subsequently returned to neutral conditions by the end of April, while climate models used and developed by various meteorological agencies, subsequently started to show signs that a La Niña event would develop later in 2010.[1][2] Over the next month the Pacific Ocean started to show various signals that indicated a La Niña event was developing and as a result, a La Niña watch was issued by the United States Climate Prediction Center during their June 2010 ENSO diagnostic discussion.[1][3] As the ocean's surface temperature cooling progressed, more colder anomalies appeared at the International Date Line rather than over eastern Pacific, what allowed calling this event as a Modoki one.[4]
Season summary[]

Systems[]
January[]

During the month of January, a total of twelve tropical cyclones formed, with only five receiving names by their meteorological agencies of responsibility. The most intense tropical cyclone of the month was Cyclone Edzani, peaking with 910 hPa and 150 mph in 10-minute sustained winds.
| Storm name | Dates active | Max wind km/h (mph) |
Pressure (hPa) |
Areas affected | Damage (USD) |
Deaths | Refs |
|---|---|---|---|---|---|---|---|
| Edzani | January 1–14 | 220 (140) | 910 | No land areas | None | None | |
| 03F | January 7–10 | 65 (40) | 1002 | French Polynesia, Southern Cook Islands | None | None | [5] |
| 04U | January 14–21 | Unspecified | Unspecified | No land areas | None | None | |
| 09 | January 15–16 | 45 (30) | 1005 | Réunion, Mauritius, Madagascar | Minimal | None | |
| Magda | January 18–24 | 130 (80) | 975 | Western Australia | Minimal | None | |
| 01W | January 18–20 | 55 (35) | 1006 | Vietnam, Cambodia | $243 thousand | 3 | [6][7][8] |
| Neville | January 19–21 | 65 (40) | 995 | Queensland | None | None | [9] |
| Olga | January 20–30 | 95 (60) | 983 | Solomon Islands, Queensland, Northern Territory | Unknown | 2 | [10][11] |
| 05F | January 23–28 | Not specified | 997 | None | None | None | |
| Subtropical Depression 10 | January 25–31 | 65 (40) | 995 | None | None | None | |
| Nisha | January 27–31 | 75 (45) | 990 | Samoan Islands, Southern Cook Islands | None | None | |
| Oli | January 29 – February 7 | 185 (115) | 925 | Samoan Islands, Cook Islands, French Polynesia | $70 million | 1 |
February[]

The month of February was quite inactive, with only seven tropical cyclones forming, with five becoming named storms. Cyclone Gelane was the most intense of the month, peaking at 930 hPa, along with 10-minute sustained winds of 125 mph. No one was killed by a tropical cyclone in the month. April was another month in the year that no one was killed by tropical storm force winds.
| Storm name | Dates active | Max wind km/h (mph) |
Pressure (hPa) |
Areas affected | Damage (USD) |
Deaths | Refs |
|---|---|---|---|---|---|---|---|
| Fami | February 1 – 3 | 85 (50) | 994 | Madagascar | None | None | |
| 08F | February 2 – 4 | 55 (35) | 997 | French Polynesia, Cook Islands | None | None | |
| Pat | February 6 – 11 | 140 (85) | 960 | Cook Islands | $13.7 million | None | |
| Rene | February 9 – 17 | 155 (100) | 955 | Samoan Islands, Tonga | $18 million | None | |
| 08U | February 22 – 24 | Not specified | Not specified | Northern Territory | None | None | |
| Gelane | February 15 – 22 | 205 (125) | 930 | Reunion, Mauritius, Rodrigues, Madagascar | None | None | |
| Sarah | February 17 – March 3 | 65 (40) | 995 | Cook Islands | Unknown | None |
March[]

March was somewhat active with eight tropical cyclones forming with seven receiving names. Cyclone Ului was the most intense for March, as it was one of the fastest intensifying tropical cyclones on record. Ului was a Category 5 tropical cyclone (in one-minute sustained winds) for a near-record breaking 30 hours. When Ului made landfall in Queensland, Brisbane, damages totaled to be US$72 million ($100 million AUD)
| Storm name | Dates active | Max wind km/h (mph) |
Pressure (hPa) |
Areas affected | Damage (USD) |
Deaths | Refs |
|---|---|---|---|---|---|---|---|
| Hubert | March 7 – 15 | 100 (65) | 985 | Madagascar | Unknown | 85 | |
| Anita | March 8 – 12 | 85 (50) | 995 | Brazil | None | None | |
| Ului | March 9 – 21 | 215 (130) | 915 | Queensland | $72 million | 1 | |
| Tomas | March 9 – 17 | 185 (115) | 925 | Wallis and Futuna, Fiji | $45 million | 3 | |
| Imani | March 20–27 | 130 (80) | 965 | None | None | None | |
| Omais (Agaton) | March 22–26 | 65 (40) | 998 | Woleai, Fais, Ulithi, Yap | $10 thousand | None | |
| Paul | March 22 – April 3 | 130 (80) | 971 | Northern Territory | Unknown | None | |
| 15F | March 30 – April 5 | 55 (35) | 999 | None | None | None |
April[]

April was a hugely inactive month with only four tropical cyclones forming with only two being named. No tropical cyclone attained pressure under 980 hPa, which makes Cyclone Robyn the most intense of the month, attaining that intensity, as well as ten-minute sustained winds of 70 miles per hour.
| Storm name | Dates active | Max wind km/h (mph) |
Pressure (hPa) |
Areas affected | Damage (USD) |
Deaths | Refs |
|---|---|---|---|---|---|---|---|
| Robyn | April 1 – 7 | 110 (70) | 980 | None | None | None | |
| Sean | April 22 – 25 | 100 (65) | 988 | Northern Territory | Unknown | None | |
| TD | April 26 | Not specified | 1008 | Mindanao | None | None |
May[]
May was a relatively inactive month with five tropical cyclones forming and all five received names. Tropical Storm Agatha was the deadliest and costliest of the month, killing around 204 people and inflicting $1.11 billion in damage. Cyclone Phet was the most intense tropical cyclone in the month. A Category 4 tropical cyclone on the Saffir–Simpson Hurricane Wind Scale (SSHWS), Phet was the least intense for a Category 4 major cyclone, only peaking at 970 hPa. In three-minute sustained winds, the peak strength was 100 miles an hour, which is more reasonable for such low intensity.
| Storm name | Dates active | Max wind km/h (mph) |
Pressure (hPa) |
Areas affected | Damage (USD) |
Deaths | Refs |
|---|---|---|---|---|---|---|---|
| Laila | May 17 – 21 | 100 (65) | 986 | India | $118 million | 65 | |
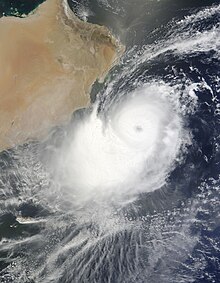
| Bandu | May 19 – 23 | 75 (45) | 994 | Yemen, Somalia | None | 1 | |
| Joël | May 22 – 29 | 100 (65) | 990 | Madagascar Mozambique | None | None | |
| Agatha | May 29 – 30 | 75 (45) | 1001 | Mexico, Guatemala | $1.11 billion | 204 | |
| Phet | May 30 – June 7 | 155 (100) | 970 | Oman, Pakistan, India | $780 million | 44 |
June[]

June was relatively inactive with only six systems forming all within the northern hemisphere, with four further developing into tropical storms and receiving names. Hurricane Celia was the strongest and most intense tropical cyclone of the month which became a Category 5 major hurricane on the modern-day Saffir–Simpson hurricane wind scale; the first Category 5 in the month of June in the Eastern Pacific basin since Ava in 1973. Hurricane Alex is tied with 1957's Hurricane Audrey as the most intense hurricane in the month of June on record, peaking at 946 hPa.
| Storm name | Dates active | Max wind km/h (mph) |
Pressure (hPa) |
Areas affected | Damage (USD) |
Deaths | Refs |
|---|---|---|---|---|---|---|---|
| TD | June 3–5 | Not specified | 1002 | None | None | None | |
| Two-E | June 16–17 | 55 (35) | 1007 | Mexico | Minimal | None | |
| Blas | June 17–21 | 100 (65) | 994 | None | None | None | |
| Celia | June 18–28 | 260 (160) | 921 | Mexico, Clipperton Island | None | None | |
| Darby | June 23–28 | 195 (120) | 959 | Mexico | None | None | |
| Alex | June 25 – July 2 | 175 (110) | 946 | Greater Antilles, Belize, Yucatán Peninsula, Northern Mexico, Texas | $1.52 billion | 33 |
July[]

July was a very inactive month and the least active July on record for any given year, with only eight tropical cyclones forming and only three becoming named tropical storms. Only two reached hurricane strength, with no major-hurricane equivalent tropical cyclones. Typhoon Chanthu was the most intense tropical cyclone in the month, with a minimum pressure or 965 hPa, and ten-minute sustained winds of 80 mph.
| Storm name | Dates active | Max wind km/h (mph) |
Pressure (hPa) |
Areas affected | Damage (USD) |
Deaths | Refs |
|---|---|---|---|---|---|---|---|
| Two | July 8–9 | 55 (35) | 1005 | Northern Mexico, South Texas | Minimal | None | |
| Conson (Basyang) | July 11–18 | 130 (80) | 970 | Philippines China, Vietnam | $82 million | 106 | |
| Six-E | July 14–16 | 55 (35) | 1006 | Mexico | None | None | |
| Chanthu (Caloy) | July 17–23 | 130 (80) | 970 | Philippines China | $818 million | 19 | |
| TD | July 18–20 | 55 (35) | 1004 | Japan | None | None | |
| Bonnie | July 22–24 | 75 (45) | 1005 | Puerto Rico, Hispaniola, Turks and Caicos Islands, The Bahamas, Florida | $1.36 million | 1 | |
| TD | July 23–24 | Not specified | 1008 | Taiwan | None | None | |
| TD | July 26–28 | 55 (35) | 1002 | China | None | None |
August[]

| Storm name | Dates active | Max wind km/h (mph) |
Pressure (hPa) |
Areas affected | Damage (USD) |
Deaths | Refs |
|---|---|---|---|---|---|---|---|
| Colin | August 2–8 | 60 (95) | 1005 | Leeward Islands, Bermuda, Carolinas, New England | Minimal | 1 | |
| Domeng | August 3–5 | 40 (65) | 997 | Philippines | Minimal | 3 | |
| Dianmu (Ester) | August 6–12 | 95 (60) | 985 | South Korea, Japan | $42 million | 37 | |
| Estelle | August 6–10 | 100 (65) | 994 | Mexico | None | None | |
| Five | August 10–11 | 55 (35) | 1007 | Gulf Coast of the United States | $1 million | None | |
| Eight-E | August 20–21 | 55 (35) | 1003 | None | None | None | |
| Frank | August 21–28 | 150 (90) | 978 | Mexico | $8.3 million | 6 | |
| Danielle | August 21–30 | 215 (130) | 942 | Bermuda, East Coast of the United States | Minimal | 2 | |
| Mindulle | August 22–25 | 85 (50) | 985 | Vietnam | $43.3 million | 10 | |
| Earl | August 25 – September 4 | 230 (145) | 927 | Leeward Islands, Puerto Rico, The Bahamas, Eastern United States, Atlantic Canada, Quebec | $45 million | 5 | |
| TD | August 26–28 | 55 (35) | 1004 | None | None | None | |
| Lionrock (Florita) | August 27 – September 4 | 95 (60) | 985 | Philippines Taiwan, China | $65.1 million | None | |
| Kompasu (Glenda) | August 28 – September 2 | 150 (90) | 960 | China, Korea | $58.3 million | 29 | |
| Namtheun | August 29–31 | 65 (40) | 996 | Taiwan, China | None | None | |
| Fiona | August 30 – September 3 | 100 (65) | 998 | Leeward Islands, Bermuda | Minimal | None | |
| TD | August 30–31 | 55 (35) | 1008 | None | None | None |
September[]

| Storm name | Dates active | Max wind km/h (mph) |
Pressure (hPa) |
Areas affected | Damage (USD) |
Deaths | Refs |
|---|---|---|---|---|---|---|---|
| Malou (Henry) | September 1–10 | 95 (60) | 985 | Japan | Unknown | None | |
| Gaston | September 1–2 | 65 (40) | 1005 | Leeward Islands, Puerto Rico | None | None | |
| Ten-E | September 3–4 | 55 (35) | 1003 | None | None | None | |
| Eleven-E | September 3–4 | 55 (35) | 1004 | Mexico, Central America | $500 million | None | |
| Hermine | September 5–9 | 110 (70) | 989 | Central America, Mexico, Texas Oklahoma, Kansas | $740 million | 52 | |
| Meranti | September 7–10 | 100 (65) | 985 | Taiwan, China | $118 million | 3 | |
| Geordette | September 20–23 | 65 (40) | 999 | Baja California Peninsula, Mexico | Minimal | None | |
| Igor | September 8–21 | 250 (155) | 924 | Cape Verde, Leeward Islands, Bermuda, East Coast of the United States, Newfoundland and Labrador | $200 million | 4 | |
| Julia | September 12–20 | 220 (140) | 948 | Cape Verde | Minimal | None | |
| Fanapi (Inday) | September 14–21 | 175 (110) | 935 | Taiwan, China | $1 billion | 105 | |
| Karl | September 14–18 | 205 (125) | 956 | Belize, Yucatán Peninsula, Veracruz | $3.9 billion | 22 | |
| Malakas | September 20–25 | 155 (100) | 945 | Japan | None | None | |
| Lisa | September 20–26 | 140 (85) | 982 | None | None | None | |
| Matthew | September 23–26 | 95 (60) | 998 | Venezuela, Jamaica, Central America, Mexico | $172.2 million | 126 | |
| Nicole | September 28–29 | 75 (45) | 995 | Cayman Islands, Jamaica, Cuba, The Bahamas, Florida, East Coast of the United States | $245.4 million | 16 |
October[]

| Storm name | Dates active | Max wind km/h (mph) |
Pressure (hPa) |
Areas affected | Damage (USD) |
Deaths | Refs |
|---|---|---|---|---|---|---|---|
| 14W | October 5–10 | 55 (35) | 1006 | China | None | None | |
| Otto | October 6–10 | 140 (85) | 976 | Leeward Islands, Virgin Islands, Puerto Rico | $22.5 million | None | |
| TD | October 7–8 | Not specified | 1012 | None | None | None | |
| BOB 02 | October 7 –9 | 45 (30) | 996 | India, Bangladesh | Minimal | 17 | |
| Paula | October 11–16 | 165 (105) | 981 | Honduras, Nicaragua, Mexico, Cuba, The Bahamas, Florida | Unknown | 1 | |
| Megi (Juan) | October 12–24 | 230 (145) | 885 | Philippines, Taiwan, China | $709 million | 69 | |
| BOB 03 | October 13–16 | 65 (40) | 995 | India | Minimal | None | |
| Richard | October 20–26 | 155 (100) | 977 | Central America | $80 million | 1 | |
| Giri | October 20–23 | 195 (120) | 950 | Bangladesh Myanmar, Thailand, Yunnan | $359 million | 157 | |
| 17W | October 20–27 | 55 (35) | 1004 | None | None | None | |
| Chaba (Katring) | October 20–31 | 175 (110) | 935 | Japan | Minimal | None | |
| 01 | October 25—29 | 55 (35) | 997 | None | None | None | |
| Shary | October 28–30 | 120 (75) | 989 | Bermuda | Minimal | None | |
| Anggrek | October 28 – November 4 | 74 (45) | 995 | Cocos (Keeling) Islands | None | None | |
| Tomas | October 29 — November 7 | 155 (100) | 982 | Windward Islands, Leeward Islands, Greater Antilles, Lucayan Archipelago | $463.4 million | 51 |
November[]

| Storm name | Dates active | Max wind km/h (mph) |
Pressure (hPa) |
Areas affected | Damage (USD) |
Deaths | Refs |
|---|---|---|---|---|---|---|---|
| Jal | November 1–8 | 110 (70) | 988 | Thailand, Malaysia, Andaman Islands, India | $392 million | 117 | |
| TD | November 3–4 | 55 (35) | 1006 | Vietnam | None | None | |
| 18W | November 12–14 | 55 (35) | 1004 | Vietnam, Laos, Thailand | Unknown | None | |
| 01F | November 24–30 | 65 (40) | 999 | Vanuatu, Fiji | None | None | |
| Abele | November 28 — December 4 | 130 (80) | 974 | None | None | None |
December[]

December was very inactive. But, it did feature ten tropical cyclones forming. Only two made it to become named storms; Omeka and Tasha; the last two names of the year.
| Storm name | Dates active | Max wind km/h (mph) |
Pressure (hPa) |
Areas affected | Damage (USD) |
Deaths | Refs |
|---|---|---|---|---|---|---|---|
| BOB 06 | December 7 –8 | 45 (30) | 1000 | India | Minimal | None | |
| 19W | December 12–13 | 55 (35) | 1002 | Vietnam | None | None | |
| 03U | December 15–20 | 65 (40) | 989 | Western Australia | $77 million | None | |
| Omeka | December 18–21 | 95 (60) | 997 | Hawaii | None | None | |
| Tasha | December 20–25 | 75 (45) | 993 | Queensland | Unknown | 1 | |
| 05U | December 22–24 | Not specified | Not specified | None | None | None | |
| 06U | December 30 – January 2 | 55 (35) | 993 | Northern Territory, Western Australia | None | None | |
| 07U | December 30 – January 2 | Not specified | Not specified | None | None | None | |
| 02F | December 31 – January 2 | Not specified | 1004 | None | None | None | |
| 08U | December 31 – January 2 | Not specified | Not specified | None | None | None |
Global effects[]
- ^ The sum of the number of systems and fatalities in each basin will not equal the number shown as the total. This is because when systems move between basins, it creates a discrepancy in the actual number of systems and fatalities.
See also[]
Notes[]
- ^ All damage figures are in their respective currency's 2010 value.
- 5All storms occurring outside of 2010 are not counted in the death and damage figures
References[]
- ^ a b c Record-breaking La Niña events (PDF) (Report). Australian Bureau of Meteorology. July 2012. Archived (PDF) from the original on March 20, 2016. Retrieved March 20, 2016.
- ^ http://www.bom.gov.au/climate/enso/archive/ensowrap_20100428.pdf
- ^ El Niño/Southern Oscillation (ENSO) diagnostic discussion: June 2010 (PDF) (Report). United States Climate Prediction Center. June 3, 2010. Archived (PDF) from the original on March 20, 2016.
- ^ V. Platonov; E. Semenov; E. Sokolikhina (February 13, 2014). "Extreme La-Nina 2010/11 and the vigorous flood at the north-east of Australia" (PDF). EGU General Assembly/Geophysical Research. Retrieved October 15, 2014.
- ^ "International Marine Warning — Other 2010-01-07 00z". Fiji Meteorological Service. January 7, 2010. Archived from the original on January 7, 2010. Retrieved January 7, 2010.
- ^ Staff Writer (January 18, 2010). "JTWC Tropical Cyclone Warning: 01W: 2010-01-18 21z". Joint Typhoon Warning Center. Archived from the original on August 29, 2010. Retrieved January 20, 2010.
- ^ Staff Writer (January 19, 2010). "JTWC Tropical Cyclone Warning: 01W: 2010-01-19 09z". Joint Typhoon Warning Center. Archived from the original on August 29, 2010. Retrieved January 20, 2010.
- ^ Staff Writer (January 19, 2010). "Prognostic reasoning for Tropical Depression 01W 2010-01-19 15z". Joint Typhoon Warning Center. Archived from the original on August 29, 2010. Retrieved January 20, 2010.
- ^ DARWIN Tropical Cyclone Warning Centre 0708 UTC 16/01/2010
- ^ "Issued at 11:03 pm CST Monday 25 January 2010. Refer to Tropical Cyclone Advice Number 16". Bureau of Meteorology, Darwin. January 25, 2010. Archived from the original on January 5, 2010. Retrieved January 25, 2010.
- ^ "Issued at 02:00 am CST Thursday 28 January 2010. Refer to Tropical Cyclone Advice Number 30". Bureau of Meteorology, Darwin. January 28, 2010. Archived from the original on January 27, 2010. Retrieved January 27, 2010.
External links[]
| Tropical cyclone year articles (2010–2019) |
|---|
| 2010, 2011, 2012, 2013, 2014, 2015, 2016, 2017, 2018, 2019 |
Regional Specialized Meteorological Centers
- US National Hurricane Center – North Atlantic, Eastern Pacific
- Central Pacific Hurricane Center – Central Pacific
- Japan Meteorological Agency – NW Pacific
- India Meteorological Department – Bay of Bengal and the Arabian Sea
- Météo-France – La Reunion – South Indian Ocean from 30°E to 90°E
- Fiji Meteorological Service – South Pacific west of 160°E, north of 25° S
Tropical Cyclone Warning Centers
- Meteorology, Climatology, and Geophysical Agency of Indonesia – South Indian Ocean from 90°E to 141°E, generally north of 10°S
- Australian Bureau of Meteorology (TCWC's Perth, Darwin & Brisbane) – South Indian Ocean & South Pacific Ocean from 90°E to 160°E, generally south of 10°S
- Papua New Guinea National Weather Service – South Pacific Ocean from 141°E to 160°E, generally north of 10°S
- Meteorological Service of New Zealand Limited – South Pacific west of 160°E, south of 25°S
![]() This article incorporates public domain material from websites or documents of the National Weather Service.
This article incorporates public domain material from websites or documents of the National Weather Service.
- Tropical cyclones by year
- Tropical cyclones in 2010
- 2010 Atlantic hurricane season
- 2010 Pacific hurricane season
- 2010 Pacific typhoon season
- 2010 North Indian Ocean cyclone season