Tropical cyclones in 2016
This article needs additional citations for verification. (December 2020) |
| Tropical cyclones in 2016 | |
|---|---|
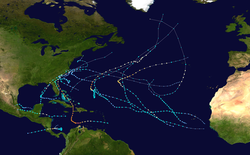
 Year summary map | |
| Year boundaries | |
| First system | Pali |
| Formed | January 7, 2016 |
| Last system | Nock-ten |
| Dissipated | December 28, 2016 |
| Strongest system | |
| Name | Winston[nb 1] |
| Lowest pressure | 884 mbar/hPa; 26.10 inHg |
| Longest lasting system | |
| Name | Winston |
| Duration | 24 days |
| Year statistics | |
| Total systems | 140 |
| Named systems | 84 |
| Total fatalities | 2,157 total |
| Total damage | $41.46 billion (2016 USD) |
During 2016, tropical cyclones formed within seven different tropical cyclone basins, located within various parts of the Atlantic, Pacific and Indian Oceans. During the year, 140 tropical cyclones formed in bodies of water known as tropical cyclone basins. Of these, 84, including two subtropical cyclones in the South Atlantic Ocean and two tropical-like cyclones in the Mediterranean, were named by various weather agencies when they attained maximum sustained winds of 35 knots (65 km/h; 40 mph). The strongest storm of the year was Winston, peaking with a pressure of 884 hPa (26.10 inHg) and with 10-minute sustained winds of 285 km/h (175 mph) before striking Fiji.[1] The costliest and deadliest tropical cyclone in 2016 was Hurricane Matthew, which impacted Haiti, Cuba, Florida, Georgia and the Carolinas, causing US$15.09 billion in damage.[2] Matthew killed 603 people; 546 in Haiti,[3] 47 in United States, 4 in Cuba and Dominican Republic,[4][5] and 1 in Colombia and St. Vincent.[6]
2016 had a slightly above average amount of tropical cyclones forming in the year. The most active basin of the year was the Western Pacific documenting a record 26 named storms. The Eastern Pacific in fact had a above-average season with only 21 named storms forming. The Eastern Pacific similarly was the first above-average since 2012 with 15 named storms forming and merely 7 hurricanes. The above activity can be blamed on a La Niña pattern which formed during the summer of the year. In the North Indian Ocean was a relatively below-average season which featured four named storms. The Southern Hemisphere had relatively average activity throughout much of the year– with the exception of the Australian region which remained below average because of positive IOD[7]– the other South-West Indian Ocean and South Pacific basins featured above-average seasons. Eight Category 5 tropical cyclones were formed in 2016.
Tropical cyclones are primarily monitored by a group of ten warning centers, which have been designated as a Regional Specialized Meteorological Centre (RSMC) or a Tropical Cyclone Warning Center (TCWC) by the World Meteorological Organization. These are the United States National Hurricane Center (NHC) and Central Pacific Hurricane Center, the Japan Meteorological Agency (JMA), the Indian Meteorological Department (IMD), Météo-France (MFR), Indonesia's Badan Meteorologi, Klimatologi, dan Geofisika, the Australian Bureau of Meteorology (BOM), Papua New Guinea's National Weather Service, the Fiji Meteorological Service (FMS) as well as New Zealand's MetService. Other notable warning centers include the Philippine Atmospheric, Geophysical, and Astronomical Services Administration (PAGASA), the United States Joint Typhoon Warning Center (JTWC), and the Brazilian Navy Hydrographic Center(BNHC).
Global atmospheric and hydrological conditions[]


This section needs expansion. You can help by . (September 2020) |
During November and December 2015, values within NOAA's Oceanic Niño Index peaked at 2.4 °C (4.3 °F), which surpassed December 1997 value of 2.2 °C (4.0 °F).[8][9][10] NOAA subsequently reported that the 3-month average from November 2015 to January 2016 of the ONI had peaked at 2.3 °C (4.1 °F), which meant that the 2014–16 event was tied with the 1997–98 event for the strongest values on record.[11] However, overall the event was considered to be one of the three strongest El Nino events since 1950, since there was a number of different ways to measure the strength of an event.[11] The event subsequently started to weaken with sea surface temperature anomalies across the equatorial pacific decreasing, while predictions about a possible La Niña event taking place during 2016 started to be made.[12][13]
During May 2016, the El Niño event dissipated as near to below average sea surface temperatures, expanded across the eastern equatorial Pacific Ocean. Atmospheric anomalies over the tropical Pacific Ocean had also weakened and become consistent with ENSO neutral conditions.[14] These anomalies included the traditional and equatorial Southern Oscillation indices becoming near zero, while atmospheric convection, upper and lower level winds all became near average. As a result of this the BoM, NOAA's CPC, IRI, and the JMA, all declared that the record-tying El Niño event had ended in late May/early June.
Summary[]

North Atlantic Ocean[]
The 2016 Atlantic hurricane season officially began on June 1, 2016.[15] It was an above average season and the most active since 2012, producing a total of 15 named storms, 7 hurricanes, and 4 major hurricanes. The first storm, Hurricane Alex, developed on January 12, while the final system, Hurricane Otto, made a crossover to the Eastern Pacific on November 25. The higher-than-normal activity was attributed to many factors. Most significantly, one of the strongest El Niño events recorded in history rapidly dissipated, transforming to cool-neutral conditions across the Pacific in late summer. This led to warmer than normal sea surface temperatures across the Atlantic, though the subtropical regions were slightly cooler than normal; slightly lower than normal sea level pressures; and reduced wind shear, especially in the Caribbean, which had experienced record values of wind shear in the past recent years. Moisture levels, however, were anomalously dry, which likely prevented some of the storms from becoming significant hurricanes. Steering currents had also been different from past years, which had previously had a trough of low pressure dominating the East Coast of the United States.[16] The tropical cyclones of this season caused about $16.1 billion in damage and at least 748 deaths,[17] being the costliest season since 2012, the deadliest since 2008.[18] The Atlantic hurricane season officially ended on November 30, 2016.[15] The season's activity was reflected with an accumulated cyclone energy index of 141 units,[19]which was well above the 1981–2010 median of 92,[20] as well as the highest value since 2010.[19]
The year opened up with an anomalous storm in January: Hurricane Alex, the first such system to develop in January since 1938.[21] Activity picked up at the end of May into June, with three consecutive tropical storms: Bonnie, Colin, and Danielle. The latter two were the earliest third- and fourth-named storms on record.[22][23] July saw no storm development for the first time in four years, however.[24] August saw the formation of five tropical cyclones, including Earl, Fiona, Gaston, Eight, and Hermine. A Category 1 hurricane, Earl wrought tremendous damage in Belize and Mexico. With 81 lives lost in Mexico during the passage of Earl, it was the deadliest Atlantic hurricane in the country since 2005.[25] Gaston became the season's first major hurricane on August 28, attaining peak winds of 120 mph (195 km/h) over the central Atlantic.[26] On September 1, Hermine struck the Florida Peninsula as a Category 1 hurricane, ending an 11-year drought of hurricane landfalls in the state, which began after Hurricane Wilma in October 2005.[27]
September featured another five tropical cyclones: Ian, Julia, Karl, Lisa, and Matthew, the latter of which persisted into October. Matthew proved to be the most significant storm of the season, becoming the first Category 5 hurricane in the Atlantic since Hurricane Felix in 2007,[28] and, with a death toll of over 600, it was the deadliest in the Atlantic basin since Hurricane Stan in 2005. It subsequently struck Haiti as a Category 4 hurricane, and inflicted catastrophic damage across the impoverished nation. Matthew also caused extensive damage in Cuba, the Bahamas, and the Southeastern United States.[29] Concurrently, Hurricane Nicole meandered south of Bermuda for more than a week before making a direct hit on the territory as a major hurricane.[30] The next four weeks were quiet, until Hurricane Otto formed in the southwestern Caribbean during late November. Otto eventually became the latest-forming major hurricane in the Atlantic basin on record, surpassing a storm in 1934.[31] After striking Nicaragua and becoming the first hurricane on record to pass over Costa Rica, Otto – the final tropical cyclone of the season – then emerged into the Eastern Pacific basin on November 25, the first such occurrence since Hurricane Cesar–Douglas in 1996.[31]
Eastern & Central Pacific Oceans[]

The season was tied as the fifth-most active season on record, alongside the 2014 season. Throughout the course of the year, a total of 22 named storms, 13 hurricanes and six major hurricanes were observed within the basin. Although the season was very active, it was considerably less active than the previous season, with large gaps of inactivity at the beginning and towards the end of the season. It officially started on May 15 in the eastern Pacific, and on June 1 in the central Pacific; they both ended on November 30.[32] As illustrated by Hurricane Pali, which became the earliest Central Pacific tropical cyclone on record,[33] the formation of tropical cyclones is possible at any time of the year. Although Pali formed in January, the season kicked off to a very inactive start; for the first time since 2011, no tropical depressions or storms formed during the month of May, and no named storms formed during June since 2007.
Agatha formed on July 2, the latest first named storm in the eastern Pacific proper since 1969. Despite this, the season set a record for the most number of storms during the first half of July. When Georgette formed on July 21, it became the seventh named storm to form in the month of July; equaling the previous record set in 1985 and 2015 for the most active July since reliable records began. And when Frank became a hurricane (after Georgette did so), it marked a record-high 5 hurricanes in July. Finally, Howard formed on July 31, however, was not named until August 1, one named storm shy of the record. Despite that, the season tied the record set in 1985 with the most named storms in July. Activity in August was slightly less active than July. Lester and Madeline threatened the Big Island at hurricane strength. Lester passed north of the islands, Madeline brought some rain as the storm dissipated south of Hawaii. Javier and Newton followed similar paths close to the Mexican coast, with both making landfall in the Baja California Peninsula in August and early September respectively. After Newton led off September; Hurricanes Orlene, Paine and Tropical Storm Roslyn followed forming far from land. Hurricane Ulika became the first tropical cyclone on record to cross 140°W three times; it also became the first named storm in the Central Pacific basin since Pali back in January. Ulika was the first storm since Ela in 2015 to form in the Eastern Pacific, but not be named until entering the Central Pacific. After an unusually quiet October, Hurricane Seymour became the sixth major hurricane of the season, as well as the strongest. Tropical Storm Tina formed close to the coast of Mexico in mid-November. In late November, Tropical Storm Otto entered the basin from the Atlantic, becoming only the eighteenth cyclone to do so; however, it dissipated quickly due to unfavorable conditions.
Western Pacific Ocean[]

The 2016 season is considered to have been the fourth-latest start for a Pacific typhoon season since reliable records began. It was an average season, with a total of 26 named storms, 13 typhoons, and six super typhoons. Despite the season's late start, the 2016 season was a normal and active season with a total of 53 tropical depressions, of which 26 became tropical storms. After five months of inactivity, the first tropical depression developed on May 26, making it the fifth-latest season for a system to form. According to existing records only four other seasons started later—the 1973, 1983, 1984, and 1998 seasons. Tropical activity throughout the basin became marginally favorable for development, and two tropical depressions developed during June. On July 3, Nepartak became the first named tropical storm, making it the second-latest first named storm on record. Nepartak's naming ended a 199-day period (from December 17, 2015, to July 2, 2016) during which no named storm was active within the basin; this period tied the 199-day period from December 22, 1997, to July 8, 1998.[34] Nepartak reached Category 5 super typhoon intensity before making landfall in Taiwan and East China, causing a total of US$1.52 billion of damage. In late July, Tropical Storm Mirinae reached its peak intensity while making landfall over Red River Delta in Northern Vietnam. The storm caused a total of US$334 million of damage in Hainan and Vietnam. Later, Nida reached near typhoon strength; it affected the Philippines, South China and Vietnam, but its damage was lower than that of Mirinae. The season became more active in August, with 7 named storms. Except Dianmu, which affected South China, Indochina, all of the tropical cyclones in August affected Japan and the Russian Far East. By the end of August, three storms (Chanthu, Lionrock and Kompasu) had hit the Japanese island of Hokkaidō, the most since 1951.[35] Lionrock was a large, powerful, long-lived and erratic tropical cyclone which caused significant flooding and casualties in North Korea and Japan in late August.
In September, Typhoon Meranti became the strongest typhoon in terms of pressure since Typhoon Megi in 2010, as well as the strongest typhoon in terms of sustained winds since Typhoon Haiyan in 2013, and the second-strongest tropical cyclone worldwide in 2016, only behind Cyclone Winston, in terms of pressure. Typhoon Megi reached its peak intensity as a Category 3 typhoon while making landfall over Taiwan. Both Meranti and Megi made landfall in Fujian, China, and they caused a total of US$3.6 billion of damage. Rai became a weak tropical storm before it made landfall in Vietnam, Laos and Thailand in mid-September, causing flooding and moderate damage. Typhoon Malakas impacted Japan with a total of nearly $740 million of damage as a Category 4 typhoon. In late September and early October, Typhoon Chaba reached Category 5 super typhoon intensity and became the strongest tropical cyclone to make landfall in South Korea since Sanba in 2012. Chaba also caused 7 deaths in the country.[36] A tropical depression formed east of the International Date Line on October 3, and entered the basin before developing into Typhoon Songda. Songda struck the Pacific Northwest region of the United States and Canada as a powerful extratropical cyclone.[37] Severe Tropical Storm Aere affected parts of Southeast Asia in mid-October, including the worst flooding in Vietnam since 2010, causing a total of US$209 million of damage.[38] Later, Typhoon Sarika became a powerful typhoon, and affected the Philippines, China and Vietnam, causing severe damage as well as severe flooding in southern China. After Sarika, Typhoon Haima reached Category 5 super typhoon strength before impacting the Philippines and China, causing a total of US$1.93 billion in damages. Haima was the most severe tropical cyclone to affect Hong Kong in October since 1995. In early November, a tropical depression made landfall in Southern Vietnam and caused heavy flooding throughout central and southern Vietnam, causing moderate damage. In late December, Nock-ten became the strongest Christmas tropical cyclone on record anywhere in the world since at least 1960 in terms of 1-minute sustained winds, before impacting the Philippines.[39][40]
North Indian Ocean[]

The 2016 season was the deadliest season since 2010, killing more than 400 people. The season was an average one, seeing four named storms, with one further intensifying into a very severe cyclonic storm. The season officially started with the formation of Cyclone Roanu over in the Bay of Bengal on 17 May. The beginning of June witnessed no storms, although many low-pressure areas formed over Bay of Bengal, but none of them intensified into a depression, due to a very strong southwest monsoon. At the end of June, Depression ARB 01 formed, but weakened within two days. July witnessed no storms until a deep depression formed in August, under the influence of an upper air cyclonic circulation over Gangetic West Bengal. However, multiple low-pressure areas developed over the Bay of Bengal, with Cyclonic Storm Kyant forming in October and Cyclonic Storm Nada in November. Due to the presence of warm sea surface temperatures, Very Severe Cyclone Vardah formed in December.
South-West Indian Ocean[]


January–June[]
Five named storms were formed, including one which was unnamed and another one was crossed from the Australian region. Corentin formed on January 20.[41] In February, the basin became somewhat active with Daya forming,[42] and Uriah entering the basin days later.[43] Emeraude formed in March, quickly peaking at intense tropical cyclone strength, before quickly weakening.[44] Moderate Tropical Storm 07 formed at the end of March.[45] In April, the season began to wind down. Very Intense Tropical Cyclone Fantala formed near the end of the month, and reached peak intensity as the strongest tropical cyclone recorded in the basin in terms of sustained winds. Fantala dissipated on April 24, ending the season.[46]
July–December[]
Two systems were formed in 2016, in fact was the least active.
Australian Region[]


January–June[]
During the season only three tropical cyclones developed within the Australian region, which meant that the season was considered to be the least active season since reliable records started in 1969.[47][48] This low activity was partially attributed to the 2014–16 El Niño event, which caused systems to be displaced eastwards into the South Pacific tropical cyclone basin. A positive Indian Ocean Dipole event caused cooler-than-normal waters in tropical eastern Indian Ocean, near Indonesia, which in turn limited development near Western Australia during the first part of the season.
Stan subsequently made landfall on Western Australia and impacted various commodities including oil, natural gas, and iron ore. However, impacts were limited due to the low population of the region. The precursor tropical low to Tropical Cyclone Uriah developed over the Indian Ocean, within a monsoon trough of low pressure during 9 February. The system subsequently developed further and was named Uriah during 13 February, before it moved out of the region during the following day. Tropical Cyclone Tatiana developed into a tropical cyclone, during 11 February while it was located over the Coral Sea. Over the next few days, the system remained over water and dissipated during 15 February after it had produced some powerful, long period swells along Queensland beaches. After Tatiana dissipated four tropical lows occurred in the region before the season ended on 30 April, including the remnant tropical low of Severe Tropical Cyclone Winston.
July–December[]
Eight systems and one named storms were formed in 2016.
South Pacific Ocean[]


January–June[]
The season was one of the most disastrous South Pacific tropical cyclone seasons on record, with a total of 50 deaths and $1.405 billion (2016 USD) in damage. Throughout the season, 8 systems attained tropical cyclone status, whilst 5 became severe tropical cyclones. The most notable cyclone of the season by far was Winston, which attained a minimum pressure of 884 hPa (mbar; 26.10 inHg), and maximum ten-minute sustained winds of 175 mph (280 km/h), making it the most intense tropical cyclone on record in the Southern Hemisphere. Winston went on to devastate Fiji, causing $1.4 billion (2016 USD) in damage and 44 deaths across the country.
Meanwhile, 06F developed to the north of Wallis Island, but was absorbed by Cyclone Ula. Victor ended the first slew of storms, dissipating on January 24. Following this, the basin was dormant for three weeks; however, a slew of storms began forming in February. Winston led off the month, forming on February 7. Similar to Ula, the storm attained a preliminary peak, weakened, but later rapidly re-intensified into a Category 5 severe tropical cyclone, making landfall near Suva, Fiji, at peak strength. This made Winston the strongest tropical cyclone on record to impact Fiji. Winston then moved southwest, out of the basin, on February 26, dissipating on March 1. Cyclone Tatiana briefly moved into the basin on February 12, but dissipated the next day, as it exited the basin. Cyclone Yalo and a tropical depression followed to this: Yalo dissipated on February 26, while 12F dissipated on March 1. The basin became dormant again as the season wound down. Despite this, Tropical Depression 13F formed on March 19, and dissipated three days later. The basin once again became dormant again, as the end of March neared, until another tropical depression formed in early April. One of the three depressions became Cyclone Zena, which caused more problems to the nearly decimated Fiji. Cyclone Amos formed in late April and moved over Samoa and American Samoa.
July–December[]
After a near average but destructive tropical cyclone season during the previous year, the first tropical disturbance of the season developed to the north-northeast of Niue during November 12.[49] However, over the next few months, no named tropical cyclones developed. This was attributed to a number of factors, including a poorly organised South Pacific convergence zone and a predicted La Niña episode not developing.[49]
South Atlantic Ocean[]

Three systems and two named subtropical or tropical storms were formed in 2016. On 5 January 2016, the Hydrographic Center of the Brazilian Navy issued warnings on a subtropical depression that formed east of Vitória, Espírito Santo.[50] On the next day, the system strengthened into a tropical depression, and other agencies considered the system an invest, designating it as 90Q;[51][52] however, on 7 January, the tropical depression dissipated.[51][53]
A subtropical depression formed southwest of Rio de Janeiro on 15 November 2016.[54] It intensified into a subtropical storm and received the name Deni on 16 November.[55] Moving south-southeastwards, Deni soon became extratropical shortly before 00:00 UTC on 17 November.[56]
An extratropical cyclone entered the South Atlantic Ocean from Santa Catarina early on 4 December 2016.[57] Later, it intensified quickly and then transitioned into a subtropical storm shortly before 22:00 BRST (00:00 UTC on 5 December), with the name Eçaí assigned by the Hydrographic Center of the Brazilian Navy.[58] Eçaí started to decay on 5 December, and weakened into a subtropical depression at around 00:00 UTC on 6 December.[59]
Mediterranean Sea[]

Two tropical system were formed in Mediterranean Ocean during 2016. Early on 28 October 2016, 56 km/h (35 mph) an extratropical cyclone began to develop to the south of Calabria, in the Ionian sea. The system quickly intensified, attaining wind speeds of 80 km/h (50 mph) as it slowly moved to the west, causing high waves and minor damage to cars near the Maltese city of Valletta, weakening the following day and beginning to move eastwards. However, later that day, it began to re-intensify and underwent a tropical transition. At 12:00 UTC on 30 October, the system showed 10-minute sustained winds of 104 km/h (64 mph; 56 kn). It became a tropical storm on 31 October. After passing over Crete, the storm began to quickly weaken, with the storm degenerating into an extratropical low on 1 November. Tropical Storm 90M was also nicknamed "Medicane Trixi" by some media outlets in Europe during its duration. No fatalities or rainfall statistics have been reported for this system that was over open waters for most of the time.[citation needed]
Systems[]
January[]

| Storm name | Dates active | Basin | Max wind km/h (mph) |
Pressure (hPa) |
Areas affected | Damage (USD) |
Deaths | Refs |
|---|---|---|---|---|---|---|---|---|
| Pali | January 7–15 | Central Pacific | 155 (100) | 977 | Kiribati | Unknown | 4 | [60][61][62][63][64] |
| Alex | January 12–15 | North Atlantic | 140 (85) | 981 | Bermuda, Azores | Minimal | 1 | [21] |
| Victor | January 14–22 | South Pacific | 150 (90) | 958 | Northern Cook Islands, Niue, Tonga | None | None | |
| 07U | January 19–25 | Australian Region | Unknown | Unknown | None | None | None | |
| Corentin | January 20–25 | Southwest Indian | 110 (70) | 970 | None | None | None | [41] |
| Stan | January 27–31 | Australian Region | 100 (65) | 980 | Western Australia, South Australia, Victoria | Unknown | None |
February[]

| Storm name | Dates active | Basin(s) | Max wind km/h (mph) |
Pressure (hPa) |
Areas affected | Damage (USD) |
Deaths | Refs |
|---|---|---|---|---|---|---|---|---|
| Winston | February 7- March 3 | South Pacific | 280 (175) | 884 | Vanuatu, Fiji, Tonga, Niue | $1.4 billion | 44 | [1][65] |
| Daya | February 8–12 | Southwest Indian | 75 (45) | 992 | Madagascar, Réunion, Mauritius | Unknown | None | [42] |
| Uriah | February 9–19 | Australian Region Southwest Indian |
205 (125) | 925 | Cocos (Keeling) Islands | Minor | None | [43] |
| Tatiana | February 9–14 | Australian Region South Pacific |
95 (60) | 982 | Queensland | None | None | |
| 11U | February 14–16 | Australian Region | Unknown | Unknown | None | None | None | |
| Yalo | February 24–26 | South Pacific | 75 (45) | 993 | Cook Islands, French Polynesia | None | None | |
| 12F | February 29–March 1 | South Pacific | Unknown | 1000 | French Polynesia | None | None |
March[]

| Storm name | Dates active | Basin | Max wind km/h (mph) |
Pressure (hPa) |
Areas affected | Damage (USD) |
Deaths | Refs |
|---|---|---|---|---|---|---|---|---|
| March 1–6 | Australian Region | 65 (40) | 1000 | None | None | None | ||
| March 14–16 | Australian Region | 55 (35) | 998 | Northern Territory, Queensland | None | None | ||
| Emeraude | March 15–21 | Southwest Indian | 205 (125) | 940 | None | None | None | [44] |
| 13F | March 19–22 | South Pacific | Unknown | 998 | New Caledonia, Vanuatu | None | None | |
| 07 | March 28–30 | Southwest Indian | 85 (50) | 992 | None | None | None | [45] |
April[]
| Storm name | Dates active | Basin | Max wind km/h (mph) |
Pressure (hPa) |
Areas affected | Damage (USD) |
Deaths | Refs |
|---|---|---|---|---|---|---|---|---|
| 14F | April 1–5 | South Pacific | Unknown | 1002 | Vanuatu | None | None | |
| 15F | April 2–6 | South Pacific | Unknown | 998 | Fiji | None | None | |
| Zena | April 5–7 | South Pacific | 130 (80) | 975 | Solomon Islands, Vanuatu, Fiji, Tonga | Minimal | 2 | [66] |
| Fantala | April 11–23 | Southwest Indian | 250 (155) | 910 | Agaléga, Seychelles, Madagascar, Tanzania | $4.5 million | 13 | [67] |
| Amos | April 20–24 | South Pacific | 150 (90) | 965 | Fiji, Wallis and Futuna, Samoan Islands | Minimal | None | |
| 18F | April 20–27 | South Pacific | Unknown | 1002 | French Polynesia | None | None |
May[]

| Storm name | Dates active | Basin | Max wind km/h (mph) |
Pressure (hPa) |
Areas affected | Damage (USD) |
Deaths | Refs |
|---|---|---|---|---|---|---|---|---|
| Roanu | May 17–22 | North Indian | 85 (50) | 983 | Sri Lanka, East coast of India, Bangladesh, Myanmar, Yunnan | $2.03 billion | 135 | [68][69][70] |
| 01W | May 25–27 | West Pacific | Unknown | 1000 | South China | $8.7 million | None | |
| Bonnie | May 27–June 4 | North Atlantic | 75 (45) | 1006 | The Bahamas, Southeastern United States | $640,000 | 2 | [71][72][73][22] |
June[]

| Storm name | Dates active | Basin | Max wind km/h (mph) |
Pressure (hPa) |
Areas affected | Damage (USD) |
Deaths | Refs |
|---|---|---|---|---|---|---|---|---|
| Colin | June 5–7 | North Atlantic | 85 (50) | 1001 | Yucatán Peninsula, Cuba, Florida, East Coast of the United States | $1.04 million | 6 | [74][23] |
| One-E | June 6–8 | West Pacific | 55 (35) | 1006 | Southwestern Mexico | Minor | None | [75] |
| Danielle | June 19–21 | North Atlantic | 75 (45) | 1007 | Yucatán Peninsula, Eastern Mexico | Minimal | 1 | [76][77] |
| TD | June 22–23 | West Pacific | 55 (35) | 1006 | Vietnam | Nine | None | |
| Ambo | June 25–28 | West Pacific | 55 (35) | 1004 | Philippines, South China | None | None | |
| ARB 01 | June 27–29 | North Indian | 45 (30) | 996 | Oman, Gujarat | None | None |
July[]

| Storm name | Dates active | Basin(s) | Max wind km/h (mph) |
Pressure (hPa) |
Areas affected | Damage (USD) |
Deaths | Refs |
|---|---|---|---|---|---|---|---|---|
| Nepartak (Butchoy) | July 2–10 | West Pacific | 205 (125) | 900 | Philippines, Ryukyu Islands, Taiwan, East China | $1.89 billion | 111 | [78] |
| Agatha | July 2–5 | East Pacific | 85 (50) | 1002 | None | None | None | [79] |
| Blas | July 2–10 | East Pacific | 220 (140) | 947 | Hawaii | None | None | [80][81][82] |
| Celia | July 6–16 | East Pacific | 155 (100) | 972 | Hawaii | None | 2 | [83] |
| LAND 01 | July 6–7 | North Indian | 45 (30) | 996 | East India | Unknown | None | |
| Darby | July 11–26 | East Pacific | 195 (120) | 958 | Hawaii | Minimal | None | [84] |
| Estelle | July 15–22 | East Pacific | 110 (70) | 990 | None | None | None | [85] |
| 03W | July 15–20 | West Pacific | Unknown | 1006 | Ryukyu Islands | None | None | |
| Abela | July 15–20 | Southwest Indian | 95 (60) | 987 | Madagascar | None | None | |
| Frank | July 21–28 | East Pacific | 140 (85) | 979 | Baja California Peninsula, Nayarit | None | None | [86][87][88] |
| Georgette | July 21–27 | East Pacific | 215 (130) | 952 | Hawaii | None | None | [89] |
| Lupit | July 22–24 | West Pacific | 75 (45) | 1000 | None | None | None | |
| Mirinae | July 25–28 | West Pacific | 100 (65) | 980 | South China, Indochina | $346 million | 7 | [90][91] |
| Nida (Carina) | July 29–August 3 | West Pacific | 110 (70) | 975 | Philippines, Taiwan, South China, Vietnam | $316 million | 6 | [90][92] |
| Howard | July 31–August 3 | East Pacific | 95 (60) | 998 | Hawaii | None | None | [93] |
August[]

| Storm name | Dates active | Basin | Max wind km/h (mph) |
Pressure (hPa) |
Areas affected | Damage (USD) |
Deaths | Refs |
|---|---|---|---|---|---|---|---|---|
| Earl | August 2–6 | North Atlantic | 140 (85) | 979 | Lesser Antilles, Puerto Rico, Hispaniola, Jamaica, Cayman Islands, Central America, Mexico | $250 million | 94 | [25] |
| Ivette | August 2–8 | East Pacific | 95 (60) | 1000 | Hawaii | None | None | [94] |
| Omais | August 2–9 | West Pacific | 110 (70) | 975 | Guam, Japan | None | None | |
| TD | August 6–9 | West Pacific | Unknown | 998 | Ryukyu Islands, East China | None | None | |
| Javier | August 7–9 | East Pacific | 100 (65) | 997 | Mexico | Minimal | None | |
| Conson | August 7–15 | West Pacific | 85 (50) | 985 | Japan | None | None | |
| LAND 02 | August 9–12 | North Indian | 55 (35) | 994 | Bangladesh, India | Minimal | 2 | |
| TD | August 10–13 | West Pacific | Unknown | 996 | Ryukyu Islands, Taiwan, East China | None | None | |
| TD | August 10–12 | West Pacific | Unknown | 1010 | Midway Atoll | None | None | |
| Chanthu | August 12–17 | West Pacific | 100 (65) | 980 | Japan | $94.7 million | None | |
| TD | August 12–13 | West Pacific | Unknown | 1002 | Taiwan | None | None | |
| Dianmu | August 15–20 | West Pacific | 85 (50) | 980 | China, Vietnam, Laos, Thailand, Myanmar, Bangladesh, India | $481.1 million | 22 | |
| TD | August 15–16 | West Pacific | Unknown | 996 | South China, Vietnam | None | None | |
| Fiona | August 16–23 | North Atlantic | 85 (50) | 1004 | Bermuda | None | None | [95] |
| BOB 02 | August 16–20 | North Indian | 55 (35) | 994 | Bangladesh, India | Minimal | 6 | |
| Mindulle | August 17–23 | West Pacific | 120 (75) | 975 | Mariana Islands, Japan | $448.3 million | 3 | |
| Lionrock (Dindo) | August 17–30 | West Pacific | 220 (140) | 940 | Japan, Russian Far East, North Korea | $3.84 billion | 550 | |
| Kay | August 18–23 | East Pacific | 85 (50) | 1000 | Mexico | None | None | |
| Kompasu | August 18–21 | West Pacific | 65 (40) | 994 | Guam, Japan | Minimal | 1 | |
| Gaston | August 22–September 2 | North Atlantic | 195 (120) | 955 | Flores Island | None | None | [26] |
| TD | August 23–24 | West Pacific | Unknown | 1000 | Philippines | None | None | |
| 14W | August 23–24 | West Pacific | 55 (35) | 1002 | Guam | None | None | |
| TD | August 24 | West Pacific | Unknown | 1000 | None | None | None | |
| Lester | August 25–September 7 | East Pacific | 230 (145) | 944 | Hawaii | Minimal | None | |
| Madeline | August 26–September 2 | East Pacific | 215 (130) | 950 | Hawaii | Minimal | None | |
| TD | August 27 | West Pacific | Unknown | 1004 | None | None | None | |
| Eight | August 28–September 1 | North Atlantic | 55 (35) | 1010 | Cape Hatteras | Minimal | None | [96] |
| Hermine | August 28–September 8 | North Atlantic | 130 (80) | 981 | Dominican Republic, Cuba, The Bahamas, Florida, East coast of the United States, Atlantic Canada | $550 million | 4 (1) | |
| TD | August 30–31 | West Pacific | Unknown | 1004 | None | None | None | |
| Namtheun (Enteng) | August 31–September 5 | West Pacific | 130 (80) | 955 | Taiwan, Japan | Minimal | None |
September[]
| Storm name | Dates active | Basin | Max wind km/h (mph) |
Pressure (hPa) |
Areas affected | Damage (USD) |
Deaths | Refs |
|---|---|---|---|---|---|---|---|---|
| Newton | September 4–7 | East Pacific | 150 (90) | 977 | Baja California Peninsula, Northwestern Mexico, Southwestern United States | $95.8 million | 9 | |
| Malou | September 5–7 | West Pacific | 75 (45) | 1000 | Japan | Minimal | None | |
| TD | September 7–8 | West Pacific | Unknown | 998 | Japan | None | None | |
| Meranti (Ferdie) | September 8–16 | West Pacific | 220 (140) | 890 | Philippines, Taiwan, Mainland China, South Korea | $4.79 billion | 47 | |
| TD | September 9–10 | West Pacific | Unknown | 1008 | None | None | None | |
| TD | September 10 | West Pacific | Unknown | 1008 | Taiwan | None | None | |
| 17W | September 10–12 | West Pacific | 65 (40) | 1008 | None | None | None | |
| Orlene | September 11–17 | East Pacific | 175 (110) | 967 | None | None | None | |
| Rai | September 11–13 | West Pacific | 55 (35) | 996 | Vietnam, Laos, Thailand, Cambodia | $37 million | 12 | |
| Malakas (Gener) | September 11–20 | West Pacific | 175 (110) | 930 | Mariana Islands, Taiwan, Japan | $300 million | 1 | |
| Ian | September 12–16 | North Atlantic | 95 (60) | 994 | None | None | None | [97] |
| Julia | September 13–18 | North Atlantic | 85 (50) | 1007 | The Bahamas, Southeastern United States | $6.13 million | None | [98] |
| Karl | September 14–25 | North Atlantic | 110 (70) | 988 | Bermuda | Minimal | None | [99] |
| Paine | September 18–20 | East Pacific | 150 (90) | 979 | Baja California Peninsula | None | None | |
| Lisa | September 19–25 | North Atlantic | 85 (50) | 999 | None | None | None | [100] |
| Megi (Helen) | September 22–29 | West Pacific | 155 (100) | 945 | Caroline Islands, Ryukyu Islands, Taiwan, China | $1.56 billion | 52 | |
| 01U | September 23–29 | Australian Region | Unknown | Unknown | None | None | None | |
| Chaba (Igme) | September 24–October 5 | West Pacific | 215 (130) | 905 | Mariana Islands, South Korea, Japan, Russian Far East | $2.61 billion | 10 | |
| Roslyn | September 25–29 | East Pacific | 85 (50) | 999 | None | None | None | |
| Ulika | September 26–30 | Central Pacific | 120 (75) | 992 | None | None | None | |
| Matthew | September 28–October 9 | North Atlantic | 270 (165) | 934 | Windward Islands, Leeward Antilles, Venezuela, Colombia, Jamaica, Hispaniola, Puerto Rico, Cuba, Turks and Caicos Islands, The Bahamas, Southeastern United States, Atlantic Canada | $15.09 billion | 603 | [29] |
October[]

| Storm name | Dates active | Basin | Max wind km/h (mph) |
Pressure (hPa) |
Areas affected | Damage (USD) |
Deaths | Refs |
|---|---|---|---|---|---|---|---|---|
| Bransby | October 2–6 | Southwest Indian | 100 (65) | 987 | None | None | None | |
| Songda | October 4–13 | West Pacific | 185 (115) | 925 | Pacific Northwest | Unknown | None | |
| Aere (Julian) | October 4–14 | West Pacific | 110 (70) | 975 | Philippines, Taiwan, South China, Indochina | $112 million | 35 | |
| Nicole | October 4–18 | North Atlantic | 220 (140) | 950 | Bermuda | $15 million | 1 | [30] |
| 02U | October 12–18 | Australian Region | Unknown | 1004 | None | None | None | |
| Sarika (Karen) | October 13–19 | West Pacific | 175 (110) | 935 | Philippines, South China, Vietnam | $866 million | 37 | |
| Haima (Lawin) | October 14–21 | West Pacific | 215 (130) | 900 | Caroline Islands, Philippines, Taiwan, China, Japan | $972 million | 19 | |
| TD | October 15 | West Pacific | Unknown | 1008 | None | None | None | |
| Kyant | October 21–28 | North Indian | 75 (45) | 996 | Andaman Islands, Myanmar, South India | None | None | |
| Seymour | October 23–28 | East Pacific | 240 (150) | 940 | Baja California | None | None | |
| Trixi | October 28–31 | Mediterranean | 105 (65) | Unknown | Calabria, Malta, Greece | None | None | |
| Meari | October 30–November 7 | West Pacific | 140 (80) | 960 | Mariana Islands | None | None | |
| TD | October 31 | West Pacific | Unknown | 1008 | Mariana Islands | None | None |
November[]

| Storm name | Dates active | Basin | Max wind km/h (mph) |
Pressure (hPa) |
Areas affected | Damage (USD) |
Deaths | Refs |
|---|---|---|---|---|---|---|---|---|
| TD | November 1–5 | West Pacific | 55 (35) | 998 | None | None | None | |
| TD | November 2–6 | West Pacific | 55 (35) | 1004 | Borneo, Indochina | $48.1 million | 15 | |
| BOB 04 | November 2–6 | North Indian | 45 (30) | 1000 | Malaysia, Thailand, West Bengal, Bangladesh | Unknown | 80 | |
| Ma-on | November 8–13 | West Pacific | 65 (40) | 1002 | None | None | None | |
| 28W | November 9–12 | West Pacific | Unknown | 1008 | Marshall Islands | None | None | |
| 03U | November 9–15 | Australian Region | Unknown | 1005 | None | None | None | |
| 01F | November 12–13 | South Pacific | Unknown | 1008 | None | None | None | |
| Tina | November 13–14 | East Pacific | 65 (40) | 1004 | Western Mexico | None | None | |
| Deni | November 15–16 | South Atlantic | 75 (45) | 998 | Brazil | None | None | |
| Otto | November 20–26 | North Atlantic, East Pacific | 185 (115) | 975 | Panama, Costa Rica, Nicaragua, Columbia | ≥ $192.2 million | 23 | [101] |
| Tokage (Marce) | November 24–28 | West Pacific | 95 (60) | 992 | Philippines, Vietnam | $30 thousand | 1 | |
| 02F | November 23–27 | South Pacific | Unknown | 1006 | None | None | None | |
| 03F | November 27–30 | Australian Region, South Pacific | Unknown | 1000 | Solomon Islands | None | None | |
| Nada | November 29–December 2 | North Indian | 75 (45) | 1000 | Sri Lanka, South India | Unknown | 12 |
December[]

| Storm name | Dates active | Basin | Max wind km/h (mph) |
Pressure (hPa) |
Areas affected | Damage (USD) |
Deaths | Refs |
|---|---|---|---|---|---|---|---|---|
| 04U | December 4–6 | Australian Region | Unknown | Unknown | None | None | None | |
| Eçaí | December 4–6 | South Atlantic | 100 (65) | 992 | Brazil | None | None | |
| Vardah/ARB 02 | December 6–18 | North Indian | 130 (80) | 975 | Sumatra, Andaman and Nicobar Islands, Thailand, Malaysia, Sri Lanka, Chennai (Tamil Nadu), Somalia | $3.37 billion | 47 | |
| 05U | December 9–17 | Australian Region | Unknown | Unknown | None | None | None | |
| TD | December 10–13 | West Pacific | 55 (35) | 1004 | Vietnam | $53.4 million | 30 | |
| 04F | December 12–23 | South Pacific | 45 (30) | 998 | Fiji | $4.7 million | None | |
| 06U | December 18–23 | Australian Region | 55 (35) | 994 | Western Australia | None | None | |
| Yvette | December 19–25 | Australian Region | 85 (50) | 987 | Western Australia | None | None | |
| Nock-ten (Nina) | December 20–28 | West Pacific | 195 (120) | 915 | Caroline Islands, Philippines, Vietnam | $123 million | 13 | |
| 05F | December 21–26 | South Pacific | Unknown | 1005 | None | None | None | |
| TD | December 27 | West Pacific | Unknown | 1004 | None | None | None |
Global effects[]
See also[]
Notes[]
- ^ The "strength" of a tropical cyclone is measured by the minimum barometric pressure, not wind speed. Most meteorological organizations rate the intensity of a storm by this figure, so the lower the minimum pressure of the storm, the more intense or "stronger" it is considered to be. The strongest winds were actually from Meranti, at 195 mph (315 km/h).
1 Only systems that formed either on or after January 1, 2016 are counted in the seasonal totals.
2 Only systems that formed either before or on December 31, 2016 are counted in the seasonal totals.
3 The wind speeds for this tropical cyclone/basin are based on the IMD scale which uses 3-minute sustained winds.
4 The wind speeds for this tropical cyclone/basin are based on the Saffir–Simpson scale which uses 1-minute sustained winds.
5The wind speeds for this tropical cyclone are based on Météo-France which uses gust winds.
References[]
- ^ a b Diamond, Howard (5 July 2017). "Southwest Pacific Enhanced Archive for Tropical Cyclones (SPEArTC)". Retrieved 6 July 2017.
- ^ Stewart, Stacy R (April 3, 2017). Tropical Cyclone Report: Hurricane Matthew (PDF) (Technical report). United States National Hurricane Center. Retrieved April 5, 2017.
- ^ "Haiti: Cholera spreads from Hurricane Mathew, death toll reaches 546". News Ghana.com. News Ghana. Retrieved 14 October 2016.
- ^ "Bridge damaged by Hurricane Matthew collapses in Cuba, killing 4". BNO News. November 23, 2016. Archived from the original on November 24, 2016. Retrieved November 23, 2016.
- ^ "Hurricane Matthew slams Haiti, takes aim at US East Coast". Associated Press.
- ^ "One dead as Matthew batters Eastern Caribbean". Jamaica Observer. Kingstown, St. Vincent. Caribbean Media Corporation. September 30, 2016. Retrieved September 30, 2016.
- ^ "Indian Ocean Dipole: What is it and why is it linked to floods and bushfires?". BBC News. 2019-12-07. Retrieved 2021-01-03.
- ^ Becker, Emily (14 January 2016). "ENSO Blog: January El Niño update: It's got a lot going on". ENSO Blog. Archived from the original on 2 June 2016.
- ^ Becker, Emily (April 18, 2021) [May 11, 2016]. "May 2016 El Niño/La Niña update: Switcheroo!". www.climate.gov.
- ^ "Pacific Enso Update. 2nd Quarter, 2016 Vol. 22, No. 2 ISSUED: May 23rd, 2016" (PDF). www.weather.gov.
- ^ a b Becker, Emily (11 February 2016). "ENSO Blog: February 2016 El Niño update: Q & A...and some Thursday-morning quarterbacking". Climate.Gov. United States National Oceanic and Atmospheric Administration. Archived from the original on 19 June 2016.
- ^ Becker, Emily (9 March 2016). "ENSO Blog: March 2016 El Niño update: Spring Forward". Climate.Gov. United States National Oceanic and Atmospheric Administration. Archived from the original on 19 June 2016.
- ^ Becker, Emily (14 April 2016). "ENSO Blog: April 2016 El Niño/La Niña update: What goes up..." Climate.Gov. United States National Oceanic and Atmospheric Administration. Retrieved 29 May 2016.
- ^ Becker, Emily (9 June 2016). "ENSO Blog: June 2016 ENSO discussion: The new neutral". Climate.Gov. United States National Oceanic and Atmospheric Administration. Archived from the original on 11 June 2016.
- ^ a b Tracey Peake & Lian Xie (April 15, 2016). "East Coast Should Expect Active Hurricane Season, Researchers Say". North Carolina State University. Retrieved April 25, 2017.
- ^ Philip J. Klotzbach (November 30, 2016). Summary of 2016 Atlantic Seasonal Tropical Cyclone Activity and Verification of Author's Seasonal and Two-week Forecasts (PDF) (Report). Archived from the original (PDF) on March 12, 2017. Retrieved April 24, 2017.
- ^ Lusa (January 16, 2016). "Furacão Alex impede socorro da Força Aérea e doente morre". Público (in Portuguese). Archived from the original on January 17, 2016. Retrieved January 17, 2016.
- Christal Hayes (May 30, 2016). "Rip currents cause Kissimmee man to drown at beach, officials day". Orlando Sentinel. Retrieved May 30, 2016.
- "Body of missing swimmer found on Kure Beach". WECT News. May 31, 2016. Archived from the original on 2017-01-14. Retrieved May 31, 2016.
- Kayle Gaskins (June 8, 2016). "3 possibly 4 dead in Tuesday drownings along Panhandle beaches". WJHG-TV. Archived from the original on January 23, 2017. Retrieved March 30, 2017.
- "Storm Data and Unusual Weather Phenomena" (PDF). Storm Data. National Climatic Data Center. 58 (6). June 2016. ISSN 0039-1972. Archived from the original (PDF) on 2017-03-30. Retrieved March 30, 2017.
- "Tormenta Danielle causa un muerto en México". El Nuevo Dia (in Spanish). June 21, 2016. Retrieved June 22, 2016.
- Stacy R. Stewart (January 19, 2017). Tropical Cyclone Report: Hurricane Earl (PDF) (Technical report). National Hurricane Center. p. 1, 4, 5, 6. Retrieved March 31, 2017.
- "Tormenta 'Earl' deja en Guatemala 500 afectados" (in Spanish). El Financierio. Notimex. August 4, 2016. Retrieved August 8, 2016.
- Robbie J. Berg (January 30, 2017). Tropical Cyclone Report: Hurricane Hermine (PDF) (Technical report). National Hurricane Center. p. 7. Retrieved February 1, 2017.
- Elisha Fieldstadt (September 4, 2016). "'Far From Over': Hermine to Batter Northeast Coast With High Winds, Storm Surges". NBC. Retrieved September 4, 2016.
- "Storm Events Database: "Tropical Storm Julia"". National Centers for Environmental Information. 2017. Retrieved January 18, 2017.
- Stacy R. Stewart (April 3, 2017). Tropical Cyclone Report: Hurricane Matthew (PDF) (Technical report). National Hurricane Center. p. 12–23. Retrieved April 5, 2017.
- Sandra Guerrero Barriga (October 1, 2016). "'Matthew' coge fuerza en su avance frente a la Costa". El Heraldo (in Spanish). Retrieved October 1, 2016.
- "Bridge damaged by Hurricane Matthew collapses in Cuba, killing 4". BNO News. November 23, 2016. Archived from the original on 2016-11-24. Retrieved November 23, 2016.
- "'Absolutely unbelievable' road damage, some areas still cut off". CBC News. October 14, 2016. Retrieved October 17, 2016.
- Todd B. Kimberlain & Andrew S. Latto (April 10, 2017). Tropical Cyclone Report: Hurricane Nicole (PDF) (Technical report). National Hurricane Center. p. 6. Retrieved April 24, 2017.
- Irene Nolan (October 17, 2016). "Update: Body of missing swimmer found near Avon pier". Island Free Press. Retrieved October 19, 2016.
- Todd B. Kimberlain & Andrew S. Latto (April 10, 2017). Tropical Cyclone Report: Hurricane Otto (PDF) (Technical report). National Hurricane Center. p. 5. Retrieved April 24, 2017.
- "Hurricane Otto leaves at least nine dead in Costa Rica". Al Jazeera. November 26, 2016. Retrieved November 26, 2016.
- ^ Bob Henson; Jeff Masters (November 30, 2016). "Early, Late, and Far-Flung: The Eclectic 2016 Atlantic Hurricane Season". Weather Underground. Retrieved September 29, 2021.
- ^ a b Atlantic basin Comparison of Original and Revised HURDAT. Hurricane Research Division; Atlantic Oceanographic and Meteorological Laboratory (Report). National Oceanic and Atmospheric Administration. Retrieved April 19, 2017.
- ^ Phillip J. Klotzbach; William M. Gray (April 10, 2014). "Extended Range Forecast of Atlantic Seasonal Hurricane Activity and Landfall Strike Probability for 2014" (PDF). Colorado State University. Colorado State University. Archived from the original (PDF) on January 9, 2017. Retrieved May 12, 2017.
- ^ a b Eric S. Blake (September 13, 2016). Tropical Cyclone Report: Hurricane Alex (PDF) (Technical report). National Hurricane Center. pp. 2, 3. Retrieved May 12, 2017.
- ^ a b Michael J. Brennan (October 14, 2016). Tropical Cyclone Report: Tropical Storm Bonnie (PDF) (Technical report). National Hurricane Center. p. 2, 3. Retrieved May 12, 2017.
- ^ a b Richard J. Pasch & Andrew B. Penny (January 18, 2017). Tropical Cyclone Report: Tropical Storm Colin (PDF) (Technical report). National Hurricane Center. pp. 2, 3. Retrieved May 12, 2017.
- ^ "Monthly Atlantic Tropical Weather Summary". National Hurricane Center. August 1, 2016. Retrieved August 4, 2016.
- ^ a b Robbie J. Berg (January 19, 2017). Tropical Cyclone Report: Hurricane Earl (PDF) (Technical report). National Hurricane Center. pp. 1, 2, 6. Retrieved May 12, 2017.
- ^ a b Daniel P. Brown (January 11, 2017). Tropical Cyclone Report: Hurricane Gaston (PDF) (Technical report). National Hurricane Center. pp. 2, 3. Retrieved May 12, 2017.
- ^ Robbie J. Berg (January 30, 2017). Tropical Cyclone Report: Hurricane Hermine (PDF) (Technical report). National Hurricane Center. Retrieved May 12, 2017.
- ^ Lixion Avila (September 30, 2016). Hurricane Matthew Discussion Number 12 (Report). National Hurricane Center. Retrieved September 30, 2016.
- ^ a b Stacy R. Stewart (April 3, 2017). Tropical Cyclone Report: Hurricane Matthew (PDF) (Technical report). National Hurricane Center. p. 2, 3, 4, 5. Retrieved April 5, 2017.
- ^ a b Todd B. Kimberlain & Andrew S. Latto (February 15, 2017). Tropical Cyclone Report: Hurricane Nicole (PDF) (Technical report). National Hurricane Center. pp. 2, 3. Retrieved May 12, 2017.
- ^ a b Daniel P. Brown (April 10, 2017). Tropical Cyclone Report: Hurricane Otto (PDF) (Technical report). National Hurricane Center. Retrieved April 24, 2017.
- ^ Dorst Neal. When is hurricane season? (Report). Atlantic Oceanographic and Meteorological Laboratory. Archived from the original on 6 December 2010. Retrieved November 25, 2010.
- ^ "Hurricane Pali Recap, Earliest Central Pacific Hurricane on Record". The Weather Company. June 14, 2016. Retrieved March 24, 2021.
- ^ "Ranking of Typhoon Inactive Period (W. North Pacific) : Top 500". Digital Typhoon. Retrieved July 6, 2016.
- ^ Dave Ornauer (August 28, 2016). "Lionrock could give Tokyo area another drenching". Stars and Stripes. Archived from the original on August 28, 2016. Retrieved August 28, 2016.
- ^ "Typhoon Chaba leaves 7 dead, 3 missing in southern S. Korea". Yonhap News. 6 October 2016. Retrieved 7 October 2016.
- ^ Bob Henson (October 14, 2016). "Potential once-in-a-decade windstorm takes shape for Pacific Northwest". Weather Ungerground. Retrieved October 14, 2016.
- ^ "Mưa ở Quảng Bình là 'kỷ lục chưa từng có' – VnExpress". vnexpress.net. Retrieved November 13, 2016.
- ^ Klotzbach, Phil (December 25, 2016). "#Nockten's current intensity of 155 mph is strongest for TC anywhere around the globe on Christmas (UTC time) on record (since 1960)". Retrieved December 27, 2016.
- ^ Lam, Linda; Erdman, Jon (December 26, 2016). "Super Typhoon Nock-Ten (Nina), the Most Intense Christmas Tropical Cyclone in 56 Years, Hammers the Philippines". The Weather Channel. Retrieved December 27, 2016.
- ^ a b "CORENTIN : 20/01/2016 TO 31/01/2016". Météo-France. Retrieved January 11, 2017.
- ^ a b "DAYA : 07/02/2016 TO 13/02/2016". Météo-France. Retrieved January 16, 2017.
- ^ a b "URIAH : 11/02/2016 TO 25/02/2016". Météo-France. Retrieved February 19, 2017.
- ^ a b "EMERAUDE : 14/03/2016 TO 23/03/2016". Météo-France. Retrieved February 24, 2017.
- ^ a b "0720152016 : 27/03/2016 TO 30/03/2016". Météo-France. Retrieved February 26, 2017.
- ^ "FANTALA : 10/04/2016 TO 26/04/2016". Météo-France. Retrieved February 26, 2016.
- ^ "La Niña's coming, which means adios to our endless summer". News.Com.Au. April 29, 2016.
- ^ "3 cyclones mark slowest tropical season on record for Australia". www.accuweather.com. May 2, 2016. Archived from the original on 2019-10-07.
- ^ a b "Southwest Pacific Tropical Cyclone Outlook Update: This update for the latter half of the 2016–17 Tropical Cyclone (TC) season (February to April 2017) suggests near normal activity can still be expected". National Institute of Water and Atmospheric Research. February 10, 2017. Archived from the original on February 11, 2017. Retrieved February 10, 2017.
- ^ "Sea Level Pressure Chart 1200 UTC - 5 Jan 2016". Marinha do Brasil - Navy Hydrographic Center. Archived from the original (JPEG) on 6 January 2016. Retrieved 6 January 2016.
- ^ a b Jon Erdman (6 January 2016). "Could a Rare Tropical Storm Form in the South Atlantic Ocean?". weather.com. The Weather Company. Retrieved 8 February 2021.
- ^ "Invest-90Q Location File". United States Naval Research Laboratory–Monterey.[dead link]
- ^ "Rare January Depression in Central Pacific; Atlantic Subtropical Storm Next Week?".
- ^ "Weather and Sea Bulletin Issued at 1200 UTC - 15/NOV/2016". Brazilian Navy Hydrography Center. 15 November 2016. Archived from the original on 8 February 2015. Retrieved 15 November 2016.
- ^ "Weather and Sea Bulletin Issued at 0000 UTC - 16/NOV/2016". Brazilian Navy Hydrography Center. 16 November 2016. Archived from the original on 16 November 2016. Retrieved 16 November 2016.
- ^ "Weather and Sea Bulletin Issued at 0000 UTC - 17/NOV/2016". Brazilian Navy Hydrography Center. 17 November 2016. Archived from the original on 8 February 2015. Retrieved 17 November 2016.
- ^ "Sea Level Pressure Chart 0000 UTC for 4 Dec 2016" (in Portuguese). Brazilian Navy Hydrography Center. 4 December 2016. Archived from the original (JPEG) on 5 December 2016. Retrieved 5 December 2016.
- ^ "Weather and Sea Bulletin Issued at 0000 UTC - 05/DEC/2016". Brazilian Navy Hydrography Center. 5 December 2016. Archived from the original on 8 February 2015. Retrieved 5 December 2016.
- ^ "Weather and Sea Bulletin Issued at 0000 UTC - 06/DEC/2016". Brazilian Navy Hydrography Center. 6 December 2016. Archived from the original on 8 February 2015. Retrieved 6 December 2016.
- ^ Derek Wroe; Sam Houston (December 13, 2018). Hurricane Pali (PDF) (Report). Tropical Cyclone Report. Honolulu, Hawaii: Central Pacific Hurricane Center. Retrieved July 4, 2019.
- ^ Sam Houston; Tom Birchard (December 22, 2016). Tropical Depression Nine-C (Report). Tropical Cyclone Report. Honolulu, Hawaii: Central Pacific Hurricane Center. Archived from the original (PDF) on March 20, 2018. Retrieved May 3, 2021.
- ^ Erdman, John (January 1, 2016). "Tropical Depression Nine-C Dissipates; Caps Off a Record Central Pacific Hurricane Season". The Weather Company. Retrieved January 6, 2016.
- ^ Committee for Development Policy: 20th Plenary Session (PDF) (Report). United Nations Committee for Development. March 16, 2018. p. 13. Retrieved September 23, 2021.
- ^ Geospatial application in Kiribati (PDF) (Report). Intergovernmental Consultative Committee. October 16, 2017. p. 5. Retrieved September 23, 2021.
- ^ Masters, Jeff; Henson, Bob. "Winston's Damage Highest in South Pacific History; Extreme February Warmth in Eurasia". Retrieved 10 February 2018.
- ^ "Fijian residents prepare for long night as Cyclone Zena set to make landfall". One News NZ. April 8, 2016.
- ^ Athanase, Patsy; Uranie, Sharon (17 May 2016). "$4.5 million in damages from cyclone that hit remote Seychellois island, World Bank says". Victoria, Seychelles. Seychelles News Agency. Retrieved 26 May 2016.
- ^ "Sri Lanka finds more landslide fatalities, warns of flood-triggered health crisis". The Japan Times. AFP-JIJI. Retrieved 23 May 2016.
- ^ "Bangladesh avoids high death toll with cyclone evacuation". The New Indian Express. 23 May 2016. Retrieved 23 May 2016.
- ^ Nalaka Gunawardene (16 June 2016). "Cyclone Roanu exposed Sri Lankan disaster response gaps". SciDev.Net. Retrieved 16 June 2016.
- ^ "Tropical Storm Bonnie causes almost $700K in damages in Jasper County". Savannah Morning News. Jasper County Sun Times. June 9, 2016. Retrieved June 9, 2016.
- ^ WECT Staff (May 31, 2016). "Body of missing swimmer found on Kure Beach". WECT News. Retrieved May 31, 2016.
- ^ Christal Hayes (May 30, 2016). "Rip currents cause Kissimmee man to drown at beach, officials day". Orlando Sentinel. Retrieved May 30, 2016.
- ^ Terry Dickson (June 10, 2016). "Camden County woman's body found in creek 5 days after she and husband reported missing, DNR says". The Florida Times-Union. Brunswick, Georgia. Retrieved August 22, 2016.
- ^ "Tropical Depression ONE-E". Retrieved 1 September 2016.
- ^ "Tormenta Danielle causa un muerto en México". El Nuevo Dia (in Spanish). June 21, 2016. Retrieved June 22, 2016.
- ^ John L. Beven II (September 8, 2016). Tropical Cyclone Report: Tropical Storm Danielle (PDF) (Technical report). National Hurricane Center. pp. 1, 4. Retrieved May 12, 2017.
- ^ "Report on TC's Key Activities and Main Events in the Region, 2016" (PDF). ESCAP/WMO Typhoon Committee. January 9, 2017.
- ^ Stacy R. Stewart (September 19, 2016). Tropical Storm Agatha (PDF) (Report). Tropical Cyclone Report. Miami, Florida: National Hurricane Center. Retrieved December 3, 2021.
- ^ Richard J. Pasch (March 13, 2017). Hurricane Blas (PDF) (Report). Tropical Cyclone Report. Miami, Florida: National Hurricane Center. Retrieved December 3, 2021.
- ^ Dudley, Malika (July 15, 2016). "Increased Windward Showers From Remnants of Blas". mauinow.com. Retrieved July 16, 2016.
- ^ National Weather Service in Honolulu, Hawaii (August 4, 2016). July 2016 Precipitation Summary. National Oceanic and Atmospheric Administration (Report). National Weather Service. Retrieved August 7, 2016.
- ^ Daniel P. Brown (January 25, 2017). Hurricane Celia (PDF) (Report). Tropical Cyclone Report. Miami, Florida: National Hurricane Center. Retrieved December 3, 2021.
- ^ John P. Cangialosi (July 4, 2019). Hurricane Darby (PDF) (Report). Tropical Cyclone Report. Miami, Florida: National Hurricane Center. Retrieved December 3, 2021.
- ^ Robbie Berg (23 August 2016). Tropical Storm Estelle (PDF) (Report). Tropical Cyclone Report. Miami, Florida: National Hurricane Center. Retrieved 3 December 2021.
- ^ Lixion A. Avila (20 September 2016). Hurricane Frank (PDF) (Report). Tropical Cyclone Report. Miami, Florida: National Hurricane Center. Retrieved 3 December 2021.
- ^ "Tormenta 'Frank' causa inundaciones en Nayarit". Excelsior (in Spanish). July 23, 2016. Retrieved August 9, 2016.
- ^ "Tormenta Frank provoca inundaciones en Nayarit". Grupo Milenio (in Spanish). July 24, 2016. Retrieved August 9, 2016.
- ^ Eric S. Blake (27 October 2016). Hurricane Georgette (PDF) (Report). Tropical Cyclone Report. Miami, Florida: National Hurricane Center. Retrieved 3 December 2021.
- ^ a b "Phó Thủ tướng chỉ đạo ứng phó thiên tai, bão lũ" (in Vietnamese). Vietnam Government. August 8, 2016. Retrieved August 8, 2016.
- ^ "Ten killed, missing as storm Mirinae pounds northern Vietnam". Tuổi Trẻ News. Tuổi Trẻ. Retrieved July 31, 2016.
- ^ "Global Catastrophe Recap August 2016" (PDF). thoughtleadership.aonbenfield.com. Aon Benfield. Retrieved September 8, 2017.
- ^ Richard J. Pasch (21 March 2017). Tropical Storm Howard (PDF) (Report). Tropical Cyclone Report. Miami, Florida: National Hurricane Center. Retrieved 3 December 2021.
- ^ John L. Beven II; Christopher W. Landsea (18 January 2017). Tropical Storm Ivette (PDF) (Report). Tropical Cyclone Report. Miami, Florida: National Hurricane Center. Retrieved 3 December 2021.
- ^ Todd B. Kimerlain (November 11, 2016). Tropical Cyclone Report: Tropical Storm Fiona (PDF) (Technical report). National Hurricane Center. pp. 2, 3. Retrieved May 12, 2017.
- ^ John P. Cangialosi (December 6, 2016). Tropical Cyclone Report: Tropical Depression Eight (PDF) (Technical report). National Hurricane Center. pp. 2, 11. Retrieved May 12, 2017.
- ^ Lixion A. Avila (January 3, 2017). Tropical Cyclone Report: Tropical Storm Ian (PDF) (Technical report). National Hurricane Center. p. 2. Retrieved May 12, 2017.
- ^ Eric S. Blake (January 20, 2017). Tropical Cyclone Report: Tropical Storm Julia (PDF) (Technical report). National Hurricane Center. pp. 2, 3. Retrieved May 12, 2017.
- ^ Richard J. Pasch & David A. Zelinsky (January 4, 2017). Tropical Cyclone Report: Tropical Storm Karl (PDF) (Technical report). National Hurricane Center. p. 2. Retrieved May 12, 2017.
- ^ John L. Beven II (February 3, 2017). Tropical Cyclone Report: Tropical Storm Lisa (PDF) (Technical report). National Hurricane Center. p. 2. Retrieved May 12, 2017.
- ^ Daniel P. Brown (February 1, 2017). Hurricane Otto (PDF) (Report). Tropical Cyclone Report. National Hurricane Center. pp. 2, 3, 5. Retrieved February 1, 2017.
External links[]
| Tropical cyclone year articles (2010–2019) |
|---|
| 2010, 2011, 2012, 2013, 2014, 2015, 2016, 2017, 2018, 2019 |
Regional Specialized Meteorological Centers
- US National Hurricane Center – North Atlantic, Eastern Pacific
- Central Pacific Hurricane Center – Central Pacific
- Japan Meteorological Agency – NW Pacific
- India Meteorological Department – Bay of Bengal and the Arabian Sea
- Météo-France – La Reunion – South Indian Ocean from 30°E to 90°E
- Fiji Meteorological Service – South Pacific west of 160°E, north of 25° S
Tropical Cyclone Warning Centers
- Meteorology, Climatology, and Geophysical Agency of Indonesia – South Indian Ocean from 90°E to 141°E, generally north of 10°S
- Australian Bureau of Meteorology (TCWC's Perth, Darwin & Brisbane) – South Indian Ocean & South Pacific Ocean from 90°E to 160°E, generally south of 10°S
- Papua New Guinea National Weather Service – South Pacific Ocean from 141°E to 160°E, generally north of 10°S
- Meteorological Service of New Zealand Limited – South Pacific west of 160°E, south of 25°S
![]() This article incorporates public domain material from websites or documents of the National Weather Service.
This article incorporates public domain material from websites or documents of the National Weather Service.
- Tropical cyclones by year
- 2016 Atlantic hurricane season
- 2016 Pacific hurricane season
- 2016 Pacific typhoon season
- 2016 North Indian Ocean cyclone season
- 2015–16 Australian region cyclone season
- 2016–17 Australian region cyclone season
- 2015–16 South Pacific cyclone season
- 2016–17 South Pacific cyclone season
- 2015–16 South-West Indian Ocean cyclone season
- 2016–17 South-West Indian Ocean cyclone season
- 2016-related lists