2007 Pacific hurricane season
| 2007 Pacific hurricane season | |
|---|---|
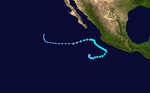
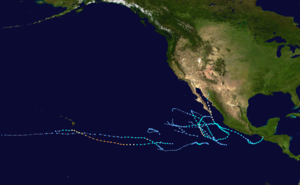 Season summary map | |
| Seasonal boundaries | |
| First system formed | May 27, 2007 |
| Last system dissipated | October 23, 2007 |
| Strongest storm | |
| Name | Flossie |
| • Maximum winds | 140 mph (220 km/h) (1-minute sustained) |
| • Lowest pressure | 949 mbar (hPa; 28.02 inHg) |
| Seasonal statistics | |
| Total depressions | 15 |
| Total storms | 11 |
| Hurricanes | 4 |
| Major hurricanes (Cat. 3+) | 1 |
| Total fatalities | 42 total, 9 missing |
| Total damage | $80 million (2007 USD) |
| Related articles | |
The 2007 Pacific hurricane season was a below-average Pacific hurricane season, featuring one major hurricane. The season officially started on May 15 in the eastern Pacific and on June 1 in the central Pacific, and ended on November 30; these dates conventionally delimit the period during which most tropical cyclones form in the region. The first tropical cyclone of the season, Alvin, developed on May 27, while the final system of the year, Kiko, dissipated on October 23. Due to unusually strong wind shear, activity fell short of the long-term average, with a total of 11 named storms, 4 hurricanes, and 1 major hurricane. At the time, 2007 featured the second-lowest value of the Accumulated cyclone energy (ACE) index since reliable records began in 1971. Two tropical cyclones – Cosme and Flossie – crossed into the central Pacific basin during the year, activity below the average of 4 to 5 systems.
Impact during the season was relatively minimal. In early June, Tropical Storm Barbara moved ashore just northwest of the Mexico–Guatemala border, causing $55 million (2007 USD)[nb 1] in damage and 4 deaths. In late July, Cosme passed south of the island of Hawaii as a weakening tropical depression; light rain and increased surf resulted. A few days later, Dalila passed offshore the coastline of southwestern Mexico, killing 11 and causing minimal damage. Hurricane Flossie followed a similar track to Cosme in mid-August, producing gusty winds and light precipitation in Hawaii. Hurricane Henriette in early September produced torrential rainfall in southwestern Mexico, killing 6 and causing $25 million in damage. Baja California received moderate rains from Hurricane Ivo in mid-September, though no damage nor fatalities were reported. In mid-October, Tropical Storm Kiko passed just offshore the coastline of southwestern Mexico. Though no deaths were reported on the Mexico mainland, the storm capsized a ship with 30 people on board, 15 of whom were recovered dead, and 9 of whom were reported missing. Overall, the season ended with $80 million in damage and 49 deaths.
Seasonal forecasts[]
| Source | Date | Named storms |
Hurricanes | Major hurricanes |
Ref |
| Average (1971–2006) | 15.3 | 8.8 | 4.2 | ||
| Record high activity | 27 | 16 (tie) | 11 | ||
| Record low activity | 8 (tie) | 3 | 0† (tie) | ||
| ––––––––––––––––––––––––––––––––––––––––––––––––––––––– | |||||
| CPC | May 23, 2007 | 11-16 | 6-9 | 2-4 | [1] |
| ––––––––––––––––––––––––––––––––––––––––––––––––––––––– | |||||
| Actual activity |
11 | 4 | 1 | ||
On May 21, 2007, the National Oceanic and Atmospheric Administration's Central Pacific Hurricane Center released its outlook for the 2007 Central Pacific hurricane season, predicting a total of 2–3 tropical cyclones to form or cross into the basin; in a typical season, 4–5 systems cross or form in the Central Pacific.[2] A day later, the National Oceanic and Atmospheric Administration's Climate Prediction Center released its seasonal prediction for the 2007 East Pacific hurricane season, predicting a total of 11–16 named storms, 6–9 hurricanes, and 2–4 major hurricanes. Below-average activity was expected as a result of either ENSO-Neutral or La Niña conditions, as well as the continuation of the reduction in activity beginning in 1995.[1][2]
Seasonal summary[]

The accumulated cyclone energy (ACE) index for the 2007 Pacific hurricane season was 35 units in the Eastern Pacific and 17.5625 units in the Central Pacific. The total ACE in the basin is 52.5625 units.[nb 2] which was a well below the 1981–2010 average of 113.3 units, and at the time the second-lowest value observed since reliable records began in 1971.[3] Broadly speaking, ACE is a measure of the power of a tropical or subtropical storm multiplied by the length of time it existed. It is only calculated for full advisories on specific tropical and subtropical systems reaching or exceeding wind speeds of 39 mph (63 km/h).
| Rank | Seasons | ACE value |
|---|---|---|
| 1 | 1977 | 22 |
| 2 | 2007 | 52 |
| 2010 | ||
| 4 | 1996 | 53 |
| 5 | 2003 | 56 |
| 6 | 1979 | 57 |
| 7 | 2004 | 71 |
| 8 | 1981 | 72 |
| 9 | 2020 | 73 |
| 10 | 2013 | 76 |
Tropical cyclone activity totaled to eleven named storms, four hurricanes, and only major hurricane within the season; all three of these values fall below the 1971–2006 long-term average of 15 named storms, 9 hurricanes, and 4 major hurricanes. The main contributing factor to below-average activity was much above-average wind shear across the Pacific basin.[4] In May 2007, two tropical storms – Alvin and Barbara – developed, marking at the time the third such instance of more than one tropical storm developing within the month since official records began in 1949.[5] In June 2007, only one tropical depression developed in the East Pacific basin, making 2007 one of only four years in which a tropical storm did not form in the month.[6] By the following month, in terms of ACE, 2007 was considered the third quietest year-to-date since the satellite era began in 1966;[7] in September, the season fell to the second quietest year-to-date.[8] Below-average activity continued for the remainder of the year.
Systems[]
Tropical Storm Alvin[]
| Tropical storm (SSHWS) | |
  | |
| Duration | May 27 – May 31 |
|---|---|
| Peak intensity | 40 mph (65 km/h) (1-min) 1003 mbar (hPa) |
The genesis of Alvin can be attributed to a tropical wave that crossed Dakar, Africa on May 9. The wave remained poorly organized as it moved across the Atlantic Ocean and Caribbean Sea through mid-May. On May 20, the disturbance crossed Central America and emerged into the eastern Pacific Ocean, where convection—shower and thunderstorm activity—gradually began to increase over the well-defined center; this led to the formation of a tropical depression by 0000 UTC on May 27, approximately 345 mi (555 km) south of the southern tip of Baja California. Following designation, the depression was slow to organize as a result of moderate easterly shear; by 0000 UTC on May 29, however, the system had gained enough organization to be considered a tropical storm. After attaining its peak intensity with winds of 40 mph (65 km/h) and a minimum barometric pressure of 1003 mb (hPa; 29.62 inHg), increasingly stable air and higher wind shear caused Alvin to begin a weakening trend. At 0600 UTC on May 30, it weakened to a tropical depression, and by 0000 UTC on June 1, Alvin degenerated into a non-convective remnant low. The remnant low continued generally westward until dissipation six days later.[9]
Tropical Storm Barbara[]
| Tropical storm (SSHWS) | |
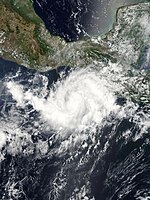  | |
| Duration | May 29 – June 2 |
|---|---|
| Peak intensity | 50 mph (85 km/h) (1-min) 1000 mbar (hPa) |
A tropical wave emerged off the western coast of Africa on May 14. After emerging into the eastern Pacific on May 25, the system acquired enough organization to be considered a tropical depression at 1800 UTC on May 29, about 115 mi (185 km) south-southeast of Puerto Escondido, Oaxaca.[10] Within an environment of weak steering currents, the storm became better organized as evidenced by an improving satellite appearance, with the formation of a curved band in the southeast quadrant.[11] At 1200 UTC on May 30, the depression was upgraded to a tropical storm; by 0000 UTC on June 1, however, increased northerly wind shear caused Barbara to weaken back to a tropical depression. After re-intensifying into a tropical storm for a second time six hours later, Barbara attained its peak intensity with winds of 50 mph (85 km/h) and a minimum barometric pressure of 1000 mb (hPa; 29.53 inHg) at 1800 UTC. Drifting northeast, the storm maintained this intensity until landfall just northwest of the Mexico-Guatemala border at 1300 UTC on June 2. Rapid weakening ensued thereafter, with the system weakening to a tropical depression at 1800 UTC. The low-level circulation dissipated six hours later, marking the dissipation of Barbara.[10]
Heavy rainfall exceeding 4 in (100 mm) caused many rivers to swell.[12] An unspecified island was separated from the Mexico mainland after the bridge connecting the two was washed away, stranding dozens of families.[13] In El Salvador, significant flooding killed four people.[14] Gusts peaked at 58 mph (85 km/h) at an automated weather station in Puerto Madero, Chiapas.[15] Across the affected regions, these winds caused damage limited to house roofs and trees.[10] Barbara caused severe crop damage totaling to 200 million pesos (2007 MXN; $55 million).[16] About a hundred residents were forced to evacuate after the storm destroyed a dozen palm huts in Guatemala.[13]
Tropical Depression Three-E[]
| Tropical depression (SSHWS) | |
  | |
| Duration | June 11 – June 12 |
|---|---|
| Peak intensity | 35 mph (55 km/h) (1-min) 1004 mbar (hPa) |
On May 24, a tropical wave emerged off the western coast of Africa. The wave entered the eastern Pacific around June 6 and shower and thunderstorm activity began to increase shortly thereafter. A broad area of low pressure formed a few hundred miles south of Acapulco, Mexico two days later.[17] Following satellite evidence of a well-defined circulation and organized convective activity,[18] the National Hurricane Center upgraded the disturbance to a tropical depression at 1200 UTC on June 11. After attaining winds of 35 mph (55 km/h) and a minimum barometric pressure of 1004 mb (hPa; 29.65 inHg), the depression began to traverse cooler waters and much more stable air. This caused all associated convection to fade away, and the depression degenerated to a non-convective remnant low at 0000 UTC on June 13. The remnant low continued northwest until dissipation by 0600 UTC on June 15.[17]
Tropical Depression Four-E[]
| Tropical depression (SSHWS) | |
  | |
| Duration | July 9 – July 11 |
|---|---|
| Peak intensity | 35 mph (55 km/h) (1-min) 1006 mbar (hPa) |
A tropical wave emerged off the western coast of Africa on June 23. It reached the eastern Pacific on July 3, where associated convection began to increase three days later. Continued slow development occurred thereafter, and following satellite trends, the disturbance was upgraded to Tropical Depression Four-E at 1800 UTC on July 9. Tracking westward, the depression began to move across waters too cool to support a tropical cyclone and into an environment of moderate shear.[19] The low-level circulation became ill-defined and exposed,[20] leading to degeneration to a remnant low at 0600 UTC on July 11 about 910 mi (1465 km) west-southwest of Cabo San Lucas, Mexico. The low continued northwest until dissipation at 0000 UTC the following day.[19]
Tropical Depression Five-E[]
| Tropical depression (SSHWS) | |
  | |
| Duration | July 14 – July 15 |
|---|---|
| Peak intensity | 35 mph (55 km/h) (1-min) 1006 mbar (hPa) |
On June 21, a tropical wave emerged off the western coast of Africa. It entered the eastern Pacific on July 10, and shower and thunderstorm activity began to increase a day later as a result. Tracking westward, the wave gradually became better organized; by 1200 UTC on July 14, the disturbance acquired enough organization to be upgraded to a tropical depression.[21] Within an environment of moderate wind shear, the low-level center quickly became poorly defined as convection dissipated.[22] Turning west-northwest on July 15, the depression entered cooler waters and an increasingly stable airmass, causing the system to degenerate into a remnant low by 0000 UTC the following day. The remnant low dissipated a few hours later.[21]
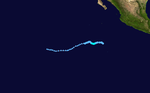
Hurricane Cosme[]
| Category 1 hurricane (SSHWS) | |
  | |
| Duration | July 14 – July 22 |
|---|---|
| Peak intensity | 75 mph (120 km/h) (1-min) 987 mbar (hPa) |
A tropical wave emerged off the western coast of Africa on June 27 and tracked westward to reach the eastern Pacific on July 8. There, the system steadily gained organization and was declared a tropical depression by 1200 UTC on July 14. Moving slowly northwest, a low wind shear and warm sea surface temperature environment allowed the system to strengthen to a tropical storm at 1800 UTC on July 15.[23] Following the development of a curved convection band and appearance of an eye on satellite,[24] Cosme was upgraded to a Category 1 hurricane at 1800 UTC the next day; it is at this time that the system attained its peak with winds of 75 mph (120 km/h) and a minimum barometric pressure of 987 mb (hPa; 29.15 inHg). Cosme tracked over ever cooler waters beginning at that time, causing the system to weaken quickly back to tropical storm strength. It turned west as a result of an intensifying ridge of high pressure to its north while continuing to deteriorate in organization. At 1800 UTC on July 18, Cosme weakened to a tropical depression after crossing into the central Pacific, and by 1800 UTC on July 22, no longer sustained enough organization to be considered a tropical cyclone. The remnant low continued generally westward until dissipation early on July 25.[23]
Cosme was initially forecast to pass over Hawaii at tropical storm strength.[25][26] Instead, a strong ridge of high pressure kept the system well south of the island. Outer rainbands produced several inches of rainfall, leading to minor flooding while simultaneously alleviating drought conditions.[27][28] Winds gusts briefly reached tropical storm strength, though no damage was reported.[29]
Tropical Storm Dalila[]
| Tropical storm (SSHWS) | |
  | |
| Duration | July 22 – July 27 |
|---|---|
| Peak intensity | 60 mph (95 km/h) (1-min) 995 mbar (hPa) |
A tropical wave emerged into the eastern Pacific on July 17. Tracking west-northwest, the system acquired enough organization to be upgraded to a tropical depression at 0000 UTC on July 22, while positioned 460 mi (740 km) south of Manzanillo, Mexico. Following formation, moderate northeasterly shear inhibited significant development, causing the system to remain a tropical depression for 48 hours. A mid-level ridge over Mexico caused the system to turn northwest as shear began to decrease; at 0000 UTC on July 24, the depression was upgraded to Tropical Storm Dalila. After attaining its peak intensity with winds of 60 mph (95 km/h) and a minimum barometric pressure of 995 mb (hPa; 29.39 inHg) a day later, the storm tracked over progressively cool waters, causing it to weaken. At 0600 UTC on July 27, Dalila weakened to a tropical storm, and by 1800 UTC, the system no longer retained enough organization to be considered a tropical cyclone. The remnant low tracked west, southwest, and eventually south prior to dissipation at 1200 UTC on July 30.[30]
Though the center of the storm remained offshore, outer rainbands led to heavy rainfall that triggered substantial flooding. In Michoacán, Dalila flooded ten municipalities with at least 15 in (380 mm) of precipitation, destroying dozens of wooden structures.[31] Heavy rains in Jalisco killed eleven, many of whom occurred in automobile crashes.[32][33] Flood waters covered numerous roads, causing many accidents, while approximately 50 homes were damaged.[34] Rough seas and heavy rain affected Baja California Sur, though no damage or fatalities were reported.[35]
Tropical Storm Erick[]
| Tropical storm (SSHWS) | |
  | |
| Duration | July 31 – August 2 |
|---|---|
| Peak intensity | 40 mph (65 km/h) (1-min) 1004 mbar (hPa) |
A tropical wave emerged off the western coast of Africa on July 16. Tracking westward, intermittent bursts of deep convection occurred as it crossed the Leeward Islands on July 22, but associated activity remained disorganized. The wave crossed Central America three days later, emerging into the eastern Pacific Ocean shortly thereafter. On July 28, a broad area of low pressure formed along the wave axis; easterly shear, however, prevented thunderstorms from developing over the center. Convective activity increased by July 31, leading to the formation of a tropical depression at 1200 UTC that day.[36] Despite the unfavorable environment, satellite intensity estimates increased to tropical storm intensity, prompting the National Hurricane Center to upgrade the depression to such.[37] After attained a peak intensity with winds of 40 mph (65 km/h) and a minimum barometric pressure of 1004 mb (hPa; 29.65 inHg) at 0600 UTC on August 1, continued wind shear caused Erick to weaken to a tropical depression. The low-level center became lost organization as it became elongated northeast to southwest on August 2, leading to degeneration into a tropical wave by 0600 UTC. The remnants of the system dissipated six hours later.[36]
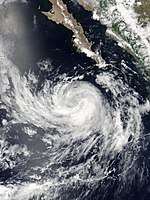
Hurricane Flossie[]
| Category 4 hurricane (SSHWS) | |
  | |
| Duration | August 8 – August 16 |
|---|---|
| Peak intensity | 140 mph (220 km/h) (1-min) 949 mbar (hPa) |
An ill-defined tropical wave entered the eastern Pacific on August 1 and steadily organized to attain tropical depression intensity eight days later. Within an environment of light shear, the depression intensified into Tropical Storm Flossie at 0000 UTC on August 9 and continued to organize to attain Category 1 hurricane intensity by 1200 UTC the following day as an eye became apparent on satellite. Continuing westward and crossing into the central Pacific basin, the system began a period of rapid intensification that brought it to its peak intensity with winds of 140 mph (220 km/h) and a minimum barometric pressure of 949 mb (hPa; 28.03 inHg) at 0000 UTC on September 12, while positioned roughly 980 mi (1575 km) east-southeast of the Big Island. Increased wind shear the next day caused Flossie to begin a slow weakening trend thereafter; at 1200 UTC on September 14, the system weakened to a Category 2 hurricane, and by 0600 UTC on September 15, the cyclone was barely a Category 1 hurricane. Six hours later, it weakened to a tropical storm as the low-level center became exposed on satellite. Flossie weakened to a tropical depression early on September 16 and dissipated by 1800 UTC.[38]
In preparation for the cyclone, the Central Pacific Hurricane Center issued a hurricane watch for the Big Island.[39] A tropical storm warning was subsequently issued for the same location,[40] The Federal Emergency Management Agency (FEMA) sent 20 transportation, public works, and health experts to the region.[41] Many schools were closed, including the University of Hawaii at Hilo and Hawaii Community College; as a result, an estimated 26,000 college students were sent home.[42] As a weakening cyclone, Flossie produced light precipitation on the island of Hawaii. Large waves impacted south-facing beaches while the maximum sustained wind observed reached 39 mph (63 km/h) at South Point.[43] No fatalities were reported.
Tropical Storm Gil[]
| Tropical storm (SSHWS) | |
  | |
| Duration | August 29 – September 2 |
|---|---|
| Peak intensity | 45 mph (75 km/h) (1-min) 1001 mbar (hPa) |
A vigorous tropical wave emerged off the western coast of Africa on August 16. Characterized with abundant deep convection, the wave remained organization until it interacted with an upper-level trough across the eastern Caribbean Sea a few days later. On August 26, the wave split in two, with the northern portion leading the formation of a weak low in the Bay of Campeche and the southern portion continuing westward into the eastern Pacific. After the formation of deep convection over the center and associated convective bands, the disturbance was upgraded to a tropical depression at 1200 UTC on August 29.[44] Though the circulation remained positioned on the northeast side of most thunderstorm activity, satellite intensity estimates supported tropical storm strength and it was upgraded to such accordingly.[45] At 1200 UTC on August 30, Gil attained its peak intensity with winds of 45 mph (75 km/h) and a minimum barometric pressure of 1001 mb (hPa; 29.56 inHg). Shortly thereafter, increasing wind shear and decreasing sea surface temperatures caused the system to steadily weaken; at 0000 UTC on September 1, the system deteriorated into a tropical depression, and by 1800 UTC the following afternoon, the system no longer displayed enough organization to be considered a cyclone. The remnant low continued westward and dissipated twelve hours later.[44]
Heavy rainfall was reported throughout the state of Sinaloa. A total of 26 neighborhoods were flooded with up to 4.9 ft (1.5 m) of water in the town of Culiacán, while a 14-year-old boy was swept away by a swollen river.[46]
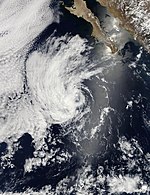
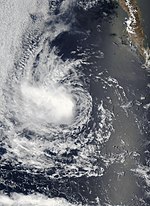
Hurricane Henriette[]
| Category 1 hurricane (SSHWS) | |
  | |
| Duration | August 30 – September 6 |
|---|---|
| Peak intensity | 85 mph (140 km/h) (1-min) 972 mbar (hPa) |
A poorly organized tropical wave moved into the eastern Pacific on August 29 and quickly developed into a tropical depression by 0600 UTC the following day. Within an environment of low wind shear, the depression intensified into a tropical storm, acquiring the name Henriette, at 1200 UTC on August 31. Moving west-northwest around a ridge positioned over inland Mexico, the center passed narrowly offshore after producing squally weather along the coastline. The system moved westward while continuing to intensify, becoming a Category 1 hurricane at 0600 UTC on September 4 and subsequently attaining its peak intensity with winds of 85 mph (140 km/h) and a minimum barometric pressure of 972 mb (hPa; 28.71 inHg) six hours later. An approaching upper-level trough caused Henriette to turn northwest later that day, moving it ashore near San José del Cabo, Mexico at 2100 UTC as a minimal hurricane. After crossing Baja California Sur, Henriette weakened to a tropical storm and made a second landfall near Guaymas, Mexico. The system moved inland and quickly weakened, dissipating by 1200 UTC on September 6.[47]
The hardest hit city by Henriette was Acapulco, where heavy rains led to rockslides and mudslides that killed six.[48] In Sonora, the hurricane damaged thousands of structures and killed four, two of whom off the coast.[49][50] Farther northwest, a woman died while attempting to surf waves off the coast of Baja California Sur.[51] Heavy rains stranded many cars while causing rivers to overflow, flooding communities.[52] Damage totaled to $275 million (2007 MXN; $25 million).[47]
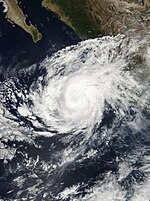
Hurricane Ivo[]
| Category 1 hurricane (SSHWS) | |
  | |
| Duration | September 18 – September 23 |
|---|---|
| Peak intensity | 80 mph (130 km/h) (1-min) 984 mbar (hPa) |
A tropical wave moved off the western coast of Africa on September 1 and continued westward until reaching the eastern Pacific fifteen days later. A broad area of low pressure formed along the wave axis on September 16 as convective activity organized, and by 0600 UTC on September 18, the system acquired enough organization to be declared a tropical depression.[53] Convective bands began to form near the center a few hours later,[54] leading to an improved satellite presentation overall. Tracking west-northwestward as a result of the mid-level ridge,[55] the system intensified into Tropical Storm Ivo at 0000 UTC on September 19. Turning northwest, a well-defined eye became visible on satellite, prompting the NHC to upgrade the system to a Category 1 hurricane 24 hours later. With an area of deep convection near the center,[56] the hurricane attained its peak intensity with winds of 80 mph (130 km/h) and a minimum barometric pressure of 984 mb (hPa; 29.06 inHg) at 0000 UTC on September 21. Westerly flow associated with a large upper-level low began to undercut the outflow of Ivo, and it weakened to a tropical storm by the afternoon hours.[53] The convective pattern rapidly deteriorated due to southeasterly wind shear,[57] and despite a brief burst of convection,[58] the storm was downgraded to a tropical depression to the west-southwest of the southern tip of Baja California at 0000 UTC on September 23. Associated deep convection dissipated later that day as Ivo turned eastward, and the system degenerated into a remnant low accordingly. The remnant low dissipated two days later as it continued in the same direction.[53]
Initially, some forecasts predicted the storm would strike the Baja California Peninsula as a tropical storm;[59] a tropical storm watch was briefly issued from Santa Fe to Cabo San Lucas accordingly.[53] Over 100 shelters were opened in the municipalities of Los Cabos, La Paz and Comondú, respectively.[60] In all, Ivo contributed to heavy rainfall across Baja California Sur; however, damage was not reported.[53]
Tropical Depression Thirteen-E[]
| Tropical depression (SSHWS) | |
  | |
| Duration | September 19 – September 20 |
|---|---|
| Peak intensity | 35 mph (55 km/h) (1-min) 1007 mbar (hPa) |
A tropical wave emerged off the western coast of Africa on August 27 and reached the eastern Pacific on September 7. Tracking westward, little development occurred until September 18, when associated shower and thunderstorm activity began to increase. Following visible satellite trends, the National Hurricane Center deemed the disturbance organized enough to be declared a tropical depression at 0600 UTC on September 19, while located about 1,200 mi (1930 km) west-southwest of the southern tip of Baja California. In an environment of cool ocean temperatures and stable air, the depression failed to organize as it turned west-northwest.[61] Associated deep convection dissipated,[62] leading to degeneration into a remnant low by 0000 UTC on September 20. Performing a slow counter-clockwise loop, the remnant low dissipated five days later.[61]
Tropical Storm Juliette[]
| Tropical storm (SSHWS) | |
  | |
| Duration | September 29 – October 2 |
|---|---|
| Peak intensity | 60 mph (95 km/h) (1-min) 997 mbar (hPa) |
The formation of Tropical Storm Juliette can be traced back to a tropical wave that emerged off the western coast of Africa on September 12. After interacting with a secondary wave over the central Atlantic a few days later, it entered the eastern Caribbean, becoming steadily better defined. Convective activity was enhanced as the wave passed into the West Caribbean on September 22 and it moved inland over Central American shortly thereafter. A broad area of low pressure formed along the wave axis on September 27 and convection steadily increased; around 0000 UTC on September 29, the system acquired enough organization to be declared a tropical depression. Twelve hours later, the system intensified into Tropical Storm Juliette. Turning northwest as a result of an upper-level trough, the system attained its peak with winds of 60 mph (95 km/h) and a minimum barometric pressure of 997 mb (hPa; 29.44 inHg) at 1200 UTC on September 30. Strong wind shear began to affect the storm thereafter, causing it to steadily weaken to tropical depression strength by 0000 UTC on October 2. Twelve hours later, the system degenerated into a remnant low. The low meandered several hundred miles off the coast of Baja California before degenerating into a trough on October 5.[63]
Tropical Storm Kiko[]
| Tropical storm (SSHWS) | |
  | |
| Duration | October 15 – October 23 |
|---|---|
| Peak intensity | 70 mph (110 km/h) (1-min) 991 mbar (hPa) |
A tropical wave exited the coast of Africa and moved westward across the Atlantic before entering the eastern Pacific on October 8. Despite strong easterly wind shear, the system acquired enough organization to be deemed a tropical depression at 0000 UTC on October 15. Within a broad cyclonic gyre, the system moved erratically, first drifting south then east-northeast and eventually northwest. Early on October 16, the system briefly intensified into a tropical storm as a convective band wrapped around the circulation, but continued strong shear caused associated convection to dissipate and the system weakened to a tropical depression by 1800 UTC. After intensifying back to a tropical storm the following day, a brief reprieve in harsh upper-level winds allowed Kiko to reach its peak intensity with winds of 70 mph (110 km/h) and a minimum barometric pressure of 991 mb (hPa; 29.27 inHg). An increase in southerly shear and entrance into a more stable airmass caused the system to weaken to a tropical depression at 0000 UTC on October 23; the system degenerated into a remnant low 24 hours later. The remnant low tracked west before turning north and eventually dissipated early on October 27.[64]
Beginning early on October 18, Kiko was forecast to strike Mexico at tropical storm intensity and cyclone advisories were issued accordingly.[65] However, a building mid-level ridge of high pressure over inland Mexico was then forecast to cause the center of circulation to pass just offshore.[66] Though no damage was reported in association with the cyclone, rough seas created by Kiko capsized a ship with thirty people on board; two were found still alive, fifteen bodies were recovered, and nine were reported missing.[67]
Storm names[]
The following names were used for tropical storms that formed in the northeast Pacific Ocean in 2007. There were no names retired during this year; thus, the same list was used again in the 2013 season. This is the same list used in 2001 with the exception of Alvin, which replaced Adolph. For this reason, the name Alvin was used for the first time this year.
|
|
Season effects[]
The following table lists all of the storms that have formed in the 2007 Pacific hurricane season. It includes their duration, names, landfall(s) (in parentheses), damages, and death totals. Deaths in parentheses are additional and indirect (an example of an indirect death would be a traffic accident), but were still related to that storm. Damage and deaths include totals while the storm was extratropical, a wave, or a low, and all of the damage figures are in 2007 USD.
| Saffir–Simpson scale | ||||||
| TD | TS | C1 | C2 | C3 | C4 | C5 |
| Storm name |
Dates active | Storm category
at peak intensity |
Max 1-min wind mph (km/h) |
Min. press. (mbar) |
Areas affected | Damage (USD) |
Deaths | Ref(s)
| ||
|---|---|---|---|---|---|---|---|---|---|---|
| Alvin | May 27–31 | Tropical storm | 40 (65) | 1003 | None | None | None | |||
| Barbara | May 29 – June 2 | Tropical storm | 50 (85) | 1000 | Southwestern Mexico | $55 million | 4 | |||
| Three-E | June 11–12 | Tropical depression | 35 (55) | 1004 | None | None | None | |||
| Four-E | July 9–11 | Tropical depression | 35 (55) | 1006 | None | None | None | |||
| Five-E | July 14–15 | Tropical depression | 35 (55) | 1006 | None | None | None | |||
| Cosme | July 14–22 | Category 1 hurricane | 75 (120) | 987 | Hawaii | Minimal | None | |||
| Dalila | July 22–27 | Tropical storm | 60 (95) | 995 | Baja California Peninsula, Western Mexico (Jalisco) | Minimal | 11 | |||
| Erick | July 31 – August 2 | Tropical storm | 40 (65) | 1004 | None | None | None | |||
| Flossie | August 8–16 | Category 4 hurricane | 140 (220) | 949 | Hawaii | Minimal | None | |||
| Gil | August 29 – September 2 | Tropical storm | 45 (75) | 1001 | Western Mexico | Minimal | 1 | |||
| Henriette | August 30 – September 6 | Category 1 hurricane | 85 (140) | 972 | Southwestern Mexico, Western Mexico, Baja California Peninsula, Northwestern Mexico (Sonora) | $25 million | 11 | |||
| Ivo | September 18–23 | Category 1 hurricane | 80 (130) | 984 | Baja California Peninsula | None | None | |||
| Thirteen-E | September 19–20 | Tropical depression | 35 (55) | 1007 | None | None | None | |||
| Juliette | September 29 – October 2 | Tropical storm | 60 (95) | 997 | None | None | None | |||
| Kiko | October 15–23 | Tropical storm | 70 (110) | 991 | Western Mexico | None | 15 | |||
| Season aggregates | ||||||||||
| 15 systems | May 27 – October 23 | 140 (220) | 949 | $80 million | 42 | |||||
See also[]
- Tropical cyclones in 2007
- Pacific hurricane season
- 2007 Atlantic hurricane season
- 2007 Pacific typhoon season
- 2007 North Indian Ocean cyclone season
- Australian region cyclone seasons: 2006–07, 2007–08
- South Pacific cyclone seasons: 2006–07, 2007–08
- South-West Indian Ocean cyclone seasons: 2006–07, 2007–08
Notes[]
References[]
- ^ a b Carmeyia Gillis (May 22, 2007). "NOAA Predicts Below Normal 2007 East Pacific Hurricane Season". Climate Prediction Center. National Oceanic and Atmospheric Administration. Archived from the original on 2013-11-06. Retrieved November 2, 2013.
- ^ a b Delores Clark (May 21, 2007). "NOAA Announces Central Pacific Hurricane Season Outlook". Central Pacific Hurricane Center. National Oceanic and Atmospheric Administration. Archived from the original on 2014-06-21. Retrieved November 2, 2013.
- ^ Hurricane Specialist Unit (November 30, 2007). "Monthly Tropical Weather Summary: November". National Hurricane Center. National Oceanic and Atmospheric Administration. Retrieved November 2, 2013.
- ^ Lixion A. Avila; Jamie R. Rhome (February 10, 2009). "Eastern North Pacific Hurricane Season of 2007". National Hurricane Center. American Meteorological Society. 137 (8): 2436. Bibcode:2009MWRv..137.2436A. doi:10.1175/2009MWR2915.1.
- ^ Hurricane Specialist Unit (June 1, 2007). "Monthly Tropical Weather Summary: May". National Hurricane Center. National Oceanic and Atmospheric Administration. Retrieved November 2, 2013.
- ^ Hurricane Specialist Unit (July 1, 2007). "Monthly Tropical Weather Summary: June". National Hurricane Center. National Oceanic and Atmospheric Administration. Retrieved November 2, 2013.
- ^ Hurricane Specialist Unit (August 1, 2007). "Monthly Tropical Weather Summary: June". National Hurricane Center. National Oceanic and Atmospheric Administration. Retrieved November 2, 2013.
- ^ Hurricane Specialist Unit (October 1, 2007). "Monthly Tropical Weather Summary: June". National Hurricane Center. National Oceanic and Atmospheric Administration. Retrieved November 2, 2013.
- ^ Lixion A. Avila (October 2, 2007). Tropical Cyclone Report: Tropical Storm Alvin (PDF). National Hurricane Center (Report). National Oceanic and Atmospheric Administration. Retrieved October 28, 2013.
- ^ a b c Richard D. Knabb (August 21, 2007). Tropical Cyclone Report: Tropical Storm Barbara (PDF). National Hurricane Center (Report). National Oceanic and Atmospheric Administration. Retrieved October 28, 2013.
- ^ James L. Franklin (May 30, 2007). Tropical Storm Barbara Discussion Number 4. National Hurricane Center (Report). National Oceanic and Atmospheric Administration. Retrieved October 28, 2013.
- ^ Alberto Unzón; Cirilo Lujano (2007). "Reseña de la Tormenta Tropical "Barbara" del Océano Pacífico" (PDF). Servicio Meteorológico Nacional. Servicio Meteorológico Nacional. Archived from the original (PDF) on June 25, 2007. Retrieved October 30, 2013.
- ^ a b Mica Rosenberg (June 2, 2007). "Tropical storm lashes Guatemala, Mexico coasts". Reuters. Archived from the original on June 6, 2007. Retrieved October 30, 2013.
- ^ "Heavy rain leaves 12 dead in Caribbean, Central America". Saudi Press Agency. Saudi Press Agency. June 1, 2007. Retrieved October 30, 2013.
- ^ Daniel P. Brown; Lixion A. Avila (June 2, 2007). Tropical Storm Barbara Discussion Number 16. National Hurricane Center (Report). National Oceanic and Atmospheric Administration. Retrieved October 30, 2013.
- ^ "Destruye tormenta tropical más de 9 mil hectáreas de plátano". Teorema Ambiental (in Spanish). Teorema Ambiental. June 26, 2007. Archived from the original on 2007-09-30. Retrieved October 30, 2013.
- ^ a b James L. Franklin (July 12, 2007). Tropical Cyclone Report: Tropical Depression Three-E (PDF). National Hurricane Center (Report). National Oceanic and Atmospheric Administration. Retrieved October 28, 2013.
- ^ Michelle Mainelli (June 11, 2007). Tropical Depression Three-E Discussion Number 1. National Hurricane Center (Report). National Oceanic and Atmospheric Administration. Retrieved October 28, 2013.
- ^ a b Jack L. Beven II (August 28, 2007). Tropical Cyclone Report: Tropical Depression Four-E (PDF). National Hurricane Center (Report). National Oceanic and Atmospheric Administration. Retrieved October 29, 2013.
- ^ Michelle Mainelli (July 10, 2007). Tropical Depression Four-E Discussion Number 5. National Hurricane Center (Report). National Oceanic and Atmospheric Administration. Retrieved October 29, 2013.
- ^ a b Jamie R. Rhome (July 17, 2007). Tropical Cyclone Report: Tropical Depression Five-E (PDF). National Hurricane Center (Report). National Oceanic and Atmospheric Administration. Retrieved October 29, 2013.
- ^ David P. Roberts; Jack L. Beven II (July 15, 2007). Tropical Depression Five-E Discussion Number 7. National Hurricane Center (Report). National Oceanic and Atmospheric Administration. Retrieved October 29, 2013.
- ^ a b Michelle Mainelli (December 17, 2007). Tropical Cyclone Report: Hurricane Cosme (PDF). National Hurricane Center (Report). National Oceanic and Atmospheric Administration. Retrieved October 30, 2013.
- ^ Michelle Mainelli (July 16, 2007). Hurricane Cosme Discussion Number 10. National Hurricane Center (Report). National Oceanic and Atmospheric Administration. Retrieved October 30, 2013.
- ^ James L. Franklin (July 17, 2007). Tropical Storm Cosme Discussion Number 12. National Hurricane Center (Report). National Oceanic and Atmospheric Administration. Retrieved October 30, 2013.
- ^ Michelle Mainelli (July 17, 2007). Tropical Storm Cosme Discussion Number 13. National Hurricane Center (Report). National Oceanic and Atmospheric Administration. Retrieved October 30, 2013.
- ^ Mari-Ela David. "Cosme Dumps Rain". Hawaii News Now. Archived from the original on March 4, 2016. Retrieved October 30, 2013.
- ^ "Storm Events Database". National Climatic Data Center. National Climatic Data Center. Retrieved October 30, 2013.
- ^ "Tropical depression causes few problems in Hawaii". USA Today. Associated Press. July 22, 2007. Retrieved October 30, 2013.
- ^ Daniel P. Brown (August 29, 2007). Tropical Cyclone Report: Tropical Storm Dalila (PDF). National Hurricane Center (Report). National Oceanic and Atmospheric Administration. Retrieved October 29, 2013.
- ^ "'Dalila' deja 200 damnificados e inundaciones en Michoacán". Noticieros Televisa (in Spanish). July 24, 2007. Archived from the original on September 25, 2012. Retrieved October 29, 2013.
- ^ Ulises Gutierrez; Gerardo Flores (July 25, 2007). "Se descarrila por lluvias tren en Sonora; 4 muertos". La Jornada (in Spanish). Retrieved October 29, 2013.
- ^ "Tormenta Tropical Dalila". Semarnat (in Spanish). Semarnat. July 24, 2007. Archived from the original on 2007-12-31. Retrieved October 29, 2013.
- ^ Juan Partida; Rene Ramon; Rene Lopez (July 24, 2007). "Provocan aguaceros seis muertes en Guadalajara". La Jornada (in Spanish). Retrieved October 29, 2013.
- ^ "Weakened Tropical Storm Dalila dumps rain, kicks up surf along Mexico's coast". WHDH TV. Associated Press. July 26, 2007. Archived from the original on 2012-12-14. Retrieved October 29, 2013.
- ^ a b Eric S. Blake (August 23, 2007). Tropical Cyclone Report: Tropical Storm Erick (PDF). National Hurricane Center (Report). National Oceanic and Atmospheric Administration. Retrieved October 29, 2013.
- ^ Lixion A. Avila (July 31, 2007). Tropical Storm Erick Discussion Number 2. National Hurricane Center (Report). National Oceanic and Atmospheric Administration. Retrieved October 29, 2013.
- ^ Richard J. Pasch; David P. Roberts (January 10, 2008). Tropical Cyclone Report: Hurricane Flossie (PDF). National Hurricane Center (Report). National Oceanic and Atmospheric Administration. Retrieved October 30, 2013.
- ^ Sam Houston (August 13, 2007). "Hurricane Flossie Discussion Number 20". Central Pacific Hurricane Center. National Oceanic and Atmospheric Administration. Retrieved November 11, 2013.
- ^ Jeff Powell (August 13, 2007). "Hurricane Flossie Discussion Number 21". Central Pacific Hurricane Center. National Oceanic and Atmospheric Administration. Retrieved November 11, 2013.
- ^ "Flossie downgraded again after swiping Hawaii". NBC News. Associated Press. August 15, 2007. Retrieved November 11, 2013.
- ^ "Storm shelter, closure information". KITV News. KITV News. July 29, 2007. Archived from the original on November 12, 2013. Retrieved November 11, 2013.
- ^ Tim Craig; Sam Houston; Wes Browning. 2007 Tropical Cyclones Central North Pacific (PDF). Central Pacific Hurricane Center (Report). National Oceanic and Atmospheric Administration. Retrieved June 9, 2019.
- ^ a b Lixion A. Avila (October 10, 2007). Tropical Cyclone Report: Tropical Storm Gil (PDF). National Hurricane Center (Report). National Oceanic and Atmospheric Administration. Retrieved October 29, 2013.
- ^ Eric S. Blake (August 29, 2007). Tropical Storm Gil Discussion Number 2. National Hurricane Center (Report). National Oceanic and Atmospheric Administration. Retrieved October 29, 2013.
- ^ Javier Martínez (August 30, 2007). "Deja tormenta tropical Gil primera víctima en Culiacán". El Universal (in Spanish). Archived from the original on April 20, 2011. Retrieved November 11, 2013.
- ^ a b Richard D. Knabb (November 23, 2007). Tropical Cyclone Report: Hurricane Henriette (PDF). National Hurricane Center (Report). National Oceanic and Atmospheric Administration. Retrieved October 30, 2013.
- ^ "Landslide kills six as storm passes Mexico". ABC News Australia. Agence France-Presse. September 2, 2007. Retrieved October 30, 2013.
- ^ Carmen Duarte (September 7, 2007). "Sonora cleanup begins". Arizona Daily Star. Retrieved October 30, 2013.
- ^ Frank Daniel (September 6, 2007). "Hurricane Henriette Pounds Mexico, 2 Reported Dead". Environmental News Network. Reuters. Retrieved October 30, 2013.
- ^ "Henriette threatens Mexican mainland". NBC News. Associated Press. September 5, 2007. Retrieved October 30, 2013.
- ^ "Azota "Henriette" al territorio nacional". Notimex (in Spanish). Sipse. September 3, 2007. Archived from the original on 2013-11-04. Retrieved October 30, 2013.
- ^ a b c d e James L. Franklin (December 3, 2007). Tropical Cyclone Report: Hurricane Ivo (PDF). National Hurricane Center (Report). National Oceanic and Atmospheric Administration. Retrieved October 30, 2013.
- ^ Jack L. Beven II (September 18, 2007). "Tropical Depression Twelve-E Discussion Number 2". National Hurricane Center. National Oceanic and Atmospheric Administration. Retrieved November 11, 2013.
- ^ Lixion A. Avila (September 18, 2007). "Tropical Storm Ivo Discussion Number 1". National Hurricane Center. National Oceanic and Atmospheric Administration. Retrieved November 11, 2013.
- ^ Lixion A. Avila (September 19, 2007). "Hurricane Ivo Discussion Number 7". National Hurricane Center. National Oceanic and Atmospheric Administration. Retrieved November 11, 2013.
- ^ Robbie J. Berg; Eric S. Blake (September 21, 2007). "Tropical Storm Ivo Discussion Number 15". National Hurricane Center. National Oceanic and Atmospheric Administration. Retrieved November 11, 2013.
- ^ Jack L. Beven II (September 22, 2007). "Tropical Storm Ivo Discussion Number 16". National Hurricane Center. National Oceanic and Atmospheric Administration. Retrieved November 11, 2013.
- ^ Michelle Mainelli (September 21, 2007). "Hurricane Ivo Discussion Number 13". National Hurricane Center. National Oceanic and Atmospheric Administration. Retrieved November 11, 2013.
- ^ Gladys Rodríguez (September 23, 2007). "Caen en BCS las primeras lluviaspor 'Ivo'". El Universal (in Spanish). Retrieved November 11, 2013.
- ^ a b Jack L. Beven II; Christopher W. Landsea (October 17, 2007). Tropical Cyclone Report: Tropical Depression Thirteen-E (PDF). National Hurricane Center (Report). National Oceanic and Atmospheric Administration. Retrieved October 29, 2013.
- ^ Christopher W. Landsea; James L. Franklin (September 20, 2007). Tropical Depression Thirteen-E Discussion Number 6. National Hurricane Center (Report). National Oceanic and Atmospheric Administration. Retrieved October 29, 2013.
- ^ Robbie J. Berg; Jamie R. Rhome (November 8, 2007). Tropical Cyclone Report: Tropical Storm Juliette (PDF). National Hurricane Center (Report). National Oceanic and Atmospheric Administration. Retrieved October 29, 2013.
- ^ Michelle Mainelli (November 18, 2007). Tropical Cyclone Report: Tropical Storm Kiko (PDF). National Hurricane Center (Report). National Oceanic and Atmospheric Administration. Retrieved October 30, 2013.
- ^ Jack L. Beven II (October 18, 2007). Tropical Storm Kiko Advisory Number 15. National Hurricane Center (Report). National Oceanic and Atmospheric Administration. Retrieved October 30, 2013.
- ^ Eric S. Blake; Lixion A. Avila (October 18, 2007). Tropical Storm Kiko Discussion Number 17. National Hurricane Center (Report). National Oceanic and Atmospheric Administration. Retrieved October 30, 2013.
- ^ "Fifteen people drown as boat capsizes near Mexico". Taipei Times. Agence France-Presse. October 22, 2007. Retrieved October 30, 2013.
External links[]
| Wikimedia Commons has media related to 2007 Pacific hurricane season. |

- 2007 Pacific hurricane season
- Pacific hurricane seasons
- Tropical cyclones in 2007