2002–03 Australian region cyclone season
| 2002–03 Australian region cyclone season | |
|---|---|
 Season summary map | |
| Seasonal boundaries | |
| First system formed | 27 December 2002 |
| Last system dissipated | 6 June 2003 |
| Strongest storm | |
| Name | Inigo (Most intense tropical cyclone in the Australian region on record, tied with Gwenda) |
| • Maximum winds | 240 km/h (150 mph) (10-minute sustained) |
| • Lowest pressure | 900 hPa (mbar) |
| Seasonal statistics | |
| Tropical lows | 11 |
| Tropical cyclones | 8 |
| Severe tropical cyclones | 3 |
| Total fatalities | 60 |
| Total damage | $12 million (2003 USD) |
| Related articles | |
The 2002–03 Australian region cyclone season included Cyclone Inigo, which tied with Cyclone Gwenda in 1999 as the most intense tropical cyclone on record in the Australian basin. It began on 1 November 2002 and ended on 30 April 2003. The regional tropical cyclone operational plan also defines a tropical cyclone year separately from a tropical cyclone season, which runs from 1 July 2002 to 30 June 2003. These dates conventionally delimit the period of each year when most tropical cyclones form in the Australian region, which is defined as in the southern hemisphere between 90°E and 180°E. The season's ten tropical depressions existed within these dates, with the first, designated as Tropical Cyclone 07S, entering the basin on 27 December 2002. The last system, Cyclone Epi, dissipated on 6 June 2003. Tropical cyclones in this area were monitored by four Tropical Cyclone Warning Centres (TCWCs): the Australian Bureau of Meteorology (BOM) in Perth, Darwin, and Brisbane and one in Port Moresby, Papua New Guinea.[1]
Tropical cyclogenesis in the season began when a tropical low developed in the Arafura Sea on 5 January and last until 24 January, after meandering over northern and Western Australia. On 1 February, weakening Cyclone Beni entered the Australian region and brought severe flooding to Queensland, before dissipating on 5 February. Severe Tropical Cyclone Fiona formed north of Western Australia on 3 February and later peaked as a Category 4 severe tropical cyclone on the Australian tropical cyclone intensity scale. Cyclone Graham developed offshore Western Australia on 24 February and made landfall in a rural area of that state on 28 February, producing flooding in the area. Tropical Cyclone Harriet existed offshore of Western Australia from 1 to 11 March.
On 1 March, Cyclone Erica formed offshore Queensland and strengthened as it moved in a parabolic path, before leaving the Australian region on 12 March. Erica caused only minor damage in Queensland. Cyclone Craig originated offshore Northern Territory on 8 March. The system subsequently struck the territory and eventually made another landfall in Queensland on 12 March, after crossing the Gulf of Carpentaria. Impact from Craig was generally minor. Cyclone Inigo formed on 30 March and caused severe impact in Indonesia, especially in Flores, Sumba, and West Timor. Inigo later deepened into the most intense tropical cyclone on record in the Australian region, tied with Cyclone Gwenda in 1999. Inigo weakened significantly before striking Western Australia on 8 April and dissipating shortly thereafter. The final system, Tropical Cyclone Epi developed east of Papua New Guinea on 5 June and dissipated on the following day. Overall, the tropical cyclones of this season caused 60 deaths and about $12 million (2003 USD)[nb 1] in damage.
Seasonal summary[]


The season began on 1 November 2002 and ended on 30 April 2003, while the regional tropical cyclone operational plan also defines a tropical cyclone year from 1 July 2002 to 30 June 2003.[2] Eight cyclones entered or formed in the Australian region, which was below the 1970–71 to 2001–02 average of 13 per season. There was a major shift in tropical cyclone activity from the Australian region to the South Pacific, because of a moderate El Niño event. Only two cyclones occurred between 125°E and 150°E, which is east of Australia, and six formed between 150°E and 160°E. All of the tropical cyclone developed during Madden–Julian oscillation (MJO) pulses or Equatorial Rossby (ER) pulses.[3] Overall, the tropical cyclones of this season resulted in 60 deaths and slightly less than $12 million in damage.[4][5][6][7]
Activity began in December 2002, when Tropical Cyclone 07S entered the Australian region from the southwestern Indian Ocean basin on 27 December.[8] In January, an unnamed tropical cyclone existed for more than three weeks over the Arafura Sea, Northern Territory, and Western Australia.[9] The basin became more active in February, with South Pacific Cyclone Beni entering the area on 1 February. This was followed by the development of Fiona on 3 February and Graham on 24 February; both formed north of Western Australia.[10][11] Two tropical cyclones – Harriet and Erica – both originated on 1 March; the former developed northwest of Western Australia and the latter formed east of Queensland.[12] About a week later, 8 March, Cyclone Craig developed near the coast of Northern Territory.[13] The strongest tropical system of the season, Cyclone Inigo, originated over the Lesser Sunda Islands of Indonesia on 30 March. At peak intensity, Inigo had a minimum barometric pressure of 900 mbar (27 inHg), making the most intense tropical cyclone in the Australian region on record, tied with Cyclone Gwenda in 1999.[6] Activity remained dormant until the development of Cyclone Epi on 5 June, which dissipated on the following day.[14]
Systems[]
Tropical Depression 07S[]
| Tropical depression (SSHWS) | |
  | |
| Duration | 27 December – 3 January |
|---|---|
| Peak intensity | 55 km/h (35 mph) (1-min) 1006 hPa (mbar) |
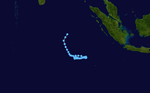
Tropical Cyclone 07S developed in the southwestern Indian Ocean on 25 December, while located about 1345 km (835 mi) west-northwest of Cocos Islands. It initially drifted southwest and then turned eastward on 27 December. Around this time, 07S entered Perth's Area Of Responsibility (AOR).[8] The Joint Typhoon Warning Center (JTWC) estimated that 07S peaked with 1-minute maximum sustained winds of 55 km/h (35 mph) and a minimum barometric pressure of 1,006 mbar (29.7 inHg).[15][nb 2] The storm drifted erratically and by 1800 UTC on 28 December, the JTWC issued its final warning on 07S, while situated about 465 km (290 mi) west-northwest of Cocos Islands. However, TCWC Perth continued Tropical Weather Outlooks (TWOs) on the system until 3 January.[8]
Tropical Cyclone 01U[]
| Category 2 tropical cyclone (Australian scale) | |
  | |
| Duration | 4 January – 25 January |
|---|---|
| Peak intensity | 95 km/h (60 mph) (10-min) 988 hPa (mbar) |
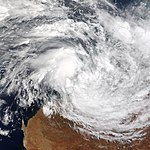
A tropical low developed over the Arafura Sea on 4 January and strengthened into a tropical cyclone before passing near Elcho Island, Northern Territory. The storm then made landfall in Arnhem Land on 5 January. At 0900 UTC, the system peaked with winds of 95 km/h (60 mph). It meandered over Northern Territory and the Gulf of Carpentaria for a few weeks. The system remained inland until moving offshore Kimberley on 21 January. A deep trough generated wind shear, which inhibited significant intensification. However, deep convection began to develop late on 24 January as it approached the north coast of Western Australia. Around 0300 UTC on 25 January, the storm made landfall near Port Hedland with winds of 65 km/h (40 mph). The system quickly weakened and dissipated by 1200 UTC.[9]
Gale-force winds caused damage vegetation, trees, vehicles, and buildings in Elcho Island, Gapuwiyak, Maningrida, and Ramingining.[9][16] Wind-driven waves at the mouth of the Rose River inundated workshops near Numbulwar. Torrential rains fell in the Roper–McArthur River district, peaking at 880 mm (35 in) at Wollogorang. A temporary evacuation occurred along the Waterhouse River at Beswick. Other rivers that overflowed inundated portions of highways such as the Carpentaria Highway and Tablelands Highway.[9] After regenerating into a tropical cyclone, the storm brought up to 146.6 mm (5.77 in) of rainfall in a 24-hour period in the Port Hedland area. This caused the Yule River to overflow its banks, which flooded the North-West Highway. Operationally, the storm was thought to have been two separate systems and to have remained below tropical cyclone intensity.[9]
Tropical Cyclone Beni[]
| Category 1 tropical cyclone (Australian scale) | |
| Tropical depression (SSHWS) | |
  | |
| Duration | 1 February (Entered basin) – 5 February |
|---|---|
| Peak intensity | 65 km/h (40 mph) (10-min) 995 hPa (mbar) |
Beni originated from the South Pacific region in late January and its remnants crossed into the Australian region by 1 February. Upon reaching the Coral Sea, the remnants of Beni slowly began to redevelop. After strong convective bands formed, Brisbane TCWC initiated gale warnings. Located offshore Queensland on 4 February, the remnants of Beni regenerated into a tropical cyclone. However, strong vertical wind shear caused Beni to dissipated on 5 February, while situated offshore of Queensland near the city of Mackay.[10]
Heavy rainfall accompanied Beni and its remnants, reaching 500 mm (20 in) near Gladstone.[16] One person drowned due to the flooding rains.[17] Runoff on the Fitzroy River caused by Cyclone Beni resulted in a moderate flood with an estimated return period of four years at Rockhampton.[18] The cyclone's heavy rains helped ease drought problems in Queensland. Nine shires in Central Queensland were declared disaster areas.[4] Additionally, strong winds left power outages in Agnes Water and 1770.[19] Overall, Beni resulted in damages of at least A$10 million (US$6 million) in Queensland.[4]
Tropical Low Isha[]
| Tropical low (Australian scale) | |
| Tropical depression (SSHWS) | |
  | |
| Duration | 3 February – 9 February (exited basin) |
|---|---|
| Peak intensity | 55 km/h (35 mph) (10-min) 1000 hPa (mbar) |
Severe Tropical Cyclone Fiona[]
| Category 4 severe tropical cyclone (Australian scale) | |
| Category 3 tropical cyclone (SSHWS) | |
  | |
| Duration | 3 February – 13 February |
|---|---|
| Peak intensity | 175 km/h (110 mph) (10-min) 935 hPa (mbar) |
An area of convection began developing into a tropical low on 3 February, while located about 970 km (600 mi) north of Karratha, Western Australia.[20] Poorly-defined convection was noted as well as good outflow and a weak circulation.[10] The system drifted westward with minimal development until late on 4 February, when satellite imagery showed increasing convection near the center.[20] Subsequently, the JTWC issued a TCFA for the system. With the developing low located in an environment of weak to moderate wind shear, TCWC Perth issued a warning. At 0700 UTC on 5 February, Perth named the system Fiona.[10] The JTWC issued their first advisory on Fiona about five hours later.[21] Fiona strengthened steadily and reached tropical cyclone intensity at 0600 UTC on 6 February.[20] Continuing to intensify, TCWC Perth upgraded the storm to severe tropical cyclone status early on 7 February.[10]
Early on 8 February, an eye became embedded within partial concentric convective bands. Later that day, TCWC Perth reported a peak intensity of 175 km/h (110 mph) at 1000 UTC.[10] Shortly thereafter, the storm began weakening as dry air increased. By 1000 UTC on 9 February, TCWC Perth reduced the intensity of Fiona to 170 km/h (105 mph). Deep convection weakened somewhat and the eye had become cloud-filled. Although the eye briefly redeveloped, water vapor imagery showed cooler and drier air entering the southern portion of the storm.[10] Fiona began to turn southwestward as it neared the 90°E longitude. By late 12 February, Fiona weakened below gale force intensity.[20] Moving steadily southward, it then re-curved south-southeastward along the 91°E. With the storm rapidly weakening, JTWC issued their final warning early on 13 February and Perth followed suit four hours later.[10][21] The remnants of Fiona moved into the Great Australian Bight, leading to significant amounts of rainfall. The Eyre Peninsula and Adelaide recorded more rain in 24 hours than they had in 2002 and 2001 combined. The New South Wales saw major flooding events in towns such as Tamworth. Flooding also closed the Pacific Highway. Over 100 houses along the Gold Coast were damaged due to the torrential rains.[10]
Tropical Cyclone Graham[]
| Category 1 tropical cyclone (Australian scale) | |
| Tropical storm (SSHWS) | |
  | |
| Duration | 24 February – 1 March |
|---|---|
| Peak intensity | 75 km/h (45 mph) (10-min) 985 hPa (mbar) |
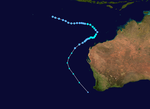
In late February, an area of convection situated inland for roughly a week emerged over open waters along the northern coast of Australia. A tropical low formed on 24 February,[11] and developed a banding feature by 25 February. Despite strong wind shear, the BOM began issuing warnings while the low was located several hundred kilometers north-northeast of Port Hedland. The disturbance was initially nearly stationary. At 0700 UTC on 27 February, the JTWC designated the storm as Tropical Cyclone Graham.[10] According to the JTWC, the storm had intensified late on 28 February, though the BOM noted the slight weakening of the storm.[10] Graham reached its peak intensity that day with winds of 95 km/h (60 mph), while nearing the coast.[11] The storm made landfall at Eighty Mile Beach, Western Australia at 1400 UTC on 28 February.[10] Graham weakened and dissipated on 1 March.[11]
The storm dropped rainfall in Western Australia, with 175 mm (6.9 in) recorded at Telfer.[10] The heavy rain caused flooding and road closures, and swelled a river passing through Fitzroy Crossing, though the river only topped its banks slightly.[22] In nearby Blue Bush Creek, two men drowned as their group of people attempted to cross floodwaters. Both men were rescued, though one died before emergency services arrived.[5] In addition to the flooding, a number of trees were downed.[23]
Tropical Cyclone Harriet[]
| Category 1 tropical cyclone (Australian scale) | |
| Tropical storm (SSHWS) | |
  | |
| Duration | 1 March – 11 March |
|---|---|
| Peak intensity | 85 km/h (50 mph) (10-min) 985 hPa (mbar) |
A tropical low developed southwest of Christmas Island on 28 February.[24] Perth TCWC issued a TWO on 1 March, which indicated an eastward-moving 1,005 mb (29.7 inHg) low. At 0600 UTC on 2 March, the JTWC initiated warnings on Tropical Cyclone 21S, estimating winds of 65 km/h (40 mph). The system maintained a well-defined circulation, although deep convection diminished somewhat on 2 March. Later that day, Perth began issuing gale warnings on the low as it was expected to develop into a tropical cyclone. Moving eastward, convection increased near the center, though dry air inhibited much development. At 0400 UTC on 4 March, the TCWC Perth named the system Tropical Cyclone Harriet.[12]
On 5 March, JTWC briefly decreased the intensity of Harriett to 55 km/h (35 mph),[25] as deep convection diminished, probably due to persistent dry air.[12] By late on 5 March, convection increased in coverage. Based on this, TCWC Perth upped their intensity to 80 km/h (50 mph). Late on 5 March, Harriet moved slowly southward and curved west-southwestward. Although convection fluctuated, the cyclone maintained its intensity. After deep convection decreased slightly, the JTWC lowered the intensity of Harriett to 65 km/h (40 mph). However, TCWC Perth suggested otherwise and on 8 March, Harriet peaked with winds of 100 km/h (65 mph), while located over 480 km (300 mi) north-northwest of Carnarvon. Early on 9 March, JTWC issued their final advisory on Harriet. The storm became extratropical at 1000 UTC on 9 March, while located about 580 km (360 mi) west-northwest of Carnarvon.[12] Strong winds from Harriet contributed to a large bushfire near Walpole, Western Australia.[24]
Severe Tropical Cyclone Erica[]
| Category 3 severe tropical cyclone (Australian scale) | |
| Category 1 tropical cyclone (SSHWS) | |
  | |
| Duration | 1 March – 12 March (Exited basin) |
|---|---|
| Peak intensity | 150 km/h (90 mph) (10-min) 960 hPa (mbar) |
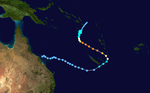
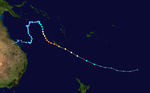
A monsoon trough strengthened into a tropical low on 1 March. The low then significantly organized and was named Erica on 4 March, just offshore Queensland.[12] Early on 5 March, the JTWC began classifying the system as Tropical Cyclone 22S.[26] Moving slowly southeastward and then northward under the influence of a weak mid-level ridge to the east, Erica attained 10-minute sustained winds of 150 km/h (90 mph). However, Erica soon weakened due to strong wind shear. On 7 March, the cyclone degenerated into a tropical low. After the remnants curved eastward and then southeastward, wind shear abated and became favorable for tropical cyclogenesis. As a result, the low regenerated into a tropical cyclone. After attaining the equivalent to a Category 1 hurricane on the Saffir–Simpson hurricane wind scale, Erica entered the South Pacific basin on 12 March.[12]
Severe Tropical Cyclone Erica was a powerful cyclone that severely affected New Caledonia and was considered the worst to affect the country since Cyclone Beti in 1996. Early in its existence while just offshore Queensland, the predecessor to Erica brought strong winds to the coast. Several trees were uprooted, and others were defoliated. Power lines were also damaged.[27]
Tropical Cyclone Craig[]
| Category 2 tropical cyclone (Australian scale) | |
| Tropical storm (SSHWS) | |
 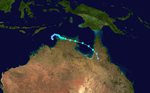 | |
| Duration | 8 March – 13 March |
|---|---|
| Peak intensity | 100 km/h (65 mph) (10-min) 976 hPa (mbar) |
TCWC Darwin began monitoring a tropical low that developed west of Darwin on 5 March.[13] Early on 8 March, the JTWC classified the system as Tropical Cyclone 24S.[28] At 0300 UTC on 9 March, the storm became Tropical Cyclone Craig, while situated northwest of Cape Fourcroy.[13] The storm deepened and drifted eastward and then southeastward. On 10 March, Craig made landfall on Melville Island with winds of 95 km/h (60 mph).[12] Upon emerging into the Van Diemen Gulf on 10 March, Craig peaked with sustained winds of 100 km/h (65 mph).[29] Craig struck the Coburg Peninsula and began to slowly weaken inland.[12] The storm reached the Gulf of Carpentaria on 11 March, where it accelerated southeastward. On 12 March at 0600 UTC, the cyclone made landfall south of Kowanyama. After moving inland, the storm quickly weakened and dissipated later that day.[12]
In advance of the storm, tropical cyclone advisories were issued for communities between Weipa and Mornington Island.[30] The government of the Tiwi Islands evacuated some residents to shelters.[31] In the Darwin area, certain schools were closed temporarily as a precaution.[32] Impact from Craig was generally minor. At Ramingining, 164 mm (6.5 in) of rain fell in just 24 hours. Storm surge ran 2 to 2.5 m (6.6 to 8.2 ft) on Goulburn Island and the Cobourg Peninsula, while tides were estimated at 1.5 m (4.9 ft) at Nhulunbuy.[13] Strong winds at Maningrida and Kowanyama downed numerous trees, with one striking a house in the latter. Craig inflicted minor damage to small craft in the northwestern Gulf of Carpentaria. Throughout the region, roads were cut by the cyclone.[12]
Severe Tropical Cyclone Inigo[]
| Category 5 severe tropical cyclone (Australian scale) | |
| Category 5 tropical cyclone (SSHWS) | |
 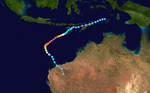 | |
| Duration | 30 March – 8 April |
|---|---|
| Peak intensity | 240 km/h (150 mph) (10-min) 900 hPa (mbar) |
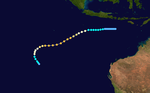
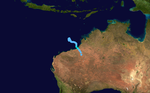
An area of disturbed weather was located within the near-equatorial trough near Papua New Guinea in late March. Despite easterly wind shear, a tropical low developed on 30 March, shortly before crossing the island of Flores. Decreasing wind shear allowed the low to strengthen into a tropical cyclone while crossing the Savu Sea on 1 April.[6] Later that day, the JTWC initiated advisories on Tropical Cyclone 26S.[33] On 2 April, BOM classified the low as Tropical Cyclone Inigo. An eye feature gradually organized as winds increased to 130 km/h (80 mph) early on 3 April. As a result, the BOM began classifying Inigo as a severe tropical cyclone.[34] Later on 3 April, low wind shear and strong divergence allowed the cyclone to undergo rapid intensification as the eye became well-defined.[6]
At 0600 UTC 4 April, Inigo peaked with sustained winds of 240 km/h (150 mph), according to BOM. Based on the pressure-wind relationship, it was estimated that Inigo reached a minimum barometric pressure of 900 mbar (27 inHg).[6] Thus, the storm tied with Cyclone Gwenda as the most intense tropical cyclone in the Australian cyclone region.[29] Simultaneously, JTWC indicated the Inigo peaked with sustained winds of 260 km/h (160 mph).[33] However, later on 4 April, increasing wind shear began to weaken Inigo.[6] On the following day, the eye became cloud-filled[34] and by 7 April, Inigo weakened to Category 2 status. Inigo made landfall in the Pilbara region of Western Australia on 8 April with winds of 75 km/h (45 mph). The circulation dissipated within 12 hours after moving ashore.[6]
The precursor tropical disturbance dropped heavy rainfall in eastern Indonesia.[34] In Kupang on West Timor, the system destroyed hundreds of homes and large fields of corn, bean, and rice crop. Heavy damage was reported near Ende, where flooding and mudslides destroyed 20 houses and destroyed the roads connecting to East Flores.[35] In Ende, a total of 294 animals were killed.[36] In East Flores Regency in eastern Flores Island, the system left 75 destroyed houses, along with 77 severely damaged and a further 56 receiving light damage.[35] Damage in Indonesia totaled less than $6 million,[6] and 102 injuries were reported. In addition, 58 fatalities were reported.[7] In Australia, the storm dropped 128 mm (5.04 in) of rain in 80 minutes.[37]
Tropical Cyclone Epi[]
| Category 1 tropical cyclone (Australian scale) | |
| Tropical storm (SSHWS) | |
  | |
| Duration | 5 June – 6 June |
|---|---|
| Peak intensity | 65 km/h (40 mph) (10-min) 993 hPa (mbar) |
In early June, an area of fairly persistent convection stretched from Papua New Guinea to just north of Fiji. Around 0630 UTC on 5 June, Epi developed near Woodlack Island, unusually close to the Equator. Initially, the storm appeared to be undergoing rapid deepening, prompting the JTWC to issue a TCFA. However, strong wind shear caused the system to quickly become less organized and the TCFA was soon cancelled. A very short lived cyclone, a Papua New Guinea warning during the late morning hour of 5 June placed Epi's center about 130 km (80 mi) northeast of Woodlack Island. Never recognized as a tropical cyclone by the JTWC, the third and final warning was issued later that day after winds fell below gale force.[14]
Season effects[]
This is a table of all of the storms that have formed in the 2002–03 Australian region cyclone season. It includes their duration, names, landfall(s)–denoted by bold location names – damages, and death totals. Damage and deaths include totals while the storm was extratropical, a wave, or a low, and all of the damage figures are in 2003 AUD and USD.
| Name | Dates | Peak intensity | Areas affected | Damages (AU$) |
Damages (US$) |
Deaths | |||
|---|---|---|---|---|---|---|---|---|---|
| Category | Wind speed (km/h (mph)) |
Pressure (hPa) | |||||||
| 07S | 27 December – 3 January |
Tropical low | 55 km/h (35 mph) | 1,006 hPa (29.71 inHg) | None | None | None | None | |
| 01U | 4–25 January | Category 2 tropical cyclone | 95 km/h (60 mph) | 988 hPa (29.18 inHg) | Northern Territory Western Australia |
Unknown | Unknown | None | |
| Beni | 1–5 February | Category 1 tropical cyclone | 65 km/h (40 mph) | 995 hPa (29.38 inHg) | Queensland New Caledonia |
$10 million | $6 million | 1 | |
| Fiona | 3–13 February | Category 4 severe tropical cyclone |
175 km/h (110 mph) | 935 hPa (27.61 inHg) | None | None | None | None | |
| Graham | 24 February – 1 March |
Category 1 tropical cyclone | 75 km/h (45 mph) | 985 hPa (29.09 inHg) | Western Australia | Unknown | Unknown | 1 | |
| Harriet | 1–11 March | Category 1 tropical cyclone | 85 km/h (50 mph) | 985 hPa (29.09 inHg) | Western Australia | None | None | None | |
| Erica | 1–12 March | Category 3 severe tropical cyclone |
150 km/h (90 mph) | 960 hPa (28.35 inHg) | New Caledonia | None | None | None | |
| Craig | 8–13 March | Category 2 tropical cyclone | 100 km/h (65 mph) | 976 hPa (28.82 inHg) | Northern Territory Queensland |
Unknown | Unknown | None | |
| Inigo | 30 March – 8 April | Category 5 severe tropical cyclone |
240 km/h (150 mph) | 900 hPa (26.58 inHg) | Indonesia Western Australia |
$10 million | $6 million | 58 | |
| Epi | 5 — 6 June | Category 1 tropical cyclone | 65 km/h (40 mph) | 993 hPa (29.32 inHg) | Papua New Guniea | None | None | None | |
| Season aggregates | |||||||||
| 10 systems | 27 December 2002 – 6 June 2003 |
240 km/h (150 mph) | 900 hPa (26.58 inHg) | $12 million | 60 | ||||
See also[]
- List of Southern Hemisphere tropical cyclone seasons
- Atlantic hurricane seasons: 2002, 2003
- Pacific hurricane seasons: 2002, 2003
- Pacific typhoon seasons: 2002, 2003
- North Indian Ocean cyclone seasons: 2002, 2003
Notes[]
- ^ All damage totals are in their respective currency values of 2003
- ^ Maximum sustained wind data from the Joint Typhoon Warning Center (JTWC) are in 1-minute intervals, while the other agencies such as the Bureau of Meteorology (BOM) use 10-minute intervals
References[]
- ^ Worldwide Tropical Cyclone Centers. National Hurricane Center (Report). National Oceanic and Atmospheric Administration. 9 September 2011. Retrieved 14 November 2013.
- ^ Terminologies used in the region of South-West Pacific Ocean. Severe Weather Information Centre (Report). World Meteorological Organization. 2008. Retrieved 29 November 2013.
- ^ Joe B. Courtney (2 June 2005). "The South Pacific and southeast Indian Ocean tropical cyclone season 2002–03" (PDF). Australian Meteorology Magazine. Australian Bureau of Meteorology. 54: 137–150. Archived from the original (PDF) on 13 October 2012. Retrieved 13 October 2012.
- ^ a b c "Drought one day, then flood in Qld". The Age. Australian Associated Press. 7 February 2003. Retrieved 21 August 2012.
- ^ a b "WA: Man drowns during aftermath of cyclone Graham". Australian Associated Press. 2003.
- ^ a b c d e f g h Tropical Cyclone Inigo (PDF) (Report). Bureau of Meteorology. 2003. pp. 1–5. Retrieved 31 October 2013.
- ^ a b Final Report for the Tenth Tropical Cyclone Committee Session (PDF). RA V Tropical Cyclone Committee for the South Pacific and South-East Indian Ocean (Report). World Meteorological Organization. 2004. p. 6. Retrieved 14 November 2013.
- ^ a b c Gary Padgett. Monthly Global Tropical Cyclone Summary December 2002 (Report). Australian Severe Weather. Retrieved 30 October 2013.
- ^ a b c d e Unnamed Tropical Cyclone (PDF) (Report). Bureau of Meteorology. 2003. pp. 1–4. Retrieved 8 October 2013.
- ^ a b c d e f g h i j k l m Gary Padgett. Monthly Global Tropical Cyclone Summary February 2003 (Report). Australian Severe Weather. Retrieved 30 October 2013.
- ^ a b c d Tropical Cyclone Graham (27 February – 1 March) (PDF) (Report). Bureau of Meteorology. 2003. pp. 1–2. Retrieved 6 November 2013.
- ^ a b c d e f g h i j Monthly Global Tropical Cyclone Summary March 2003 (Report). Archived from the original on 24 January 2011.
- ^ a b c d Tropical Cyclone Craig (Report). Bureau of Meteorology. 2003. Retrieved 8 October 2013.
- ^ a b Gary Padgett. Monthly Global Tropical Cyclone Summary June 2003 (Report). Australian Severe Weather. Retrieved 14 November 2013.
- ^ Tropical Cyclone 07S Best Track Analysis. Joint Typhoon Warning Center (Report). United States Navy. 2003. Retrieved 28 November 2013.
- ^ a b Gary Padgett. Monthly Global Tropical Cyclone Summary January 2003 (Report). Australian Severe Weather. Retrieved 29 November 2013.
- ^ "Beni flood costs $10m". The Age. Australian Associated Press. 7 February 2003. Retrieved 21 August 2012.
- ^ Robert Packett. A mouthful of mud: the fate of contaminants from the Fitzroy River, Queensland, Australia and implications for reef water policy (PDF). National Action Plan for Salinity and Water Quality; Queensland Department of Natural Resources and Water (Report). Charles Sturt University. pp. 296–297. Archived from the original (PDF) on 1 November 2013. Retrieved 23 August 2012.
- ^ Significant Weather — February 2003 (Report). Bureau of Meteorology. Retrieved 29 November 2013.
- ^ a b c d Tropical Cyclone Fiona (PDF) (Report). Bureau of Meteorology. 2003. pp. 1–4. Retrieved 28 November 2013.
- ^ a b Tropical Cyclone 14S Best Track Analysis. Joint Typhoon Warning Center (Report). United States Navy. 2003. Retrieved 29 November 2013.
- ^ "Cyclone Graham winds down". The Age. Australian Associated Press. 2003. Retrieved 6 November 2013.
- ^ "WA cyclone warning downgraded". ABC News. 2003.
- ^ a b Tropical Cyclone Harriet (PDF) (Report). Bureau of Meteorology. 2003. pp. 1–4. Retrieved 29 November 2013.
- ^ Tropical Cyclone 14S Best Track Analysis. Joint Typhoon Warning Center (Report). United States Navy. 2003. Retrieved 29 November 2013.
- ^ Tropical Cyclone 22S Best Track Analysis. Joint Typhoon Warning Center (Report). United States Navy. 2003. Retrieved 29 November 2013.
- ^ Tropical Cyclone Seasonal Summary 2002–03 (PDF) (Report). RSMC Nadi — Tropical Cyclone Centre, Fiji Meteorological Service. pp. 12–13. Archived from the original (PDF) on 27 July 2010. Retrieved 30 October 2013.
- ^ Tropical Cyclone 24S Best Track Analysis. Joint Typhoon Warning Center (Report). United States Navy. 2003. Retrieved 29 November 2013.
- ^ a b Australian Region Tropical Cyclone Best Tracks (Report). Australian Bureau of Meteorology. 2009. Retrieved 2 January 2010.
- ^ "Cyclone Craig intensifies, nears Cape York". ABC News. 12 March 2003. Retrieved 2 January 2010.
- ^ "Cyclone Craig looms 100 km east of Darwin". ABC News. 11 March 2003. Retrieved 2 January 2010.
- ^ "Darwin escapes brunt of cyclone". The Age. 11 March 2003. Retrieved 2 January 2010.
- ^ a b Tropical Cyclone 26S Best Track Analysis. Joint Typhoon Warning Center (Report). United States Navy. 2003. Retrieved 29 November 2013.
- ^ a b c Gary Padgett. Monthly Global Tropical Cyclone Summary April 2003 (Report). Australian Severe Weather. Retrieved 31 October 2013.
- ^ a b Indonesia — Landslides OCHA Situation Report No. 1. United Nations Office for the Coordination of Humanitarian Affairs (Report). ReliefWeb. 3 April 2003. Retrieved 14 November 2013.
- ^ Indonesia: OCHA Consolidated Situation Report No. 123. United Nations Office for the Coordination of Humanitarian Affairs (Report). ReliefWeb. 4 November 2003. Retrieved 14 November 2013.
- ^ Significant Weather — April 2003 (Report). Bureau of Meteorology. 2003. Retrieved 14 November 2013.
External links[]

- 2002–03 Australian region cyclone season
- Australian region cyclone seasons
- Tropical cyclones in 2002
- Tropical cyclones in 2003