2000 Atlantic hurricane season
| 2000 Atlantic hurricane season | |
|---|---|
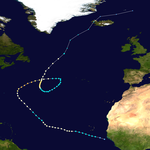
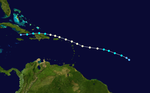
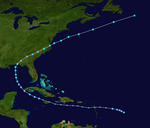
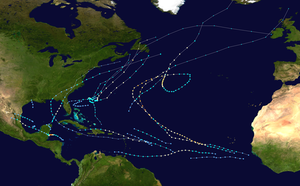 Season summary map | |
| Seasonal boundaries | |
| First system formed | June 7, 2000 |
| Last system dissipated | October 29, 2000 |
| Strongest storm | |
| Name | Keith |
| • Maximum winds | 140 mph (220 km/h) (1-minute sustained) |
| • Lowest pressure | 939 mbar (hPa; 27.73 inHg) |
| Seasonal statistics | |
| Total depressions | 19 |
| Total storms | 15 |
| Hurricanes | 8 |
| Major hurricanes (Cat. 3+) | 3 |
| Total fatalities | 105 total |
| Total damage | $1.29 billion (2000 USD) |
| Related articles | |
The 2000 Atlantic hurricane season was a fairly active hurricane season, but featured the latest first named storm in a hurricane season since 1992. The hurricane season officially began on June 1, and ended on November 30. It was slightly above average due to a La Niña weather pattern although most of the storms were weak It was also the only Season to Include 2 storms in Ireland. The first cyclone, Tropical Depression One, developed in the southern Gulf of Mexico on June 7 and dissipated after an uneventful duration. However, it would be almost two months before the first named storm, Alberto, formed near Cape Verde; Alberto also dissipated with no effects on land. Several other tropical cyclones—Tropical Depression Two, Tropical Depression Four, Chris, Ernesto, Nadine, and an unnamed subtropical storm—did not impact land. Five additional storms—Tropical Depression Nine, Florence, Isaac, Joyce, and Leslie—minimally affected land areas.
The most significant storm of the season was Hurricane Keith, which caused extensive damage in Central America. After remaining nearly stationary offshore, Keith moved inland over the Yucatán Peninsula and later made a second landfall in Mexico at hurricane intensity. It caused $319 million (2000 USD) in damage and 40 fatalities, mostly in Belize. The precursor to Tropical Storm Leslie brought severe flooding to South Florida, which losses reaching $950 million (2000 USD). Hurricane Gordon and Tropical Storm Helene both caused moderate damage in the Southeastern United States, mainly in Florida. Tropical Storm Beryl caused minor damage in Mexico and Hurricane Debby resulted in less than $1 million (2000 USD) in damage in the Greater and Lesser Antilles. Hurricane Michael brought widespread effects to Atlantic Canada, though a specific damage toll is unknown.
Seasonal forecasts[]
Pre-season outlooks[]
| Source | Date | Tropical storms |
Hurricanes | Major hurricanes |
| CSU | Average (1950–2000) | 9.6 | 5.9 | 2.3 |
| NOAA | Average | 11 | 6 | 2 |
| CSU | April 7, 2000 | 11 | 7 | 3 |
| CSU | June 7, 2000 | 12 | 8 | 4 |
| CSU | August 4, 2000 | 11 | 7 | 3 |
| NOAA | August 10, 2000 | 11 | 7 | 3 |
| Actual activity | 15 | 8 | 3 | |
Forecasts of hurricane activity are issued before each hurricane season by noted hurricane expert Dr. William M. Gray and his associates at Colorado State University (CSU), and separately by forecasters with the U.S. Government's National Oceanic and Atmospheric Administration (NOAA). According to CSU, the average season between 1950 and 2000 had 9.6 tropical storms, 5.9 hurricanes, and 2.3 major hurricanes (storms exceeding Category 3 on the Saffir–Simpson hurricane scale). A normal season, as defined by NOAA, has 9 to 12 named storms, of which five to seven reach hurricane strength and one to three become major hurricanes.[1][2]
Noted hurricane expert Dr. William M. Gray on April 7 predicted eleven named storms, with eight reaching hurricane strength and three of the eight reaching Category 3 strength.[3] The prediction issued on June 7 was similar, increasing the named storms to twelve, eight hurricanes, and four major hurricanes. On May 10, NOAA issued a season outlook, which gave the indication of an above-average season. According to NOAA, the global scale atmospheric circulation pattern which was taking place was conducive to an above-average hurricane season. However, La Niña was present it the Eastern Pacific, which was a factor in the activity in the season. NOAA issued a 75% chance of above average activity.[4]
Mid-season outlooks[]
After the season started on June 1,[5] CSU issued a mid-season forecast on August 4, which predicted 11 named storms, 7 hurricanes, and 3 major hurricanes. Six days after the CSU prediction, NOAA also released a mid-season outlook, forecasting exactly the same amount of activity, 11 named storms, 7 hurricanes, and 3 major hurricanes. With a 75% chance of above-average activity, there was an elevated risk of landfalling hurricanes.[6]
Seasonal summary[]


The Atlantic hurricane season officially began on June 1, 2000.[5] It was an above average season in which 19 tropical cyclones formed. Fifteen depressions attained tropical storm status, and eight of these attained hurricane status. Three hurricanes further intensified into major hurricanes.[7] The season was above average most likely because of an ongoing La Niña in the Pacific Ocean.[4] Three hurricanes and two tropical storms made landfall during the season[7] and caused 77 deaths and $1.2 billion in damage (2000 USD).[7][8][9][10] Hurricane Florence and Isaac and Tropical Storm Leslie also caused damage and fatalities, though none of the three made landfall. The last storm of the season, an unnamed subtropical storm, dissipated on October 29,[7] over a month before the official end of hurricane season on November 30.[11]
Tropical cyclogenesis first occurred in the month of June, with two tropical depressions developing in the Atlantic.[12] However, no tropical cyclones developed in the month of July, the first phenomenon since 1993.[13] In August, five tropical cyclones developed, most notably, Hurricane Alberto. September was more active, with seven named storms forming; that month featured Hurricane Keith, the strongest system of the 2000 Atlantic hurricane season. With seven named storms forming in September, this made it the most active September on record at the time. This record was surpassed two years later when eight storms formed in September. In addition, a quick succession of eight storms occurred in September, and lasted into early October. Six tropical cyclones existed in October and one additional subtropical storm developed in the last week of the month. Following an active October, no tropical cyclogenesis occurred in November, which is the final month of the season.[7]
The season's activity was reflected with an accumulated cyclone energy (ACE) rating of 119.[14] ACE is, broadly speaking, a measure of the power of the hurricane multiplied by the length of time it existed, so storms that last a long time, as well as particularly strong hurricanes, have high ACEs. ACE is only calculated for full advisories on tropical systems at or exceeding 34 knots (39 mph, 63 km/h) or tropical storm strength. Subtropical cyclones, including the unnamed storm as well as the initial stages of Florence, Leslie, and Michael, are excluded from the total.[15]
Systems[]
Tropical Depression One[]
| Tropical depression (SSHWS) | |
  | |
| Duration | June 7 – June 8 |
|---|---|
| Peak intensity | 30 mph (45 km/h) (1-min) 1008 mbar (hPa) |
A tropical wave exited the west coast of Africa on May 23 and tracked westward across the Atlantic Ocean and the Caribbean.[12] The system had entered into the Gulf of Mexico on June 6.[16] Another tropical wave merged with the system on June 7 and developed into a low-pressure area in the Gulf of Mexico.[12] Later that day, the National Hurricane Center began classifying the system as Tropical Depression One. Though the depression was predicted to intensify into a tropical storm,[17] strong wind shear produced by an upper-anticyclone prevented significant strengthening.[12]
The depression tracked slowly and erratically through the Gulf of Mexico. By late on June 8, a reconnaissance plane flight indicated that the depression had degenerated into a low-pressure area.[12][18] The remnants of the depression produced gusty winds and light to moderate rainfall along the Gulf Coast of Mexico;[16] some areas in the state of Tamaulipas reported precipitation amounts as high as 7.18 inches (182 mm).[19] In addition, heavy precipitation was reported in south-central Texas.[12]
Tropical Depression Two[]
| Tropical depression (SSHWS) | |
  | |
| Duration | June 23 – June 25 |
|---|---|
| Peak intensity | 35 mph (55 km/h) (1-min) 1008 mbar (hPa) |
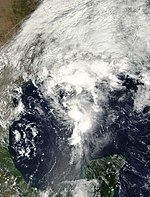
A tropical wave emerged off the coast of Africa and quickly developed into Tropical Depression Two on June 23.[20] Although it was well-organized,[12] the National Hurricane Center did not initiate advisories on the depression until 1500 UTC on June 24,[21] since it operationally appeared that a surface circulation did not exist until then. However, the depression was less organized after the National Hurricane Center began advisories.[12] Having formed at 19.8°W, it was one of the easternmost developing tropical cyclones in the month of June, even further east than Tropical Storm Ana in 1979 and Tropical Depression Two in 2003.[12][13] Though light wind shear and marginally warm sea surface temperatures were in the path of the depression,[22] no significant intensification occurred as it tracked generally westward.[20] The depression began encountering a stable air mass,[12] and degenerated back into a tropical wave on June 25.[20]
Hurricane Alberto[]
| Category 3 hurricane (SSHWS) | |
  | |
| Duration | August 3 – August 23 |
|---|---|
| Peak intensity | 125 mph (205 km/h) (1-min) 950 mbar (hPa) |
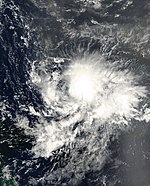
A well-developed tropical wave was observed in satellite imagery over central Africa on July 30. The system tracked westward and emerged into the Atlantic Ocean on August 3. Thereafter, the system rapidly organized, and developed into Tropical Depression Three at 1800 UTC that day. The depression moved west-northwestward and strengthened into Tropical Storm Alberto early on August 4. While briefly turning westward on August 6, Alberto reached hurricane status. It tracked west-northwestward, and by early the following day, the storm reached an initial peak with winds of 90 mph (145 km/h). Shortly thereafter, Alberto re-curved northwestward. Wind shear then increased, which caused Alberto to weaken to a tropical storm on August 9. However, it quickly re-strengthened, and early on August 10, Alberto was upgraded to a hurricane again. Due to a break in a subtropical ridge, Alberto gradually curved northward and north-northeastward between August 11 and 12. While turning northeastward, Alberto strengthened into a Category 3 hurricane, becoming the first major hurricane of the season. By 1200 UTC on August 12, Alberto attained its peak intensity with winds of 125 mph (201 km/h).[23]
Increasing upper-level westerlies caused Alberto to weaken as it moved east-northeastward, with the cyclone losing most of its convection. Early on August 14, Alberto was downgraded to a tropical storm. A westerly trough that had been guiding Alberto outran the storm, and strong ridging developed to the north and west. As a result, Alberto turned southward on August 15, southwestward on August 16, and then to the west on August 17. While curving northwestward and then northward, Alberto began to re-strengthen, and was upgraded to a hurricane for the third occasion on August 18. Alberto reached a third peak intensity as a Category 2 hurricane with winds of 105 mph (169 km/h) on August 20. After weakening back to a Category 1 hurricane, Alberto had completed a cyclonic loop, which it had started on August 13. Due to decreasing ocean temperatures, Alberto was again downgraded to a tropical storm on August 23 as it accelerated northeastward. Six hours later, Alberto transitioned into an extratropical cyclone while centered about 780 miles (1,260 km) south-southwest of Reykjavík, Iceland.[23]
Tropical Depression Four[]
| Tropical depression (SSHWS) | |
  | |
| Duration | August 8 – August 11 |
|---|---|
| Peak intensity | 35 mph (55 km/h) (1-min) 1009 mbar (hPa) |
An area of low pressure detached from a frontal zone on August 4 and moved southwestward. After developing a minimal amount of deep convection, an Air Force Reserve Command reconnaissance aircraft found a well-defined low-level circulation on August 8. The depression then moved westward without intensifying for two days. On August 10, the depression was about 80 miles (130 km) east of Cape Canaveral, Florida when it abruptly turned northeastward in advance of a deep-layer trough over the eastern United States. After minimal strengthening, the depression dissipated to the north of the Bahamas on August 11. While a tropical cyclone, a reconnaissance flight reported winds of 56 mph (90 km/h) at 1,500 feet (460 m). However, it was not upgraded to a tropical storm since the aforementioned wind speed did not represent the intensity of the depression.[24]
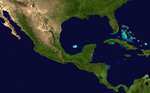
Tropical Storm Beryl[]
| Tropical storm (SSHWS) | |
  | |
| Duration | August 13 – August 15 |
|---|---|
| Peak intensity | 50 mph (85 km/h) (1-min) 1007 mbar (hPa) |
A tropical wave emerged from the coast of Africa with a closed circulation on August 3. The system split, with the northern portion developing into Hurricane Alberto, while the southern portion of the wave continued westward. Minimal deep convection persisted until the wave reached the Yucatán Peninsula on August 12. After emerging into the Gulf of Mexico on the following day, satellite imagery and a reconnaissance aircraft flight indicated that the system developed into Tropical Depression Five at 1800 UTC. Early on August 13, the depression intensified into Tropical Storm Beryl.[8] Despite predictions for Beryl to reach hurricane status,[25] it remained disorganized and peaked as a 50 mph (80 km/h) tropical storm.[8]
By 0700 UTC on August 15, Beryl made landfall about 35 miles (56 km) north of La Pesca, in the Mexican state of Tamaulipas with winds of 50 mph (80 km/h). Beryl quickly weakened inland, and was downgraded to a tropical depression five hours after moving inland. Shortly thereafter, Beryl dissipated while centered near Monterrey.[8] In Mexico, Beryl dropped light to moderate rainfall, especially in Tamaulipas, which peaked at 9.76 inches (248 mm).[26] One person drowned due to flood waters in northeastern Mexico.[8] Damage was light, totaling to $27,000 (2000 USD).[9] In southern Texas, Beryl brought light precipitation to some locations. Cloud cover and rainfall in the Brownsville area resulted in the coldest maximum temperature recorded for the city on the date of August 15.[27]
Tropical Storm Chris[]
| Tropical storm (SSHWS) | |
  | |
| Duration | August 17 – August 19 |
|---|---|
| Peak intensity | 40 mph (65 km/h) (1-min) 1008 mbar (hPa) |
A tropical wave exited the west coast of Africa on August 12. Although large amounts of deep convection accompanied the system, it was displaced from the poorly defined center. Over the next few days, convection consolidated and by 1200 UTC on August 17, the system began as Tropical Depression Six, while centered about 690 miles (1,110 km) east of the Lesser Antilles.[28] Outflow was initially limited due to light wind shear, though the depression was forecast to become a strong tropical storm by August 20.[29] It was "highly surprising" to the National Hurricane Center that the depression did not immediately begin to intensify, despite warm sea surface temperatures and light wind shear.[30] Because of a burst in deep convection, as well as satellite imagery estimating winds of 40 mph (65 km/h), the depression strengthened into Tropical Storm Chris at 1200 UTC on August 18.[28]
Upon becoming a tropical storm, Chris attained its peak intensity with winds of 40 mph (65 km/h) and a minimum barometric pressure of 1,008 mbar (29.8 inHg).[28] Because wind shear was believed to be weak, further intensification seemed very likely.[31] Unexpectedly, Chris weakened back to a tropical depression by 1800 UTC on August 18, after having been a tropical storm for only six hours.[28] However, the National Hurricane Center operationally held Chris at tropical storm intensity until early on the following day. Convection was nearly non-existent early on August 19, though there were a few small bursts in convection.[32] Later that day, a reconnaissance aircraft flight into the storm found no circulation, while a QuikSCAT pass indicated an open wave.[33] As a result, Chris dissipated while east of the northernmost Leeward Islands at 1200 UTC on August 19.[28]
Hurricane Debby[]
| Category 1 hurricane (SSHWS) | |
  | |
| Duration | August 19 – August 24 |
|---|---|
| Peak intensity | 85 mph (140 km/h) (1-min) 991 mbar (hPa) |
A strong tropical wave exited the west coast of Africa on August 16. No development occurred until August 19, when convection began consolidating around a well-defined low-level circulation. As a result, the system became Tropical Depression Seven at 1800 UTC on that same day, while located about 1,035 miles (1,666 km) east of the Windward Islands. Favorable conditions allowed the depression to become Tropical Storm Debby early on August 20 and further strengthening into a hurricane occurred 24 hours later. At 1200 UTC on August 21, sustained winds peaked at 85 mph (135 km/h). Debby made three landfalls on August 22, in Barbuda, Saint Barthélemy, and Virgin Gorda, before re-entering the Atlantic north of Puerto Rico. As Debby paralleled the north coast of Hispaniola late on August 23, it weakened to a tropical storm. Unexpectedly, the storm continued westward and weakened further, instead of approaching Florida and strengthening into a major hurricane. While south of eastern Cuba on August 24, Debby was downgraded to a tropical depression, six hours becoming completely dissipating.[10]
Light rainfall and gusty winds caused minor damage in Barbuda, Saint Martin, and Trinidad and Tobago.[10] Brief blackouts and damage reaching $200,000 was reported in the United States Virgin Islands. Effects were most severe in Puerto Rico, where some areas experienced more than 12 inches (300 mm) of rainfall. Mudslides caused by flooding damaged roads, bridges, and houses. At 406 homes on the island were flooded, which five suffering at least moderate damage.[34] In San Juan, slick roads caused several minor car accidents.[35] One indirect fatality was attributed to the storm after a man fell off his roof while attempting to remove a satellite dish.[10] Damage on the island of Puerto Rico reached $501,000.[34] According to the Civil Defense Force of Dominican Republic, severe flooding in the northern portions of that country caused the evacuation of more than 700 people. In Haiti, squalls tore tin roofs off of numerous shanty homes and subsequently flooded a few.[36] Rainfall in Cuba brought relief to an eight-month-long drought in eastern Cuba.[10]
Tropical Storm Ernesto[]
| Tropical storm (SSHWS) | |
  | |
| Duration | September 1 – September 3 |
|---|---|
| Peak intensity | 40 mph (65 km/h) (1-min) 1008 mbar (hPa) |
A tropical wave emerged into the Atlantic from the west coast of Africa on August 28. While tracking west-northwestward, satellite imagery indicated a developing low-level circulation. After significant deep convection formed, the system was classified as Tropical Depression Eight at 1200 UTC on September 1.[37] Because of potentially unfavorable wind shear, only slight intensification was forecast.[38] The depression tracked west-northwestward under the influence of a subtropical ridge to its north.[37] Because of satellite intensity estimates of sustained winds of 40 mph (64 km/h), increased deep convection, and improvements in outflow,[39] the depression became Tropical Storm Ernesto at 0600 UTC on September 2. However, the NHC noted in its Tropical Cyclone Report on Ernesto that it may not have been a tropical cyclone at all, as QuikSCAT surface wind estimates indicated that there was no closed circulation, although the data was dismissed as inconclusive.[37]
As it strengthened into a tropical storm, Ernesto attained its peak intensity with winds of 40 mph (64 km/h) and a minimum pressure of 1,008 mbar (29.8 inHg).[37] Because of vertical shear, the low-level circulation did not become well-defined. Because convection was being sheared away from the center, the National Hurricane Center noted the possibility of Ernesto weakening back to a tropical depression, though forecasts indicated otherwise.[40] Later that day, no significant change in intensity was predicted, as persistent wind shear seemed to be weakening Ernesto, though the SHIPS and GFDL computer models called for significant strengthening.[41] Although deep convection re-developed near the center early on September 3, no intensification occurred.[42] At 1800 UTC on September 3, Ernesto weakened to a tropical depression. Six hours later, Ernesto dissipated to the east-northeast of the Leeward Islands.[37]
Tropical Depression Nine[]
| Tropical depression (SSHWS) | |
  | |
| Duration | September 7 – September 9 |
|---|---|
| Peak intensity | 35 mph (55 km/h) (1-min) 1006 mbar (hPa) |
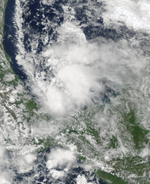
A low-level trough and a cluster of convection associated with a tropical wave interacted in the Gulf of Mexico in early September 2000. A disorganized low-level center developed and, thus, the system was classified as Tropical Depression Nine while located 185 miles (298 km) south of Lake Charles, Louisiana on September 7. Due to proximity to land, the depression was unable to intensify into a tropical storm and attained a maximum wind speed of 35 mph (56 km/h). The depression weakened slightly before making landfall near Sabine Pass, Texas on September 9. Eight hours later, the depression dissipated while barely inland.[43]
The depression brought light to moderate rainfall to Louisiana, Mississippi, Arkansas, Alabama, and Texas, though it was generally less than 3 inches (76 mm).[44] A few areas in southern Louisiana, Mississippi, and Alabama reported precipitation in excess of 6 inches (150 mm);[45] rainfall associated with the depression peaked at 6.70 inches (170 mm) in Buras-Triumph, Louisiana.[44] However, the depression caused no damage or fatalities.[43]
Hurricane Florence[]
| Category 1 hurricane (SSHWS) | |
  | |
| Duration | September 10 – September 17 |
|---|---|
| Peak intensity | 80 mph (130 km/h) (1-min) 985 mbar (hPa) |
A cold front moved off the continent of North America in early September. The system spawned a low-pressure area that gradually developed into a subtropical depression at 1800 UTC on September 10, while located about 325 miles (523 km) west-southwest of Bermuda. It rapidly acquired tropical characteristics and became Tropical Depression Ten at 0600 UTC on September 11. Thereafter, the depression strengthened into Tropical Storm Florence at 1200 UTC on that day and reached hurricane status only six hours later. Drier mid-tropospheric air weaken Florence to a tropical storm, but re-strengthen into a hurricane later on September 12.[46]
Due to a combination of north-northwesterly shear and lower sea surface temperatures, Florence again weakened on September 13 and was downgraded to a tropical storm. After moving erratically for almost five days, Florence accelerated east-northeastward in response to a short-wave trough on September 15. The storm soon began to re-intensify, becoming a hurricane early on September 16. Shortly thereafter, Florence curved northeastward. However, colder sea surface temperatures weakened it to a tropical storm September 17. Early on the following day, Florence was absorbed by an extratropical low near Newfoundland. Rip current along the East Coast of the United States drowned three people in North Carolina. Tropical storm force winds were reported in Bermuda, though no damage occurred.[46]
Hurricane Gordon[]
| Category 1 hurricane (SSHWS) | |
  | |
| Duration | September 14 – September 18 |
|---|---|
| Peak intensity | 80 mph (130 km/h) (1-min) 981 mbar (hPa) |
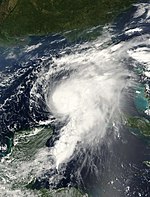
A tropical wave exited the west coast of Africa on September 4 and tracked westward across the Atlantic Ocean with minimal organization for four days. After slowly developing convection between September 8 and 14, an Air Force Reserve reconnaissance aircraft reported a closed circulation. As a result, the system was classified as Tropical Depression Eleven just offshore Quintana Roo. Shortly thereafter, the depression made landfall in Quintana Roo. On September 15, the system emerged into the Gulf of Mexico. Due to warm sea surface temperatures, the depression strengthened into Tropical Storm Gordon on the following day and further to hurricane intensity on September 17 while tracking northeastward. However, vertical wind shear and dry air entrainment weakened Gordon to a tropical storm later that day. At 0300 UTC on September 18, Gordon made landfall near Cedar Key, Florida with winds of 65 mph (105 km/h). Gordon rapidly weakened inland and was only a tropical depression when it was absorbed by a frontal system over Georgia about 15 hours later.[47]
While passing through the Lesser Antilles, the precursor tropical wave caused locally heavy rainfall and wind gusts between 29 and 35 mph (47 and 56 km/h). Shortly before developing into a tropical cyclone, flooding in mountainous areas of Guatemala caused 23 fatalities. In its early stages, Gordon produced locally heavy rainfall in Cuba and the Yucatán Peninsula. The storm produced abnormally high tides along the west coast of Florida, which caused widespread, but minor coastal flooding.[47] At least 65 homes and businesses were flooded, while numerous coastal roads, including Bayshore Boulevard and the Courtney Campbell Causeway, were closed due to water inundation.[48] One fatality occurred near Pensacola, after a surfer drowned in rough seas.[47] Strong winds in the state caused damage to houses, businesses, power lines, and trees. Two tornadoes in Southwest Florida extensively damaged 2 condominiums and at least 24 houses. A third tornado along the east coast of Central Florida caused minimal damage to trees and roofs. Minor flooding occurred in some areas [48] due to rainfall reaching 9.48 inches (241 mm) in Mayo.[48][49] In North Carolina, flooding caused two indirect fatalities when a car lost control and crashed into a tractor trailer.[50] In other states, light rainfall caused mostly minor effects. Overall, Gordon was responsible for $10.8 million in damage.[47]
Tropical Storm Helene[]
| Tropical storm (SSHWS) | |
  | |
| Duration | September 15 – September 25 |
|---|---|
| Peak intensity | 70 mph (110 km/h) (1-min) 986 mbar (hPa) |
A tropical wave emerged into the Atlantic from the west coast of Africa on September 10 and gradually developed into Tropical Depression Twelve on September 15, while located more than 600 miles (970 km) east of the Leeward Islands. It did not intensify and degenerated to a tropical wave on the following day. The remnants continued westward and crossed the Leeward Islands on September 17. Late on September 19, the remnants redeveloped into Tropical Depression Twelve near Grand Cayman. Around 1200 UTC on September 20, the depression crossed near the western tip of Cuba. Entering the Gulf of Mexico, the depression began strengthening, and became Tropical Storm Helene at early on September 21, while tracking northward. Later that day, Helene peaked with winds of 70 mph (110 km/h), though due to increasing wind shear, the storm soon began to weaken. At 1200 UTC on September 22, Helene made landfall near Fort Walton Beach, Florida with winds of 40 mph (64 km/h). Although the storm weakened slightly inland, it later began re-strengthening and became a tropical storm over North Carolina late on September 23. After re-emerging into the Atlantic Ocean, Helene re-intensified to near hurricane status, though the storm was absorbed by a cold front on September 26, while east-southeast of Newfoundland.[51]
The remnant tropical wave produced strong winds and flooding in the Lesser Antilles.[51] Effects were the worst in Puerto Rico, where flash flooding and mudslides destroyed one houses and damaged at least 100 others. In addition, a bridge was also destroyed and many other roads were impassable due to flooding. Impact in Cuba, Jamaica, and Hispaniola is unknown.[51] A combination of gusty winds, locally heavy rainfall, and a few tornadoes in the Florida Panhandle caused about 5,000 power outages, damaged more than 220 homes,[48] and destroyed two houses and four mobile homes.[52] Heavy rainfall caused the Sopchoppy River to exceed its banks, flooding nearby houses.[48] Outside of Florida, effects were most severe in South Carolina, where rainfall in excess of 9 inches (230 mm) fell,[53] and a tornado caused one fatality,[51] six injuries, and damaged 12 houses.[54][55] The other death in the state occurred when a car hydroplaned and crashed into a tree, which killed the driver.[51] Throughout its path, Helene caused slightly more than $16 million in damage.[7]
Hurricane Isaac[]
| Category 4 hurricane (SSHWS) | |
  | |
| Duration | September 21 – October 1 |
|---|---|
| Peak intensity | 140 mph (220 km/h) (1-min) 943 mbar (hPa) |
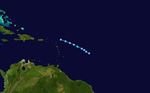
A well-defined tropical wave emerged into the Atlantic from the west coast of Africa on September 20. The cloud pattern quickly became better-defined, and developed into Tropical Depression Thirteen on September 21 while centered south of Cape Verde. The depression quickly intensified due to low wind shear and became Tropical Storm Isaac early on September 22 as it headed west-northwestward. Isaac continued to strengthen and was upgraded to a hurricane on September 23. After reaching a preliminary peak with winds of 120 mph (190 km/h), the structure of the storm became less organized, possibly due to slightly colder ocean temperatures and increased wind shear. By 1200 UTC on September 26, Isaac ceased weakening after winds dropped to 85 mph (137 km/h). The storm began to re-strengthen on September 27 after wind shear decreased.[56]
On September 28, Isaac peaked as a low-end Category 4 hurricane with winds of 140 mph (225 km/h). Following its peak intensity, Isaac began to weaken immediately thereafter, while turning north-northwestward. Eventually, the storm turned northward before re-curving north-northeastward. Further weakening occurred after Isaac moved over decreasing sea surface temperatures and dropped down to Category 1 intensity by September 30, while accelerating northeastward. On October 1, Isaac was downgraded to a tropical storm shortly before transitioning into extratropical later that same day. The extratropical remnants affected the British Isles between October 3 and 4, before being absorbed into another extratropical storm to the north of Scotland on October 4.[56] Minimal impact was reported from Isaac. One fatality occurred when a passenger drowned after his boat capsized due to large waves produced by Isaac offshore Long Island, New York.[56]
Hurricane Joyce[]
| Category 1 hurricane (SSHWS) | |
  | |
| Duration | September 25 – October 2 |
|---|---|
| Peak intensity | 90 mph (150 km/h) (1-min) 975 mbar (hPa) |
A poorly organized tropical wave emerged into the Atlantic from the west coast of Africa on September 22. Over the next three days, the system tracked westward and slowly began to develop a closed circulation. By September 25, the National Hurricane Center initiated advisories. Convection became further organized, and the depression continued to intensity. Twelve hours after becoming a cyclone, the depression was upgraded to Tropical Storm Joyce early on September 26. Joyce continued to strengthen and became a hurricane by September 27. On the following day, a pinhole eye appeared, and shortly thereafter, Joyce peaked as a strong Category 1 hurricane with winds of 90 mph (140 km/h) on September 28.[57]
After peak intensity on September 28, wind shear and a possible intrusion of dry air caused Joyce to become disorganized and weaken. Late on September 29, Joyce was downgraded to a tropical storm while centered well east of the Lesser Antilles. Though it was always predicted to re-intensify, Joyce continued to weaken and became a tropical depression on October 1 while crossing through the southern Windward Islands. Early on the following day, Joyce unexpectedly degenerated back into an open tropical wave over the southeast Caribbean Sea. The remnants were monitored for regeneration, but never developed back into a tropical cyclone. Overall, impact from Joyce was minimal, limited to mainly rainfall and near-tropical storm force winds in Trinidad and Tobago and Barbados.[57] The remnants of Joyce also caused similar effects on the ABC islands and Dominican Republic, which resulted in minor damage.[58][59]
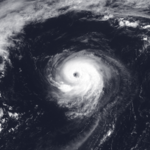
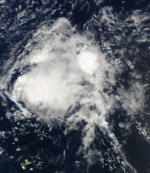
Hurricane Keith[]
| Category 4 hurricane (SSHWS) | |
  | |
| Duration | September 28 – October 6 |
|---|---|
| Peak intensity | 140 mph (220 km/h) (1-min) 939 mbar (hPa) |
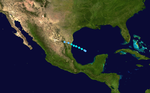
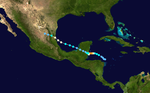
A tropical wave emerged off the west coast of Africa on September 16. The system uneventfully crossed the Atlantic and Caribbean, before developing into Tropical Depression Fifteen while near Honduras on September 28. The depression gradually strengthened, and became Tropical Storm Keith on the following day. As the storm tracked westward, it continued to intensify and was upgraded to a hurricane on September 30. Shortly thereafter, Keith began to rapidly deepen and peaked as a 140 mph (230 km/h) Category 4 hurricane less than 24 hours later. Keith then began to meander erratically offshore of Belize, which significantly weakened the storm due to land interaction. By late on October 2, Keith made landfall in Ambergris Caye, Belize as a minimal hurricane. It quickly weakened to a tropical storm, before another landfall occurred near Belize City early on the following day. While moving inland over the Yucatán Peninsula, Keith weakened further, and was downgraded to a tropical depression before emerging into the Gulf of Mexico on October 4. Once in the Gulf of Mexico, Keith began to re-strengthen and was upgraded to a tropical storm later that day, and a hurricane on the following day. By late on October 5, Keith made its third and final landfall near Tampico, Tamaulipas, Mexico as a moderately strong Category 1 hurricane. The storm quickly weakened inland and dissipated as a tropical cyclone by 24 hours after landfall.[60]
Keith brought heavy rainfall to several countries in Central America, which resulted in extensive flooding, especially in Belize and Mexico. In Guatemala, the storm flooded 10 towns,[60] and caused one fatality.[61] Similarly, one fatality also occurred in El Salvador, and at least 300 people were affected by flooding in that country.[62] Thirteen communities in Nicaragua were completely isolated after Keith made roads impassable.[63] Twelve deaths were reported in Nicaragua, all of which were flood-related.[60][62] Five people were presumed dead in Honduras after an aircraft disappeared near Roatán; one other fatality occurred due to flooding. The storm brought torrential rainfall to Belize, with many areas reporting at least 10 inches (250 mm) of rain, while highest reported amount of precipitation was 32.67 inches (830 mm) in Belize City.[60] In Belize, a village reported that only 12 houses remained, while elsewhere in the country, at least 60 homes were destroyed or damaged;[60] several houses in Belize City suffered minor roof damage. At least 19 people were killed in Belize and damages totaled to $280 million (2000 USD).[64] Heavy rainfall also occurred in Mexico, especially in the states of Nuevo León and Tamaulipas.[65] Flooding by Keith caused several mudslides and a few rivers reached historic levels. Throughout Mexico, at least 460 houses were damaged or destroyed and other losses in infrastructure occurred.[9] In addition, one person drowned due to heavy rainfall.[60] Damages incurred in associated with Keith in Mexico totaled approximately $365.9 million (2000 MXN, $38.7 million 2000 USD). Overall, Keith was responsible for 40 deaths[60][62][64] and $319 million (2000 USD) in damage.[9][61][62][64]
Tropical Storm Leslie[]
| Tropical storm (SSHWS) | |
  | |
| Duration | October 4 – October 7 |
|---|---|
| Peak intensity | 45 mph (75 km/h) (1-min) 1006 mbar (hPa) |
A tropical wave, which likely spawned Hurricane Isaac, entered the eastern Caribbean Sea on September 27. The system slowly organized while tracking westward and later moved to the north-northwest around Hurricane Keith. Eventually, the system moved northward into the Gulf of Mexico and the Straits of Florida. The system interacted with a frontal boundary while crossing Florida on October 3 and 4, which caused torrential rainfall. Satellite imagery indicated the development of a circulation near Orlando. Because of its structure, the system became a subtropical depression at 1200 UTC on October 4. About six hours later, the subtropical depression emerged into the Atlantic and low-level circulation gradually moved toward the deep convection while tracking eastward. By 1200 UTC on October 5, the subtropical depression was reclassified as Tropical Storm Leslie. While fully tropical, Leslie strengthened slightly and peaked with winds of 45 mph (72 km/h). However, it soon began interacting with a cold front and transitioned into an extratropical cyclone on October 7, while located northwest of Bermuda.[66]
The system dropped heavy rainfall in Cuba, peaking at 8.25 inches (210 mm) in the Havana Province.[67] While the precursor crossed Florida, it produced torrential rainfall across southern Florida, especially in the Miami metropolitan area.[68] In Miami-Dade County alone, 1,005 houses were destroyed, 1,358 were severely damaged, and 3,443 had minor damage.[69] Throughout the state, at least 93,000 homes were flooded. Electrical stations were also damaged by floods, leaving more than 27,000 people without power.[70] Extensive agricultural damage occurred, with 40,000 acres (160 km2) of farmland inundated by water. Overall, the precursor system of Leslie resulted in about $950 million (2000 USD) in damage, slightly more than half of that figure was agriculture related.[71] Additionally, three fatalities occurred, two of which due to drowning,[66] while the third was a man that fell while attempting to unclog a roof drain.[72] The remnants of Leslie caused near tropical storm force winds and waves up to 16 feet (4.9 m) in Newfoundland, though damage in the region was minimal.[73]
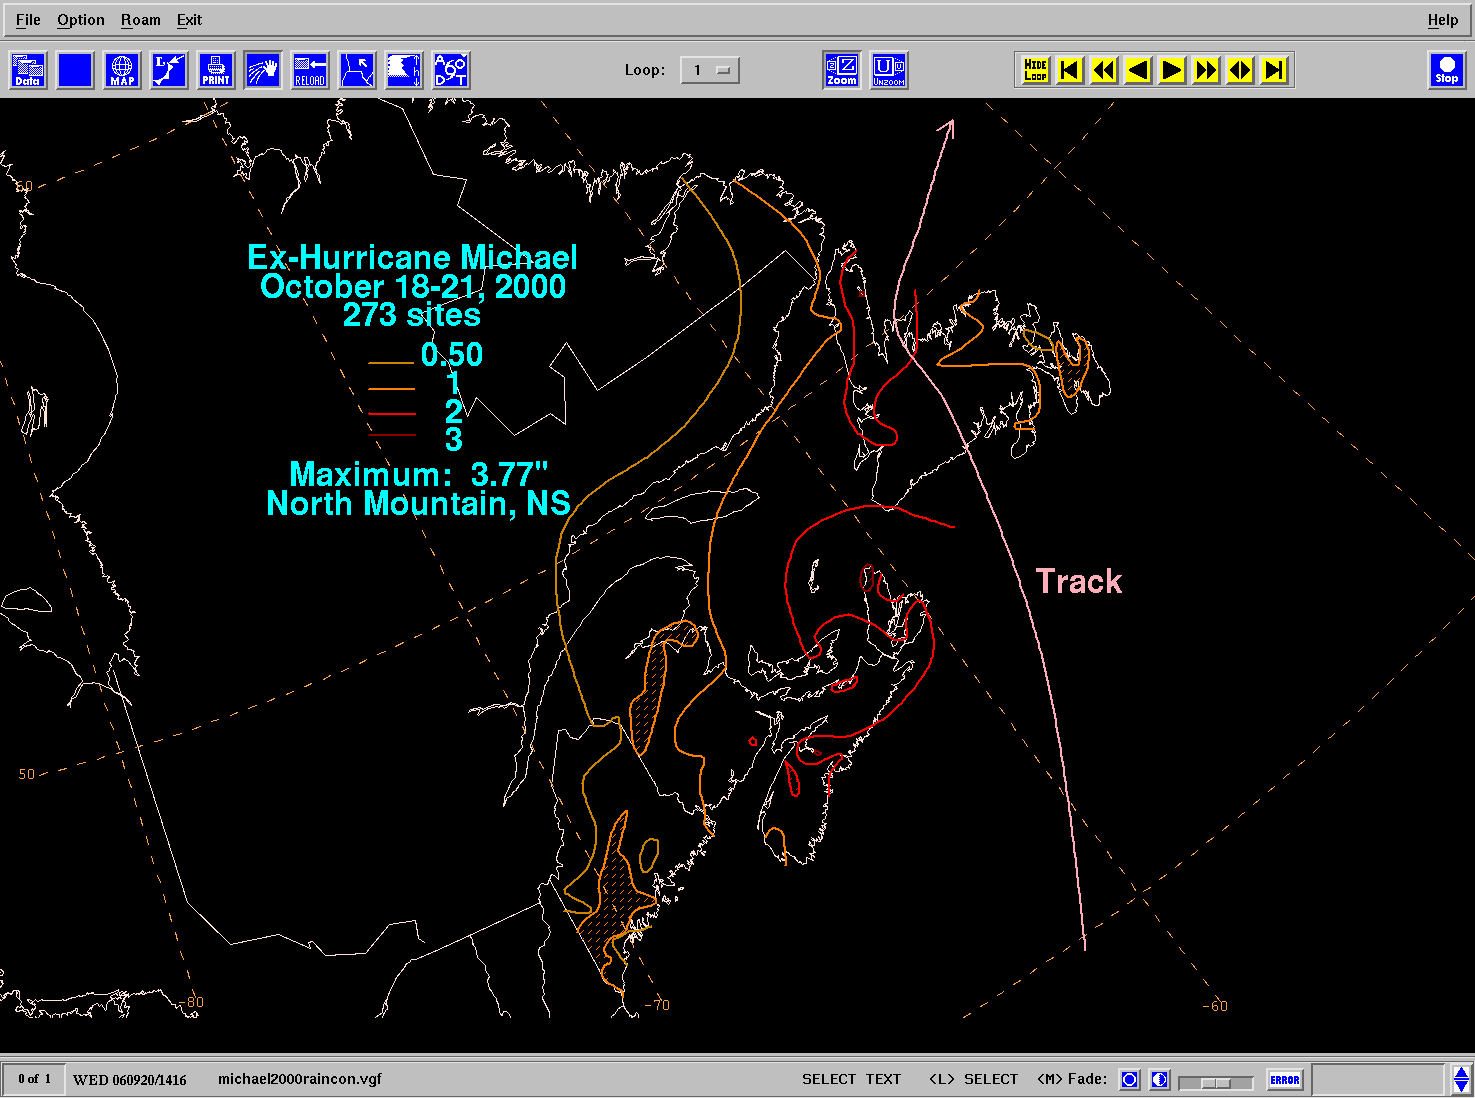
Hurricane Michael[]
| Category 2 hurricane (SSHWS) | |
  | |
| Duration | October 15 – October 19 |
|---|---|
| Peak intensity | 100 mph (155 km/h) (1-min) 965 mbar (hPa) |
A low-pressure system developed after detaching from a cold front while between Florida and Bermuda. The low-pressure area slowly formed a circulation and began to deepen on October 14 as it drifted north-northeastward. By October 15, the system developed into a subtropical depression while centered about midway between Florida and Bermuda. Later that day, satellite classifications using the Hebert-Poteat technique indicated that the subtropical depression had strengthened into a subtropical storm, and it was upgraded at 0000 UTC on October 16. Due to SST's in excess of 82 °F (28 °C), the subtropical storm developed persistent convection near the low-level center and it slowly acquired tropical characteristics. By 0000 UTC on October 17, the subtropical storm was re-classified as Tropical Storm Michael.[74] Three hours later, the National Hurricane Center began advisories on Michael, though initially it was erroneously classified as Tropical Depression Seventeen.[75]
Although Michael was predicted to intensify only modestly,[75][76] it rapidly strengthened, and became a hurricane later on October 17.[74] Michael fluctuated slightly in intensity while tracking over an area of decreasing SST's. However, another brief period of rapid intensification occurred due to baroclinic effects, and Michael peaked as a minimal Category 2 hurricane. Shortly thereafter, Michael transitioned into an extratropical cyclone before making landfall near Harbour Breton, Newfoundland.[74] Throughout Newfoundland, Michael and the remnant extratropical cyclone produced high winds, which tore off roofs, ripped off roof shingles, caused sporadic power outages, shattered windows, and uprooted trees in a few communities.[77] Precipitation produced by the storm was light and peaked at 3.77 inches (96 mm) in North Mountain, Nova Scotia. Michael also produced rainfall in Maine[78] and Bermuda.[79] There were no damage figures available, though damage was considered to be relatively light.[74][77]
Tropical Storm Nadine[]
| Tropical storm (SSHWS) | |
  | |
| Duration | October 19 – October 22 |
|---|---|
| Peak intensity | 60 mph (95 km/h) (1-min) 999 mbar (hPa) |
In mid-October, a strong upper-level trough and a tropical wave interacted while located in the central Atlantic. The system moved slowly westward and convection began increasing. By October 19, the system became stationary and developed a surface circulation. Later that day, Tropical Depression Eighteen developed about 690 miles (1,110 km) southeast of Bermuda.[80] Initially, the depression lacked a well-defined center, though a broad circulation was evident.[81] The depression tracked slowly northward and then northeastward around a subtropical ridge and ahead of a cold front. As wind shear decreased, convective activity became better organized on October 20. By 1200 UTC on that day, the depression was upgraded to Tropical Storm Nadine.[80] Although it was strengthening, QuikSCAT suggested that the low-level circulation was falling apart, as it appeared to be merging with the cold front.[82]
At 0000 UTC on October 21, Nadine attained its peak intensity with winds of 60 mph (95 km/h) and a minimum barometric pressure of 999 mbar (29.5 inHg).[80] Around the time of peak intensity, a possible eye-like feature and an impressive outflow were observed on satellite imagery. As a result, the National Hurricane Center noted the possibility, but did not exclusively forecast Nadine to strengthen into a hurricane.[83] However, shortly thereafter, wind shear increased and the storm resembled a frontal wave and appeared to possibly be interacting with the cold front.[84] The cloud pattern then became ragged, while the low-level circulation moved toward the southern edge of the deep convection.[85] By 0000 UTC on October 22, Nadine transitioned into an extratropical cyclone and merged with a frontal low about 18 hours later.[80]
Unnamed Subtropical Storm[]
| Subtropical storm (SSHWS) | |
  | |
| Duration | October 25 – October 29 |
|---|---|
| Peak intensity | 65 mph (100 km/h) (1-min) 976 mbar (hPa) |
On October 25, an extratropical low pressure system formed to the east of the Turks and Caicos Islands. It moved northwestward and gradually intensified, and by 1800 UTC the system transitioned into a subtropical storm. It turned to the north and later to the northeast. A burst of convection near the center allowed the storm to attain peak winds of 65 mph (105 km/h); due to its forward motion, it is possible the surface winds reached as high as 85 mph (137 km/h). An approaching cold front caused the storm to become extratropical on October 29, and later that day a larger extratropical storm absorbed the previously subtropical storm near Nova Scotia.[86]
The Marine Prediction Center issued some marine gale and storm warnings offshore, while the National Weather Service issued gale warnings for coastal North Carolina. It was not designated as a subtropical cyclone operationally. The storm produced tropical storm force winds in portions of Atlantic Canada, although it was associated with the larger extratropical storm at the time. Several ships also recorded tropical storm force winds, one of which recorded peak winds of 53 mph (85 km/h).[86]
Storm names[]
The following names were used for system that attained at least tropical storm intensity within the Atlantic basin in the year 2000.[87] Although this was the same list used for the 1994 Atlantic hurricane season,[88] storms were named Joyce, Leslie, Michael, and Nadine for the first time in 2000.[7] The name Joyce replaced Joan after 1988, but was not used in 1994.[89] Names that were not assigned are marked in gray.
|
Retirement[]
During the meeting in spring of 2001, the World Meteorological Organization retired the name Keith from the list above due to its high impact[90] and replaced with the name Kirk for use in the 2006 Atlantic hurricane season. Although the name Kirk was not used during 2006, instead it was used during the 2012 season. The remaining storm names were re-listed for the 2006 season.[91]
Season effects[]
This is a table of all of the storms that formed in the 2000 Atlantic hurricane season. It includes their duration, names, landfall(s)—denoted by bold location names—damages, and death totals. Deaths in parentheses are additional and indirect (an example of an indirect death would be a traffic accident), but are still related to that storm. Damage and deaths include totals while the storm was extratropical or a wave or low, and all of the damage figures are in 2000 USD.
| Saffir–Simpson scale | ||||||
| TD | TS | C1 | C2 | C3 | C4 | C5 |
| Storm name |
Dates active | Storm category
at peak intensity |
Max 1-min wind mph (km/h) |
Min. press. (mbar) |
Areas affected | Damage (USD) |
Deaths | Refs
| ||
|---|---|---|---|---|---|---|---|---|---|---|
| One | June 7 – 8 | Tropical depression | 30 (45) | 1008 | Mexico, Texas | None | None | |||
| Two | June 23 – 25 | Tropical depression | 35 (55) | 1008 | None | None | None | |||
| Alberto | August 3 – 23 | Category 3 hurricane | 125 (205) | 950 | Senegal, East Coast of the United States, Iceland, Greenland, Jan Mayen | None | None | |||
| Four | August 8 – 11 | Tropical depression | 35 (55) | 1009 | None | None | None | |||
| Beryl | August 13 – 15 | Tropical storm | 50 (85) | 1007 | Mexico, Texas | $27 million | 1 | |||
| Chris | August 17 – 19 | Tropical storm | 40 (65) | 1008 | None | None | None | |||
| Debby | August 19 – 24 | Category 1 hurricane | 85 (140) | 991 | Lesser Antilles, Greater Antilles, Turks and Caicos, Florida | $735 thousand | 0 (1) | |||
| Ernesto | September 1 – 3 | Tropical storm | 40 (65) | 1008 | None | None | None | |||
| Nine | September 8 – 9 | Tropical depression | 35 (55) | 1008 | Gulf Coast of the United States | None | None | |||
| Florence | September 10 – 17 | Category 1 hurricane | 80 (130) | 985 | Bermuda, North Carolina, Newfoundland | None | 0 (3) | |||
| Gordon | September 14 – 21 | Category 1 hurricane | 80 (130) | 981 | Mexico, Southeastern United States, Mid-Atlantic states, New England | $10.8 million | 24 (2) | |||
| Helene | September 15 – 25 | Tropical storm | 70 (110) | 986 | Puerto Rico, Southeastern United States | $16 million | 1 (1) | |||
| Isaac | September 21 – October 1 | Category 4 hurricane | 140 (220) | 943 | Cape Verde, Bermuda, East Coast of the United States, British Isles | None | 1 | |||
| Joyce | September 25 – October 2 | Category 1 hurricane | 90 (150) | 975 | Windward Islands, ABC Islands, Dominican Republic | Unknown | None | |||
| Keith | September 28 – October 6 | Category 4 hurricane | 140 (220) | 939 | Central America, Mexico | $319 million | 62 (6) | |||
| Leslie | October 4 – 7 | Tropical storm | 45 (75) | 1006 | Cuba, Florida, Bermuda, Newfoundland | $950 million | 0 (3) | |||
| Michael | October 15 – 20 | Category 2 hurricane | 100 (175) | 965 | Bermuda, Maine, Atlantic Canada | Unknown | None | |||
| Nadine | October 19 – 21 | Tropical storm | 60 (95) | 999 | None | None | None | |||
| Unnamed | October 25 – 29 | Subtropical storm | 65 (100) | 976 | New England, Atlantic Canada | Unknown | None | |||
| Season aggregates | ||||||||||
| 19 systems | June 7 – October 29 | 140 (220) | 939 | $1.296 billion | 89 (16) | |||||
See also[]
- 1999–2000 Australian region cyclone season
- 2000–01 Australian region cyclone season
- 2000 North Indian Ocean cyclone season
- 2000 Pacific hurricane season
- 2000 Pacific typhoon season
- 1999–2000 South Pacific cyclone season
- 2000–01 South Pacific cyclone season
- 1999–2000 South-West Indian Ocean cyclone season
- 2000–01 South-West Indian Ocean cyclone season
- List of Atlantic hurricanes
References[]
- ^ Philip J. Klotzbach; William M. Gray (December 8, 2006). Extended Range Forecast of Atlantic Seasonal Hurricane Activity and U.S. Landfall Strike Probability for 2007 (Report). Colorado State University. Archived from the original on December 18, 2006. Retrieved July 1, 2012.
- ^ Background Information: The North Atlantic Hurricane Season. Climate Prediction Center (Report). National Oceanic and Atmospheric Administration. August 8, 2008. Archived from the original on August 26, 2010. Retrieved July 1, 2012.
- ^ William M. Gray; Philip J. Klotzbach; Christopher W. Landsea (April 7, 2000). Extended Range Forecast of Atlantic Seasonal Hurricane Activity and U.S. Landfall Strike Probability for 2000 (Report). Colorado State University. Archived from the original on July 19, 2011. Retrieved August 18, 2010.
- ^ a b NOAA: 2000 Atlantic hurricane outlook. Climate Prediction Center (Report). National Oceanic and Atmospheric Administration. May 10, 2000. Retrieved January 26, 2008.
- ^ a b Paul Choiniere (June 9, 2000). "Hurricane forecast gets worse". The Day. Retrieved July 7, 2012.
- ^ NOAA: 2000 Atlantic hurricane outlook. Climate Prediction Center (Report). National Oceanic and Atmospheric Administration. August 10, 2000. Archived from the original on August 27, 2010. Retrieved August 18, 2010.
- ^ a b c d e f g James L. Franklin; Lixion A. Avila; Jack L. Beven; Miles B. Lawrence; Richard J. Pasch; Stacy R. Stewart (December 2001). Atlantic Hurricane Season of 2000 (PDF). National Hurricane Center (Report). National Oceanic and Atmospheric Administration. Retrieved November 14, 2011.
- ^ a b c d e Stacy R. Stewart (November 14, 2000). Tropical Storm Beryl Tropical Cyclone Report (PDF). National Hurricane Center (Report). National Oceanic and Atmospheric Administration. Retrieved December 1, 2013.
- ^ a b c d Daniel Bitrán Bitrán; Martín Jiménez Espinosa; Héctor Eslava Morales; Marco Antonio Salas Salinas; María Teresa Vázquez Conde; Lucía Guadalupe Matías Ramírez; Krishna Susana Camacho Quintana; Lorena Acosta Colsa (November 2001). Impacto socioeconómico de los principales desastres ocurridos en a la República Mexicana en el año 2000 (PDF) (Report). CENAPRED. Archived from the original (PDF) on February 27, 2008. Retrieved October 30, 2011.
- ^ a b c d e Richard J. Pasch (December 8, 2000). Hurricane Debby Tropical Cyclone Report (PDF). National Hurricane Center (Report). National Oceanic and Atmospheric Administration. Retrieved December 2, 2013.
- ^ "Fairly mild season left damage nonetheless". The Vindicator. Knight Ridder. November 29, 2000. Retrieved July 7, 2012.
- ^ a b c d e f g h i j Gary Padgett (2000). Monthly Global Tropical Cyclone Summary June 2000 (Report). Australia Severe Weather. Retrieved October 20, 2011.
- ^ a b "Atlantic hurricane best track (HURDAT version 2)" (Database). United States National Hurricane Center. May 25, 2020.
- ^ Atlantic basin Comparison of Original and Revised HURDAT. Hurricane Research Division (Report). National Oceanic and Atmospheric Administration. March 2011. Retrieved July 23, 2011.
- ^ David Levinson (August 20, 2008). 2005 Atlantic Ocean Tropical Cyclones. National Climatic Data Center (Report). National Oceanic and Atmospheric Administration. Retrieved July 23, 2011.
- ^ a b Richard J. Pasch (June 13, 2000). Tropical Depression One Tropical Cyclone Report (PDF). National Hurricane Center (Report). National Oceanic and Atmospheric Administration. Retrieved October 20, 2011.
- ^ Lixion A. Avila (June 7, 2000). Tropical Depression One Discussion Number 1. National Hurricane Center (Report). National Oceanic and Atmospheric Administration. Retrieved October 20, 2011.
- ^ Lixion A. Avila; Stacy R. Stewart (June 8, 2000). Tropical Depression One Discussion Number 5. National Hurricane Center (Report). National Oceanic and Atmospheric Administration. Retrieved October 20, 2011.
- ^ Servicio Meteorológico Nacional (July 13, 2000). Depresión Tropical N° 1 (Report) (in Spanish). Centro Nacional de Previsión del Tiempo. Archived from the original on April 26, 2012. Retrieved October 27, 2011.
- ^ a b c Miles B. Lawrence (July 1, 2000). Tropical Depression Two Tropical Cyclone Report (PDF). National Hurricane Center (Report). National Oceanic and Atmospheric Administration. Retrieved December 1, 2013.
- ^ James L. Franklin (June 24, 2000). Tropical Depression Two Discussion Number 1. National Hurricane Center (Report). National Oceanic and Atmospheric Administration. Retrieved December 1, 2013.
- ^ James L. Franklin (June 24, 2000). Tropical Depression Two Discussion Number 2. National Hurricane Center (Report). National Oceanic and Atmospheric Administration. Retrieved December 1, 2013.
- ^ a b Jack L. Beven (December 8, 2000). Hurricane Alberto Tropical Cyclone Report (PDF). National Hurricane Center (Report). National Oceanic and Atmospheric Administration. Retrieved December 1, 2013.
- ^ James L. Franklin (August 31, 2000). Tropical Depression Four Tropical Cyclone Report (PDF). National Hurricane Center (Report). National Oceanic and Atmospheric Administration. Retrieved January 28, 2012.
- ^ Stacy R. Stewart (August 14, 2000). Tropical Depression Five Discussion Number 2. National Hurricane Center (Report). National Oceanic and Atmospheric Administration. Retrieved December 1, 2013.
- ^ David M. Roth (January 27, 2007). Tropical Storm Beryl – August 13–16, 2000 (Report). National Oceanic and Atmospheric Administration. Retrieved December 1, 2013.
- ^ Tom Ross (October 2, 2000). Hurricanes – 2000. National Climatic Data Center (Report). National Oceanic and Atmospheric Administration. Archived from the original on October 24, 2001. Retrieved May 25, 2011.
- ^ a b c d e Lixion A. Avila (September 5, 2000). Tropical Storm Chris Tropical Cyclone Report (PDF). National Hurricane Center (Report). National Oceanic and Atmospheric Administration. Retrieved December 1, 2013.
- ^ James L. Franklin (August 17, 2000). Tropical Depression Six Discussion Number 1. National Hurricane Center (Report). National Oceanic and Atmospheric Administration. Retrieved December 1, 2013.
- ^ Lixion A. Avila (August 18, 2000). Tropical Depression Six Discussion Number 2. National Hurricane Center (Report). National Oceanic and Atmospheric Administration. Retrieved December 1, 2013.
- ^ Stacy R. Stewart (August 18, 2000). Tropical Storm Chris Discussion Number 4. National Hurricane Center (Report). National Oceanic and Atmospheric Administration. Retrieved December 1, 2013.
- ^ Miles B. Lawrence (August 19, 2000). Tropical Depression Chris Discussion Number 6. National Hurricane Center (Report). National Oceanic and Atmospheric Administration. Retrieved December 1, 2013.
- ^ Stacy R. Stewart (August 19, 2000). Tropical Depression Chris Discussion Number 8. National Hurricane Center (Report). National Oceanic and Atmospheric Administration. Retrieved December 1, 2013.
- ^ a b Stephen Greco. Storm Data – August 2000 (PDF). National Hurricane Center (Report). National Oceanic and Atmospheric Administration. Archived from the original (PDF) on December 3, 2013. Retrieved December 2, 2013.
- ^ Puerto Rico faces flooding after Hurricane Debby's drenching rains (Report). ReliefWeb. Agence France-Presse. August 23, 2000. Archived from the original on September 27, 2007. Retrieved July 2, 2012.
- ^ 2000 hurricane damage reports (Report). HurricaneCity.com. Archived from the original on May 18, 2011. Retrieved July 7, 2012.
- ^ a b c d e Miles B. Lawrence (October 16, 2000). Tropical Storm Ernesto Tropical Cyclone Report (PDF). National Hurricane Center (Report). National Oceanic and Atmospheric Administration. Retrieved December 2, 2013.
- ^ Lixion A. Avila (September 2, 2000). Tropical Depression Eight Discussion Number 1. National Hurricane Center (Report). National Oceanic and Atmospheric Administration. Retrieved December 2, 2013.
- ^ Stacy R. Stewart (September 2, 2000). Tropical Storm Ernesto Discussion Number 2. National Hurricane Center (Report). National Oceanic and Atmospheric Administration. Retrieved December 2, 2013.
- ^ Miles B. Lawrence (September 2, 2000). Tropical Storm Ernesto Discussion Number 3. National Hurricane Center (Report). National Oceanic and Atmospheric Administration. Retrieved December 2, 2013.
- ^ Miles B. Lawrence (September 2, 2000). Tropical Storm Ernesto Discussion Number 4. National Hurricane Center (Report). National Oceanic and Atmospheric Administration. Retrieved December 2, 2013.
- ^ Stacy R. Stewart (September 3, 2000). Tropical Storm Ernesto Discussion Number 6. National Hurricane Center (Report). National Oceanic and Atmospheric Administration. Retrieved December 2, 2013.
- ^ a b Jack L. Beven (November 17, 2000). Tropical Depression Nine Tropical Cyclone Report (PDF). National Hurricane Center (Report). National Oceanic and Atmospheric Administration. Retrieved December 2, 2013.
- ^ a b David M. Roth (August 4, 2008). Tropical Depression No. 9 – September 5–10, 2000. Weather Prediction Center (Report). National Oceanic and Atmospheric Administration. Retrieved December 2, 2013.
- ^ Tropical Cyclone Rainfall for the Gulf Coast. Weather Prediction Center (Report). National Oceanic and Atmospheric Administration. 2013. Retrieved December 2, 2013.
- ^ a b James L. Franklin (November 9, 2000). Hurricane Florence Tropical Cyclone Report (PDF). National Hurricane Center (Report). National Oceanic and Atmospheric Administration. Retrieved December 2, 2013.
- ^ a b c d Stacy R. Stewart (May 14, 2001). Hurricane Gordon Tropical Cyclone Report (PDF). National Hurricane Center (Report). National Oceanic and Atmospheric Administration. Retrieved December 2, 2013.
- ^ a b c d e Stephen Greco. Storm Data – September 2000 (PDF). National Hurricane Center (Report). National Oceanic and Atmospheric Administration. Archived from the original (PDF) on December 3, 2013. Retrieved December 2, 2013.
- ^ David M. Roth (August 12, 2006). Tropical Storm Gordon – September 13–21, 2000. Weather Prediction Center (Report). National Oceanic and Atmospheric Administration. Retrieved December 2, 2013.
- ^ "Gordon's aftermath leaves Southeast soggy". CNN. Associated Press. September 19, 2000. Archived from the original on October 6, 2007. Retrieved June 30, 2012.
- ^ a b c d e Eric S. Blake; Lixion A. Avila (October 17, 2000). Tropical Storm Helene Tropical Cyclone Report (PDF). National Hurricane Center (Report). National Oceanic and Atmospheric Administration. Retrieved December 13, 2013.
- ^ P. Pierce (September 26, 2000). Chapter Damage Assessment Summary for Tropical Storm Helene (PDF) (Report). Capital Area Chapter of the American Red Cross. Archived from the original (PDF) on May 15, 2005. Retrieved April 7, 2012.
- ^ David M. Roth (June 15, 2007). Tropical Storm Helene – September 19–24, 2000. Weather Prediction Center (Report). National Oceanic and Atmospheric Administration. Retrieved December 13, 2013.
- ^ Dan Lewerenz (September 24, 2000). "Tropical Depression Helene Makes Way Through state". Spartanburg Herald-Journal. Associated Press. Retrieved April 7, 2012.
- ^ "Remnants of Helene soak the Southeast". Associated Press. September 24, 2000. Retrieved April 7, 2012.
- ^ a b c Richard J. Pasch (December 18, 2000). Hurricane Isaac Tropical Cyclone Report (PDF). National Hurricane Center (Report). National Oceanic and Atmospheric Administration. Retrieved December 13, 2013.
- ^ a b Miles B. Lawrence (November 3, 2000). Hurricane Joyce Tropical Cyclone Report (PDF). National Hurricane Center (Report). National Oceanic and Atmospheric Administration. Retrieved December 13, 2013.
- ^ Climatological Summary 2000 (PDF) (Report). Meteorological Service of the Netherlands Antilles and Aruba. February 2001. Archived from the original (PDF) on October 26, 2005. Retrieved October 24, 2011.
- ^ "2000 Hurricane Season" (DOC). World Meteorological Organization.
- ^ a b c d e f g Jack L. Beven (January 29, 2001). Hurricane Keith Tropical Cyclone Report (PDF). National Hurricane Center (Report). National Oceanic and Atmospheric Administration. Retrieved December 13, 2013.
- ^ a b "Hurricane Keith batters Belize". BBC. BBC. October 3, 2000. Archived from the original on February 17, 2014. Retrieved November 27, 2011.
- ^ a b c d "Sluggish Hurricane Keith swamps Central America with rain". CNN. Associated Press. October 2, 2000. Archived from the original on June 15, 2007. Retrieved December 16, 2007.
- ^ "Floods in Nicaragua, 3 October 2000, at 0600 hrs". Pan American Health Organization. PAHO. October 3, 2000. Archived from the original on March 9, 2010. Retrieved November 27, 2011.
- ^ a b c Jay H. Lawrimore; Michael S. Halpert; Gerald D. Bell; Matthew J. Menne; Bradfield Lyon; Russell C. Schnell; Karin L. Gleason; David R. Easterling; Wasila Thiaw; William J. Wright; Richard R. Heim Jr.; David A. Robinson; Lisa Alexander (June 2001). "Climate Assessment for 2000". Bulletin of the American Meteorological Society. 82 (6): 1304. Bibcode:2001BAMS...82.1304L. doi:10.1175/1520-0477(2001)082<1304:CAF>2.3.CO;2.
- ^ David M. Roth (January 21, 2007). Hurricane Keith – October 1–8, 2000. Weather Prediction Center (Report). National Oceanic and Atmospheric Administration. Retrieved December 13, 2013.
- ^ a b Daniel P. Brown; James L. Franklin (November 5, 2000). Tropical Storm Leslie Tropical Cyclone Report (PDF). National Hurricane Center (Report). National Oceanic and Atmospheric Administration. Retrieved December 13, 2013.
- ^ José Rubiera; Maritza Ballester. Temporada ciclónica de 2000 en el Atlántico Norte (Report). Instituto de Meteorologia de la Republica de Cuba. Retrieved July 7, 2012.
- ^ David M. Roth (June 6, 2009). Subtropical Storm Leslie – October 2–6, 2000. Weather Prediction Center (Report). National Oceanic and Atmospheric Administration. Retrieved December 13, 2013.
- ^ Tom Ross (November 15, 2000). Weather Log October 1–10th, 2000. National Climatic Data Center (Report). National Oceanic and Atmospheric Administration. Retrieved July 7, 2012.
- ^ Christina Ward (2000). "Flooding Kills Two in South Florida". American Red Cross. Archived from the original on March 13, 2008. Retrieved July 7, 2012.
- ^ Bob Blankenship (October 5, 2000). "Crawford Seeks Federal Assistance For Dade County Farmers Hit By Flooding". Florida Department of Agriculture. Retrieved July 7, 2012.
- ^ Susan Candiotti (October 4, 2000). "Miami bails out after floods take city by storm". CNN. Archived from the original on February 4, 2007. Retrieved July 5, 2012.
- ^ Peter Bowyer (2000). 2000 Tropical Cyclone Season Summary (Report). Environment Canada. Retrieved July 7, 2012.
- ^ a b c d Stacy R. Stewart (November 20, 2000). Hurricane Michael Tropical Cyclone Report (PDF). National Hurricane Center (Report). National Oceanic and Atmospheric Administration. Retrieved November 5, 2011.
- ^ a b James L. Franklin (October 17, 2000). Tropical Depression Seventeen Discussion Number 1. National Hurricane Center (Report). National Oceanic and Atmospheric Administration. Retrieved November 5, 2011.
- ^ Stacy R. Stewart (October 17, 2000). Tropical Storm Michael Discussion Number 2. National Hurricane Center (Report). National Oceanic and Atmospheric Administration. Retrieved November 5, 2011.
- ^ a b 2000-Michael (Report). Environment Canada. September 14, 2010. Retrieved November 5, 2011.
- ^ David M. Roth (September 20, 2006). Ex-Hurricane Michael October 18–21, 2000. Weather Prediction Center (Report). National Oceanic and Atmospheric Administration. Retrieved November 5, 2011.
- ^ Weather Summary for October 2000 (Report). Bermuda Weather Service. November 13, 2000. Archived from the original on October 25, 2005. Retrieved November 5, 2011.
- ^ a b c d Lixion A. Avila (November 15, 2000). Tropical Storm Nadine Tropical Cyclone Report (PDF). National Hurricane Center (Report). National Oceanic and Atmospheric Administration. Retrieved October 20, 2011.
- ^ Lixion A. Avila (October 19, 2000). Tropical Depression Eighteen Discussion Number 1. National Hurricane Center (Report). National Oceanic and Atmospheric Administration. Retrieved June 30, 2012.
- ^ Miles B. Lawrence (October 20, 2000). Tropical Storm Nadine Discussion Number 5. National Hurricane Center (Report). National Oceanic and Atmospheric Administration. Retrieved June 30, 2012.
- ^ Stacy R. Stewart (October 21, 2000). Tropical Storm Nadine Discussion Number 6. National Hurricane Center (Report). National Oceanic and Atmospheric Administration. Retrieved June 30, 2012.
- ^ Miles B. Lawrence (October 21, 2000). Tropical Storm Nadine Discussion Number 7. National Hurricane Center (Report). National Oceanic and Atmospheric Administration. Retrieved June 30, 2012.
- ^ Richard J. Pasch (October 21, 2000). Tropical Storm Nadine Discussion Number 8. National Hurricane Center (Report). National Oceanic and Atmospheric Administration. Retrieved June 30, 2012.
- ^ a b Jack L. Beven (November 27, 2000). Subtropical Storm Tropical Cyclone Report (PDF). National Hurricane Center (Report). National Oceanic and Atmospheric Administration. Retrieved December 19, 2009.
- ^ Jack L. Beven (March 17, 1997). Worldwide Tropical Cyclone Names 1996–2001. National Hurricane Center (Report). National Oceanic and Atmospheric Administration. Archived from the original on April 27, 1997. Retrieved July 7, 2012.
- ^ "Hurricane Facts". Sarasota Herald-Tribune. September 29, 1994. Retrieved July 7, 2012.
- ^ Avila, Lixion; Rappaport, Edward (July 1996). Atlantic hurricane season of 1994 (PDF). National Hurricane Center (Report). National Oceanic and Atmospheric Administration. Retrieved July 7, 2012.
- ^ Tropical Cyclone Naming History and Retired Names. National Hurricane Center (Report). National Oceanic and Atmospheric Administration. April 13, 2012. Retrieved July 7, 2012.
- ^ Worldwide Tropical Cyclone Names. National Hurricane Center (Report). National Oceanic and Atmospheric Administration. July 20, 2006. Archived from the original on December 29, 2006. Retrieved July 7, 2012.
External links[]
| Wikimedia Commons has media related to 2000 Atlantic hurricane season. |

- 2000 Atlantic hurricane season
- Atlantic hurricane seasons
- Tropical cyclones in 2000