2000–01 South Pacific cyclone season
| 2000–01 South Pacific cyclone season | |
|---|---|
 Season summary map | |
| Seasonal boundaries | |
| First system formed | December 11, 2000 |
| Last system dissipated | May 9, 2001 |
| Strongest storm | |
| Name | Paula |
| • Maximum winds | 175 km/h (110 mph) (10-minute sustained) |
| • Lowest pressure | 930 hPa (mbar) |
| Seasonal statistics | |
| Total disturbances | 16 |
| Total depressions | 11 |
| Tropical cyclones | 4 |
| Severe tropical cyclones | 1 |
| Total fatalities | 7 total |
| Total damage | $800,000 (2001 USD) |
| Related articles | |
The 2000–01 South Pacific cyclone season was an event in the annual cycle of tropical cyclone formation. It began on November 1, 2000 and ended on April 30, 2001. These dates conventionally delimit the period of each year when most tropical cyclones form in the southern Pacific Ocean east of 160°E. Additionally, the regional tropical cyclone operational plan defines a tropical cyclone year separately from a tropical cyclone season, and the "tropical cyclone year" runs from July 1, 2000 to June 30, 2001.[1]
Tropical cyclones between 160°E and 120°W and north of 25°S are monitored by the Fiji Meteorological Service in Nadi. Those that move south of 25°S are monitored by the Tropical Cyclone Warning Centre in Wellington, New Zealand.[1]
Seasonal summary[]

During the 2000–01 South Pacific cyclone season, only four tropical cyclones and one severe tropical cyclone formed. Compared to an average season, which generally features nine tropical cyclones and four to five severe tropical cyclones, the 2000–01 season was substantially below average. The season itself began unusually late, with the first system developing on February 20;[2] however, according to the JTWC, a brief tropical storm existed between February 16 and 18.
Systems[]
Tropical Depression 01F[]
| Tropical depression (Australian scale) | |
  | |
| Duration | December 11 – December 15 |
|---|---|
| Peak intensity | 65 km/h (40 mph) (10-min) 993 hPa (mbar) |
Two people were killed in Fiji as a result of severe flooding.
Tropical Depression 07F[]
| Tropical depression (Australian scale) | |
| Tropical storm (SSHWS) | |
  | |
| Duration | February 16 (entered basin) – February 18 |
|---|---|
| Peak intensity | 55 km/h (35 mph) (10-min) 993 hPa (mbar) |
A brief tropical storm was monitored by the Joint Typhoon Warning Center just off the northern coast of New Caledonia.
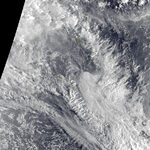
Tropical Cyclone Oma[]
| Category 2 tropical cyclone (Australian scale) | |
| Tropical storm (SSHWS) | |
  | |
| Duration | February 20 – February 22 |
|---|---|
| Peak intensity | 95 km/h (60 mph) (10-min) 984 hPa (mbar) |
Cyclone Oma formed on February 20, dissipated on February 22.
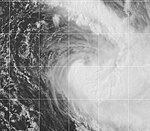
Severe Tropical Cyclone Paula[]
| Category 4 severe tropical cyclone (Australian scale) | |
| Category 3 tropical cyclone (SSHWS) | |
  | |
| Duration | February 26 – March 4 |
|---|---|
| Peak intensity | 175 km/h (110 mph) (10-min) 930 hPa (mbar) |
Formed on February 26, dissipated on March 4.
Three people were killed by the storm, two in Vanuatu and one in Fiji.[3][4] On Vanuatu, sustained winds reached 100 km/h (62 mph) and gusts were estimated at 200 km/h (120 mph). Initial reports indicated that a young boy had been swept away near Santo and was presumed dead.[5] However, the boy was found days later clinging to a rock. The two fatalities in the country resulted from fallen tree limbs on the islands of Epi and Ambae.[4] Following an aerial assessment of damage in Vanuatu, Malampa and Shefa provinces in were declared disaster areas. In these provinces, nearly 50% of all homes sustained damage and upwards of a quarter of all buildings were impacted. In Fiji, damage from Paula was much less than initially feared; however, several homes in the Western Division were destroyed by rough seas produced by the storm. Elsewhere, structural damage was minimal and a few landslides resulted in damage to crops. Throughout the country, preliminary estimates placed the damage at US$800,000.[6]
Following the storm, requests for assistance from the French government were made by Vanuatu. By March 5, a package of relief supplies, consisting of blankets, water purifiers and clothes was brought to the storm-battered nation.[7]
Tropical Cyclone Rita[]
| Category 1 tropical cyclone (Australian scale) | |
| Tropical storm (SSHWS) | |
  | |
| Duration | February 27 – March 5 |
|---|---|
| Peak intensity | 85 km/h (50 mph) (10-min) 986 hPa (mbar) |
On February 27, RSMC Nadi reported that Tropical Disturbance had developed within the South Pacific Convergence Zone to the southeast of the French Polynesian island about 705 mi (1135 km) to the southeast of Papeete.
Tropical Depression 11F[]
| Tropical depression (Australian scale) | |
| | |
| Duration | March 1 – March 3 |
|---|---|
| Peak intensity | Winds not specified |
This depression existed from March 1 to March 3.
Tropical Depression 12F[]
| Tropical depression (Australian scale) | |
| | |
| Duration | March 1 – March 3 |
|---|---|
| Peak intensity | Winds not specified |
This depression existed from March 1 to March 3.
Tropical Cyclone Sose[]
| Category 2 tropical cyclone (Australian scale) | |
| Category 1 tropical cyclone (SSHWS) | |
  | |
| Duration | April 5 – April 11 |
|---|---|
| Peak intensity | 110 km/h (70 mph) (10-min) 975 hPa (mbar) |
Formed on April 5, dissipated on April 11.
Tropical Depression 14F[]
| Tropical depression (Australian scale) | |
| | |
| Duration | May 1 – May 3 |
|---|---|
| Peak intensity | 75 km/h (45 mph) (10-min) 1004 hPa (mbar) |
Hybrid system
Other systems[]
The following weak tropical disturbances/depressions were also monitored by RSMC Nadi, however these systems were either short lived or did not develop significantly. On December 18, RSMC Nadi started to monitor Tropical Depression 03F, to the southeast of Tahiti in French Polynesia.
On May 7, Depression 15F developed about 475 km (295 mi) to the west of Papeete on the French Polynesian island of Tahiti.[8] Over the next couple of days the depression moved south-eastwards, before the final advisory was issued by RSMC Nadi on May 9.[8]
Season effects[]
This table lists all the storms that developed in the South Pacific to the east of longitude 160°E during the 2001–2002 season. It includes their intensity on the Australian Tropical cyclone intensity scale, duration, name, landfalls, deaths, and damages. All data is taken from RSMC Nadi and or TCWC Wellington. The Damage figures are all 2002 USD.
| Name | Dates active | Peak classification | Sustained wind speeds |
Pressure | Areas affected | Damage (USD) |
Deaths | Refs |
|---|---|---|---|---|---|---|---|---|
| 01F | December 11–15 | Tropical Depression | 998 hPa (29.47 inHg) | Fiji | ||||
| 03F | December 18–19 | Tropical Depression | 65 km/h (40 mph) | 995 hPa (29.38 inHg) | ||||
| 07F | February 16–18 | Tropical depression | 65 km/h (40 mph) | 995 hPa (29.38 inHg) | ||||
| Oma | February 20–22 | Category 2 tropical cyclone | 95 km/h (60 mph) | 984 hPa (29.06 inHg) | Cook Islands | Minor | None | |
| Paula | February 26 – March 4 | Category 4 severe tropical cyclone | 175 km/h (110 mph) | 930 hPa (27.46 inHg) | Solomon Islands, Vanuatu, Fiji, Tonga | 1.39 million | 2 | |
| Rita | February 27 – March 5 | Category 1 tropical cyclone | 85 km/h (50 mph) | 986 hPa (29.12 inHg) | ||||
| 11F | March 1–3 | Tropical disturbance | ||||||
| 12F | March 1–3 | Tropical depression | ||||||
| 13F | March 10 | Tropical depression | ||||||
| Sose | April 5–11 | Category 2 tropical cyclone | 110 km/h (70 mph) | 975 hPa (28.79 inHg) | Vanuatu, New Caledonia, Australia | 4 | [9] | |
| 14F | May 1–3 | Tropical depression | 75 km/h (45 mph) | 1,004 hPa (29.65 inHg) | ||||
| 15F | May 7–9 | Tropical depression | 65 km/h (40 mph) | 999 hPa (29.50 inHg) | ||||
| Season aggregates | ||||||||
| 15 systems | December 11 – May 9 | 175 km/h (110 mph) | 930 hPa (27.46 inHg) | 6 | ||||
See also[]
- List of Southern Hemisphere tropical cyclone seasons
- Atlantic hurricane seasons: 2000, 2001
- Pacific hurricane seasons: 2000, 2001
- Pacific typhoon seasons: 2000, 2001
- North Indian Ocean cyclone seasons: 2000, 2001
References[]
- ^ a b "Archived copy" (PDF). Archived from the original (PDF) on 2005-03-01. Retrieved 2010-12-07.
{{cite web}}: CS1 maint: archived copy as title (link) - ^ L.-C. Chappel and P.W. Bate (2003). "The South Pacific and southeast Indian Ocean tropical cyclone season 2000-01" (PDF). Australian Bureau of Meteorology. Archived from the original (PDF) on March 21, 2012. Retrieved November 3, 2010.
- ^ "International Disaster Database: Disaster List". Centre for Research on the Epidemiology of Disasters. 2022. Archived from the original on 23 September 2010. Retrieved October 31, 2010.
- ^ a b Karen Hales (2001). "Cyclone Paula Diary..." Vanuatu.com. Archived from the original on 2012-03-14. Retrieved November 3, 2010.
- ^ United Nations Office for the Coordination of Humanitarian Affairs (March 1, 2001). "Vanuatu and Fiji Islands — Tropical Cyclone Paula OCHA Situation Report No. 1". ReliefWeb. Retrieved November 3, 2010.
- ^ United Nations Office for the Coordination of Humanitarian Affairs (March 6, 2001). "Vanuatu and Fiji Islands — Tropical Cyclone Paula OCHA Situation Report No. 2". ReliefWeb. Retrieved November 3, 2010.
- ^ "France delivers cyclone relief supplies". BBC. March 5, 2001.
- ^ a b Padgett, Gary. "Monthly Global Tropical Cyclone Summary: May 2001". Retrieved May 5, 2012.
- ^ Chappel L,C.; Bate, P.W. (2003-03-01). "The South Pacific and southeast Indian Ocean tropical cyclone season 2000–01" (PDF). Australian Meteorological Magazine. Australian Bureau of Meteorology (52): 33–47. Archived from the original (PDF) on 2012-03-21. Retrieved 2012-04-23.
External links[]

- 2000–01 South Pacific cyclone season
- South Pacific cyclone seasons
- Tropical cyclones in 2000
- Tropical cyclones in 2001