2000 Pacific typhoon season
| 2000 Pacific typhoon season | |
|---|---|
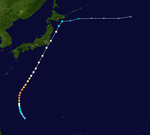
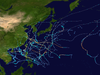
 Season summary map | |
| Seasonal boundaries | |
| First system formed | February 7, 2000 |
| Last system dissipated | January 4, 2001 |
| Strongest storm | |
| Name | Bilis |
| • Maximum winds | 205 km/h (125 mph) (10-minute sustained) |
| • Lowest pressure | 920 hPa (mbar) |
| Seasonal statistics | |
| Total depressions | 51 |
| Total storms | 23 |
| Typhoons | 13 |
| Super typhoons | 4 (unofficial) |
| Total fatalities | 467 total |
| Total damage | > $13.12 billion (2000 USD) |
| Related articles | |
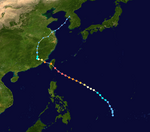
The 2000 Pacific typhoon season marked the first year using names contributed by the World Meteorological Organization. It was a rather below-average season, producing a total of 23 tropical storms, 13 typhoons and 4 intense typhoons. The season ran throughout 2000, though typically most tropical cyclones develop between May and October. The season's first named storm, Damrey, developed on May 7, while the season's last named storm, Soulik, dissipated on January 4 of the next year.
The scope of this article is limited to the Pacific Ocean to the north of the equator between 100°E and the 180th meridian. Within the northwestern Pacific Ocean, there are two separate agencies that assign names to tropical cyclones, which often results in a storm having two names. The Japan Meteorological Agency (JMA) will name a tropical cyclone should it be judged to have 10-minute sustained wind speeds of at least 65 km/h (40 mph) anywhere in the basin, whilst the Philippine Atmospheric, Geophysical and Astronomical Services Administration (PAGASA) assigns names to tropical cyclones which move into or form as tropical depressions in their area of responsibility, located between 115°E and 135°E and between 5°N and 25°N, regardless of whether or not the tropical cyclone has already been given a name by the JMA. Tropical depressions monitored by the United States' Joint Typhoon Warning Center (JTWC) are given a number with a "W" suffix.
Seasonal summary[]

Systems[]
Typhoon Damrey (Asiang)[]
| Typhoon (JMA) | |
| Category 5 super typhoon (SSHWS) | |
  | |
| Duration | May 4 – May 12 |
|---|---|
| Peak intensity | 165 km/h (105 mph) (10-min) 930 hPa (mbar) |
The first storm of the season started out as a tropical low near Palau on May 3, when the JTWC first gave the system a poor chance of formation. However within the next few hours the low quickly organized, and the next day the JMA recognized the low as a depression. Operationally it wasn't until May 5 that the JTWC issued its first warning for the newly formed depression. Drifting northwest the depression gradually organized into a tropical storm on May 6. It was given the name Asiang on May 6 by PAGASA[1] and Damrey on May 7 by the JMA, respectively. At this time a weakening sub-tropical ridge was moving northward causing Damrey to move in a northeasterly direction. Damrey became a typhoon early on May 8 and soon thereafter satellite images began to show an eye forming at the center. During the next 24 hours Damrey quite steadily intensified, reaching winds of 130 mph (215 km/h) by May 9. The system became very symmetrical and small, allowing the typhoon to reach a peak intensity of 180 mph (290 km/h) and gusts as high as 220 mph late on May 9. The JTWC unofficially estimated a pressure of 878 mbar, which would make it one of the strongest tropical cyclones ever. Due to the compact structure of the typhoon it would only take twenty-four hours of high vertical wind shear, from a nearby high pressure, to reduce Damrey to a tropical storm. The convection continue to decrease around the LLCC and the system picked up in forward momentum under deteriorating environment.[2] By May 12 Damrey became fully extra-tropical and eventually dissipated on May 16.[3]
Damrey was the strongest May typhoon since Typhoon Phyllis in 1958 but Phyllis had higher wind speeds of 295 km/h (185 mph). Damrey had no significant effects on land in its life.
Tropical Storm Longwang (Biring)[]
| Tropical storm (JMA) | |
| Tropical storm (SSHWS) | |
  | |
| Duration | May 17 – May 20 |
|---|---|
| Peak intensity | 85 km/h (50 mph) (10-min) 990 hPa (mbar) |
On May 15, a monsoonal trough associated with a low pressure area formed north west of the Philippines. On May 17 the low pressure area started to drift across the northern Philippines, and rapidly intensified into a tropical storm before quickly dissipating due to vertical wind shear on May 20. The remnants were soon absorbed by a non-tropical low on May 22.
Tropical Depression 03W (Konsing)[]
| Tropical depression (PAGASA) | |
| Tropical depression (SSHWS) | |
  | |
| Duration | May 20 – May 22 |
|---|---|
| Peak intensity | 55 km/h (35 mph) (10-min) 1002 hPa (mbar) |
On May 20, a low pressure area formed south of Hong Kong and drifted east towards the Philippines. On May 21 the low pressure area rapidly organized and strengthened into a tropical depression. However it quickly dissipated due to vertical wind shear.
Tropical Depression 04W[]
| Tropical depression (JMA) | |
| Tropical depression (SSHWS) | |
  | |
| Duration | May 30 – June 1 |
|---|---|
| Peak intensity | 55 km/h (35 mph) (10-min) 1002 hPa (mbar) |
Unnamed tropical depression[]
| Tropical depression (JMA) | |
  | |
| Duration | June 18 – June 18 |
|---|---|
| Peak intensity | 55 km/h (35 mph) (10-min) 1002 hPa (mbar) |
A vortex in an active trough over the South China Sea developed into a midget tropical depression on June 18, 35 km south-southwest of Hong Kong. It moved northward and made landfall that day, with its very small circulation being well captured by the Observatory's network of automatic weather stations. The depression brought light rain to Hong Kong and strong winds. Although this tropical depression was widely recognised by Asian agencies, there are still disputes on the nature of this system. It had an unusually small size and formed surprisingly close to land.[4]
Typhoon Kirogi (Ditang)[]
| Typhoon (JMA) | |
| Category 4 typhoon (SSHWS) | |
  | |
| Duration | July 2 – July 8 |
|---|---|
| Peak intensity | 155 km/h (100 mph) (10-min) 940 hPa (mbar) |
On June 30, an area of disturbed weather was identified roughly 650 km (405 mi) east of the Philippine island of Mindanao. This system gradually organized as it remained stationary, prompting the JTWC to issue a TCFA the following day. The JMA and JTWC began monitoring the disturbance as a tropical depression early on July 2, with the former classifying it as 05W. Several hours later, PAGASA also issued their first advisory on the depression, giving it the local name Ditang. Tracking northward, the system intensified into a tropical storm, at which time it received the name Kirogi, before undergoing rapid intensification late on July 3. Following this phase, the storm attained typhoon intensity and developed a well-defined 59 km (37 mi) wide symmetrical eye. Typhoon Kirogi attained its peak intensity early on July 4 with winds of 155 km/h (100 mph 10-minute sustained) and a barometric pressure of 940 mbar (hPa; 27.76 inHg).
In Japan, hundreds of residents were evacuated as Typhoon Kirogi approached the country. Since the storm weakened considerably from its peak intensity, damage was much less than initially anticipated. In all, damages from the storm amounted to 15 billion yen (2000 value, $140 million USD) and 3 confirmed fatalities.[5][6]
Typhoon Kai-tak (Edeng)[]
| Typhoon (JMA) | |
| Category 1 typhoon (SSHWS) | |
  | |
| Duration | July 3 – July 10 |
|---|---|
| Peak intensity | 140 km/h (85 mph) (10-min) 960 hPa (mbar) |
On July 2, a low pressure area formed north west of the Philippines and became a tropical depression on July 3 and started to drift northward, becoming a storm on the 5th and a typhoon on the 6th. Kai-tak continued northward, hitting Taiwan on the 9th. Kai-tak dissipated on the 11th over the Yellow Sea. It was named after Hong Kong's old international airport, Kai Tak Airport.
The combined effects of Kai-tak and Tropical Depression Gloring led to the collapse of a large garbage pile, devastating a scavenger community with 300 shanty homes near Manila. At least 116 people died in the avalanche—some of whom were decapitated by machinery—and at least 73 others were injured.[7]
Tropical Depression 07W (Gloring)[]
| Tropical depression (PAGASA) | |
| Tropical depression (SSHWS) | |
  | |
| Duration | July 11 – July 13 |
|---|---|
| Peak intensity | 55 km/h (35 mph) (10-min) 1000 hPa (mbar) |
Clouds from TD Gloring (07W) affected Northern Luzon, Central Luzon, Southern Luzon, Bicol Region, and Parts of Visayas, but no damage or casualties were reported.
Tropical Depression 08W[]
| Tropical depression (HKO) | |
| Tropical depression (SSHWS) | |
  | |
| Duration | July 15 – July 17 |
|---|---|
| Peak intensity | 45 km/h (30 mph) (10-min) 996 hPa (mbar) |
On July 13 an area of low pressure formed over Luzon and moved north west, and strengthened into a tropical depression on July 14.Tropical Depression 08w made landfall over Yangjiang, Guangdong, China on July 17 and dissipated inland.
Tropical Storm Tembin[]
| Tropical storm (JMA) | |
| Tropical storm (SSHWS) | |
  | |
| Duration | July 17 – July 23 |
|---|---|
| Peak intensity | 75 km/h (45 mph) (10-min) 992 hPa (mbar) |
On July 13 a cluster of thunderclouds grouped together to form a low pressure area. On July 14 it started to organize and slowly became a tropical depression on July 19, and quickly intensified into a tropical storm. On July 22 convection was displaced to south of the storm's center due to high wind shear, and caused it to dissipate.
Tropical Depression 10W[]
| Tropical depression (SSHWS) | |
  | |
| Duration | July 20 – July 22 |
|---|---|
| Peak intensity | 45 km/h (30 mph) (1-min) 1000 hPa (mbar) |
JTWC treated 10W and 11W as separate depressions, although PAGASA and JMA both considered them the same system. On July 25, 11W became Severe Tropical Storm Bolaven.
Severe Tropical Storm Bolaven (Huaning)[]
| Severe tropical storm (JMA) | |
| Tropical storm (SSHWS) | |
  | |
| Duration | July 24 – July 31 |
|---|---|
| Peak intensity | 95 km/h (60 mph) (10-min) 980 hPa (mbar) |
On July 17, a disturbance with a large area of rotation formed south east of the Philippines.On July 24, favorable conditions allow the disturbance to quickly organize so it became a tropical depression the next day.
Damage of the flooding brought by the extratropical remnants of Bolaven in Primorsky Krai exceeded 600 million rubles ($21.6 million, 2000 USD).[8]
Tropical Storm Chanchu[]
| Tropical storm (JMA) | |
| Tropical storm (SSHWS) | |
  | |
| Duration | July 27 – July 30 |
|---|---|
| Peak intensity | 65 km/h (40 mph) (10-min) 996 hPa (mbar) |
The remnants of Tropical Storm Upana encountered a favorable environment just west of the dateline, and they formed Tropical Depression 12W. The depression strengthened into Tropical Storm Chanchu. The name Chanchu, submitted by Macau, is a Chinese word for pearl. Chanchu moved north, and had dissipated by July 30.
Meteorologist Gary Padgett suggested that there was good evidence Chanchu was actually a regeneration of Upana. The official policy is that dateline crossers keep their name. However, there was supposedly some doubt at the time, so Chanchu and Upana were officially treated as distinct tropical cyclones. Also, since Upana had dissipated several days earlier, and the Joint Typhoon Warning Center had already assigned a new number for the system, Gary Padgett deemed it likely that the Japan Meteorological Agency's decision to rename the cyclone was the best choice. Also, a scatterometer pass near 0500 UTC on July 23 indicated an open wave with no closed circulation,[9] evidence that Upana had fully dissipated before restrengthening.
Typhoon Jelawat[]
| Typhoon (JMA) | |
| Category 4 typhoon (SSHWS) | |
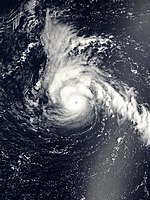  | |
| Duration | July 31 – August 12 |
|---|---|
| Peak intensity | 155 km/h (100 mph) (10-min) 940 hPa (mbar) |
On July 29, a cluster of thunderstorms quickly formed into a low pressure area, which became Tropical Depression 12W on August 1. Favorable conditions allowed the system to rapidly intensify, and it was named Jelawat. On August 2, it reached its peak intensity as a Category 4 typhoon. On August 3, Jelawat weakened into a category 2 typhoon due to unfavorable wind shear. On August 6, Jelawat restrengthened into a category 3 typhoon due to more favorable conditions, and started to develop a large eye which was 60 kilometers across. Weak steering winds soon caused Jelawat to move slowly from August 7 to August 8. On August 7, Jelawat underwent an eyewall replacement cycle for 4 hours, and began to display annular characteristics, with a large, symmetric eye 170 kilometers across surrounded by a thick ring of intense convection. After developing a large, symmetric eye, Jelawat restrengthened from a category 1 typhoon to a category 2 typhoon, but soon weakened back to a category 1 typhoon as it encountered wind shear. It made landfall at southern Shanghai and rapidly weakened.
Tropical Depression 14W[]
| Tropical depression (SSHWS) | |
  | |
| Duration | August 7 – August 10 |
|---|---|
| Peak intensity | 55 km/h (35 mph) (1-min) 1008 hPa (mbar) |
Tropical Depression 14W developed on August 8. It moved on a parabolic path before dissipating on August 10.
Typhoon Ewiniar[]
| Typhoon (JMA) | |
| Category 1 typhoon (SSHWS) | |
  | |
| Duration | August 9 – August 18 |
|---|---|
| Peak intensity | 120 km/h (75 mph) (10-min) 975 hPa (mbar) |
Typhoon Ewiniar developed on August 9. It strengthened into a typhoon while moving northward. Ewiniar weakened and eventually curved east-northeastward. The typhoon re-intensified, but dissipated on August 18.
Tropical Depression 16W (Wene)[]
| Tropical depression (JMA) | |
| Tropical depression (SSHWS) | |
  | |
| Duration | August 13 – August 15 (Exited basin) |
|---|---|
| Peak intensity | 45 km/h (30 mph) (1-min) 1004 hPa (mbar) |
A tropical disturbance developed in the Western Pacific Ocean along the eastern periphery of the monsoon trough in mid-August. Located at 33° north, it steadily organized, and became Tropical Depression Sixteen-W on August 15 while located 1700 miles to the northwest of Honolulu, Hawaii. It moved eastward along the west- east oriented surface pressure trough, and crossed the International Date Line later on the 15th.[10] Warmer than usual water temperatures allowed the system to intensify despite its unusually high latitude, and it became Tropical Storm Wene on the 16th. It quickly attained a peak intensity of 50 mph, but weakened due to cooler waters and wind shear. Wene continued to weaken, and dissipated when the storm merged with an extratropical cyclone.
As a depression, Wene was the first western Pacific tropical cyclone to cross the dateline since the 1996 season, and the most recent to do so until Tropical Storm Omeka in the 2010 season. The name Wene is Hawaiian for "Wayne".
Tropical Depression 17W[]
| Tropical depression (JMA) | |
| Tropical depression (SSHWS) | |
  | |
| Duration | August 17 – August 18 |
|---|---|
| Peak intensity | 45 km/h (30 mph) (1-min) 1008 hPa (mbar) |
Tropical Depression 17W existed from August 17 to August 18.[11] It did not make landfall and it dissipated quickly. No victims were recorded during the storm's short lifespan.
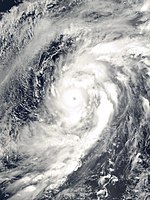
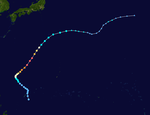
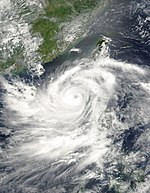
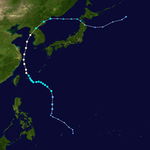
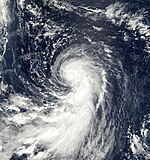
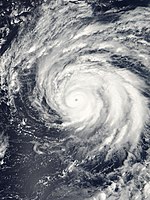
Typhoon Bilis (Isang)[]
| Typhoon (JMA) | |
| Category 5 super typhoon (SSHWS) | |
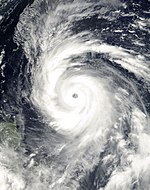  | |
| Duration | August 18 – August 25 |
|---|---|
| Peak intensity | 205 km/h (125 mph) (10-min) 920 hPa (mbar) |
On August 14, a low pressure area formed south of the Mariana islands and started to organize. On August 17 the low pressure area became a tropical depression and as it tracked northwestward, becoming a tropical storm on the 18th and a typhoon on the 19th. Favorable conditions allow Bilis continued to intensify to a super typhoon on the 21st, and it struck the southeastern coast of Taiwan as a Category 5 typhoon on the 22nd. It weakened slightly to a 140 miles per hour (230 km/h) typhoon while crossing the country, and hit China on the 23rd. Significant rainfall fell across Taiwan, with up to 949 millimetres (37.4 in) recorded across northeast sections of the mountainous island.[12] Bilis was responsible for 17 deaths and $133.5 million in damage on Taiwan. The flooding was significant and an unknown number of people drowned in the flooding.
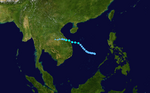
Tropical Storm Kaemi[]
| Tropical storm (JMA) | |
| Tropical storm (SSHWS) | |
  | |
| Duration | August 18 – August 23 |
|---|---|
| Peak intensity | 75 km/h (45 mph) (10-min) 985 hPa (mbar) |
On August 19, a low pressure area formed west of the Philippines. Favorable conditions allow the low pressure area to strengthen into a tropical depression on August 20.Kaemi made landfall over Vietnam on August 21 and it was reported that tropical storm Kaemi killed 14 people in Vietnam.[13]
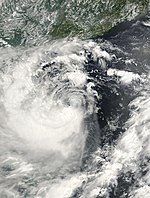
Typhoon Prapiroon (Lusing)[]
| Typhoon (JMA) | |
| Category 1 typhoon (SSHWS) | |
  | |
| Duration | August 25 – September 1 |
|---|---|
| Peak intensity | 130 km/h (80 mph) (10-min) 965 hPa (mbar) |
On August 24 a large area of disturbed weather formed south of the Philippine sea. Prapiroon killed 46 people and caused $6 billion in damages in Korea, China and the Philippines.
Tropical Storm Maria[]
| Tropical storm (JMA) | |
| Tropical storm (SSHWS) | |
  | |
| Duration | August 27 – September 2 |
|---|---|
| Peak intensity | 75 km/h (45 mph) (10-min) 985 hPa (mbar) |
The origins of Maria appeared to originate from the inland remnants of Typhoon Bilis, which was pulled south due to the Fujiwhara effect between Typhoon Prapiroon. The low pressure area entered the South China Sea as it drifted south over Hong Kong on August 27. As it was pulled south to the South China Sea, it quickly strengthened into a tropical storm on August 30. Maria made landfall on September 1 east of Hong Kong.
Typhoon Saomai (Osang)[]
| Typhoon (JMA) | |
| Category 5 super typhoon (SSHWS) | |
  | |
| Duration | August 31 – September 16 |
|---|---|
| Peak intensity | 175 km/h (110 mph) (10-min) 925 hPa (mbar) |
Typhoon Saomai developed on September 2. It strengthened while heading westward and reached typhoon status. Later in its duration, the typhoon turned northwestward and the PAGASA named it Osang. Eventually, Saomai was classified as a super typhoon, peaking with winds of 175 km/h (110 mph). Thereafter, the typhoon weakened before making landfall in South Korea. It dissipated shortly thereafter.
Tropical Storm Bopha (Ningning)[]
| Tropical storm (JMA) | |
| Tropical storm (SSHWS) | |
  | |
| Duration | September 4 – September 11 |
|---|---|
| Peak intensity | 85 km/h (50 mph) (10-min) 988 hPa (mbar) |
On September 6, a Monsoonal trough quickly spawned an Embedded depression that became a tropical storm on September 9. However, due to the Fujiwhara effect, the much stronger system, Typhoon Saomai dragged Bopha approximately 1,550 kilometers south, and weakened Bopha from September 9–11. The remnants of Bopha continued to move eastwards as it became Severe Tropical Storm Sonamu on September 15.
Typhoon Wukong (Maring)[]
| Typhoon (JMA) | |
| Category 2 typhoon (SSHWS) | |
  | |
| Duration | September 4 – September 10 |
|---|---|
| Peak intensity | 140 km/h (85 mph) (10-min) 955 hPa (mbar) |
Typhoon Wukong developed in the South China Sea on September 6. It was also named Maring by PAGASA. Wukong strengthened into a typhoon prior to landfall in Hainan and northern Vietnam. The storm dissipated on September 10.
Severe Tropical Storm Sonamu[]
| Severe tropical storm (JMA) | |
| Category 1 typhoon (SSHWS) | |
  | |
| Duration | September 14 – September 18 |
|---|---|
| Peak intensity | 100 km/h (65 mph) (10-min) 980 hPa (mbar) |
Severe Tropical Storm Sonamu developed on September 15 from the remnants of Bopha. It headed east-northeastward and then north-northeastward, peaking with winds of 100 km/h (65 mph). By September 18, Sonamu dissipated near Hokkaido.
Typhoon Shanshan[]
| Typhoon (JMA) | |
| Category 4 super typhoon (SSHWS) | |
  | |
| Duration | September 17 – September 24 |
|---|---|
| Peak intensity | 175 km/h (110 mph) (10-min) 925 hPa (mbar) |
On September 14, a low-pressure area formed near the southern Marshall Islands. Favorable conditions allowed the low to strengthen into a tropical depression on September 17, and to intensify into a typhoon early on September 20. Shanshan reached peak intensity on September 21 as a Category 4 super typhoon. Due to the Fujiwhara effect, Shanshan was weakened by an extratropical cyclone located south of Kamchatka Krai, and Shanshan merged with it and collapsed into a single extratropical cyclone.
Tropical Depression 27W[]
| Tropical depression (JMA) | |
| Tropical storm (SSHWS) | |
  | |
| Duration | September 27 – October 2 |
|---|---|
| Peak intensity | 55 km/h (35 mph) (10-min) 1008 hPa (mbar) |
Tropical Storm 27W developed on September 28. It moved northeastward and peaked with winds of 65 km/h (40 mph). The storm eventually weakened and dissipated on September 30.
Tropical Depression 28W[]
| Tropical depression (JMA) | |
| Tropical storm (SSHWS) | |
  | |
| Duration | October 6 – October 13 |
|---|---|
| Peak intensity | 55 km/h (35 mph) (10-min) 998 hPa (mbar) |
Tropical Storm 28W developed on October 6. It meandered through the South China Sea for about a week, dissipating on October 13.
Typhoon Yagi (Paring)[]
| Typhoon (JMA) | |
| Category 3 typhoon (SSHWS) | |
  | |
| Duration | October 21 – October 28 |
|---|---|
| Peak intensity | 130 km/h (80 mph) (10-min) 965 hPa (mbar) |
Typhoon Yagi developed on October 22. It was also named Paring by PAGASA. Peaking as a typhoon with winds of 130 km/h (80 mph), Yagi executed a cyclonic loop near the Ryukyu Islands. It then began weakening and dissipated near Taiwan on October 26.
Typhoon Xangsane (Reming)[]
| Typhoon (JMA) | |
| Category 2 typhoon (SSHWS) | |
  | |
| Duration | October 24 – November 1 |
|---|---|
| Peak intensity | 140 km/h (85 mph) (10-min) 960 hPa (mbar) |
On October 27, Typhoon Xangsane hit southern Luzon of the Philippines. It turned to the north over the South China Sea, and after strengthening to a 100 mph typhoon it hit Taiwan. Xangsane dissipated on Nov. 1st, after causing 181 casualties, 83 of which were from the crash of Singapore Airlines Flight 006 the previous day on October 31, 2000.
Severe Tropical Storm Bebinca (Seniang)[]
| Severe tropical storm (JMA) | |
| Category 2 typhoon (SSHWS) | |
  | |
| Duration | October 30 – November 7 |
|---|---|
| Peak intensity | 110 km/h (70 mph) (10-min) 980 hPa (mbar) |
On November 2, Tropical Storm Bebinca hit the central Philippines. It strengthened to a severe tropical storm and reached a peak of 60 knot winds while crossing the archipelago, due to the contraction of the wind field. Bebinca continued northwestward, eventually dissipating over the South China Sea on the 8th after killing 26 people.[14] Typhoon Bebinca made a direct hit over the capital city of Manila, with the center of the storm passing directly over it. It became the first storm to have made a direct hit in Manila since Severe Tropical Storm Colleen in 1992 when it passed over the city at tropical storm level, and the first typhoon-level storm to pass directly over Manila at that intensity since Typhoon Patsy in 1970.
Tropical Depression 32W[]
| Tropical depression (JMA) | |
| Tropical depression (SSHWS) | |
  | |
| Duration | November 7 – November 8 |
|---|---|
| Peak intensity | 55 km/h (35 mph) (1-min) 1004 hPa (mbar) |
Tropical Depression 32W developed near Luzon on November 8. It turned northward and later east-northeastward. The depression dissipated on November 10.
Tropical Storm Rumbia (Toyang)[]
| Tropical storm (JMA) | |
| Tropical storm (SSHWS) | |
  | |
| Duration | November 27 – December 7 |
|---|---|
| Peak intensity | 75 km/h (45 mph) (10-min) 990 hPa (mbar) |
On November 23, 2000 a low pressure area together with inter-tropical convergence zone developed into a tropical depression. Later that day, JTWC announced that it became a tropical storm. It had maximum of winds of 75 km/h near the center, and a pressure of 990 mbar. It dissipated on December 7, It was very week.
Tropical Depression Ulpiang[]
| Tropical depression (PAGASA) | |
  | |
| Duration | December 6 – December 8 |
|---|---|
| Peak intensity | 55 km/h (35 mph) (10-min) 1003 hPa (mbar) |
Tropical Depression Ulpiang flooded many regions in Visayas, causing landslides that killed 3 people.[15]
Typhoon Soulik (Welpring)[]
| Typhoon (JMA) | |
| Category 3 typhoon (SSHWS) | |
  | |
| Duration | December 29, 2000 – January 4, 2001 |
|---|---|
| Peak intensity | 150 km/h (90 mph) (10-min) 955 hPa (mbar) |
Typhoon Soulik formed to the east of the Philippines on December 28, 2000. It strengthened into a category 3 typhoon with a central pressure of 955 mbar on January 2. It finally dissipated on January 4, 2001.
Storm names[]
Within the North-western Pacific Ocean, both the Japan Meteorological Agency (JMA) and the Philippine Atmospheric, Geophysical and Astronomical Services Administration assign names to tropical cyclones that develop in the Western Pacific, which can result in a tropical cyclone having two names.[16] The Japan Meteorological Agency's RSMC Tokyo — Typhoon Center assigns international names to tropical cyclones on behalf of the World Meteorological Organization's Typhoon Committee, should they be judged to have 10-minute sustained windspeeds of 65 km/h, (40 mph).[17] While the Philippine Atmospheric, Geophysical and Astronomical Services Administration assigns names to tropical cyclones which move into or form as a tropical depression in their area of responsibility located between 135°E and 115°E and between 5°N-25°N even if the cyclone has had an international name assigned to it.[16] The names of significant tropical cyclones are retired, by both PAGASA and the Typhoon Committee.[17] Should the list of names for the Philippine region be exhausted then names will be taken from an auxiliary list of which the first ten are published each season. Unused names are marked in gray.
International names[]
During the season 23 named tropical cyclones developed in the Western Pacific and were named by the Japan Meteorological Agency, when it was determined that they had become tropical storms. These names were contributed to a list of a 140 names submitted by the fourteen members nations and territories of the ESCAP/WMO Typhoon Committee. All of these names were used for the first time this year.
| Damrey | Longwang | Kirogi | Kai-tak | Tembin | Bolaven | Chanchu | Jelawat | Ewiniar | Bilis | Kaemi | Prapiroon |
| Maria | Saomai | Bopha | Wukong | Sonamu | Shanshan | Yagi | Xangsane | Bebinca | Rumbia | Soulik |
Philippines[]
| Asiang | Biring | Konsing | Ditang | Edeng |
| Gloring | Huaning | Isang | Lusing | Maring |
| Ningning | Osang | Paring | Reming | Seniang |
| Toyang | Ulpiang | Welpring | Yerling (unused) | |
| Auxiliary list | ||||
|---|---|---|---|---|
| Aring (unused) | ||||
| Basiang (unused) | Kadiang (unused) | Dorang (unused) | Enang (unused) | Grasing (unused) |
The Philippine Atmospheric, Geophysical and Astronomical Services Administration uses its own naming scheme for tropical cyclones in their area of responsibility. PAGASA assigns names to tropical depressions that form within their area of responsibility and any tropical cyclone that might move into their area of responsibility. Should the list of names for a given year prove to be insufficient, names are taken from an auxiliary list, the first 10 of which are published each year before the season starts. This is the same list used for the 1996 season. This is the last season that the PAGASA uses its own naming scheme that starts in Filipino alphabet, with names of Filipino female names ending with "ng" (A, B, K, D, etc.). The 2001 season is the official start of their new naming scheme that starts with the English Alphabet. Names that were not assigned are marked in gray.
Season effects[]
This table will list all the storms that developed in the northwestern Pacific Ocean west of the International Date Line and north of the equator during 2016. It will include their intensity, duration, name, areas affected, deaths, and damage totals. Classification and intensity values will be based on estimations conducted by the JMA. All damage figures will be in 2016 USD. Damages and deaths from a storm will include when the storm was a precursor wave or an extratropical cyclone.
| Name | Dates active | Peak classification | Sustained wind speeds |
Pressure | Areas affected | Damage (USD) |
Deaths | Refs |
|---|---|---|---|---|---|---|---|---|
| TD | February 7 – 8 | Tropical depression | Not specified | 1004 hPa (29.65 inHg) | Mariana Islands | None | None | |
| Damrey (Asiang) | May 5 – 12 | Typhoon | 165 km/h (105 mph) | 930 hPa (27.46 inHg) | Caroline Islands | None | None | |
| Longwang (Biring) | May 17 – 20 | Tropical storm | 85 km/h (50 mph) | 990 hPa (29.23 inHg) | Philippines, Ryukyu Islands | None | None | |
| TD | May 17 – 18 | Tropical depression | Not specified | 1000 hPa (29.53 inHg) | None | None | None | |
| 03W (Konsing) | May 20 – 21 | Tropical depression | 55 km/h (35 mph) | 1002 hPa (29.59 inHg) | Philippines, Taiwan | None | None | |
| 04W | May 30 – June 1 | Tropical depression | 55 km/h (35 mph) | 1002 hPa (29.59 inHg) | Vietnam | None | None | |
| TD | June 18 | Tropical depression | Not specified | 1002 hPa (29.59 inHg) | South China | None | None | |
| Kirogi (Ditang) | July 2 – 8 | Typhoon | 155 km/h (100 mph) | 940 hPa (27.76 inHg) | Japan | $140 million | 5 | |
| Kai-tak (Edeng) | July 3 – 10 | Typhoon | 140 km/h (85 mph) | 960 hPa (28.35 inHg) | Philippines, Taiwan, East China, Korea | Unknown | 16 | |
| 07W (Gloring) | July 11 – 13 | Tropical depression | 55 km/h (35 mph) | 1000 hPa (29.53 inHg) | Philippines | None | None | |
| TD | July 11 | Tropical depression | Not specified | 1000 hPa (29.53 inHg) | South China | None | None | |
| 08W | July 15 – 17 | Tropical depression | 55 km/h (35 mph) | 996 hPa (29.41 inHg) | South China | None | None | |
| Tembin | July 17 – 23 | Tropical storm | 75 km/h (45 mph) | 992 hPa (29.29 inHg) | None | None | None | |
| TD | July 21 | Tropical depression | Not specified | 1004 hPa (29.65 inHg) | South China, Vietnam | None | None | |
| 10W | July 20 – 22 | Tropical depression | 45 km/h (30 mph) | 1000 hPa (29.53 inHg) | Philippines | None | None | |
| Bolaven (Huaning) | July 24 – 31 | Severe tropical storm | 95 km/h (60 mph) | 980 hPa (28.94 inHg) | Philippines, Ryukyu Islands, Japan, Korea, Russian Far East | $21.6 million | None | |
| Chanchu | July 27 – 30 | Tropical storm | 65 km/h (40 mph) | 996 hPa (29.41 inHg) | None | None | None | |
| Jelawat | July 31 – August 12 | Typhoon | 155 km/h (100 mph) | 940 hPa (27.76 inHg) | Ryukyu Islands, East China | Unknown | None | |
| TD | August 1 – 3 | Tropical depression | Not specified | 1004 hPa (29.65 inHg) | Ryukyu Islands, Japan, Korea | None | None | |
| 14W | August 7 – 10 | Tropical depression | 55 km/h (35 mph) | 1008 hPa (29.77 inHg) | None | None | None | |
| Ewiniar | August 9 – August 18 | Typhoon | 120 km/h (75 mph) | 975 hPa (27.76 inHg) | Mariana Islands | None | None | |
| TD | August 11 | Tropical depression | Not specified | 1004 hPa (29.65 inHg) | None | None | None | |
| 16W (Wene) | August 13 – 15 | Tropical depression | 55 km/h (35 mph) | 1008 hPa (29.77 inHg) | None | None | None | |
| 17W | August 16 – 18 | Tropical depression | 55 km/h (35 mph) | 1008 hPa (29.77 inHg) | None | None | None | |
| Bilis (Isang) | August 18 – 25 | Typhoon | 220 km/h (140 mph) | 920 hPa (27.17 inHg) | Caroline Islands, Philippines, Taiwan, China | $668 million | 71 | |
| TD | August 18 – 20 | Tropical depression | Not specified | 1004 hPa (29.65 inHg) | Japan | None | None | |
| Kaemi | August 19 – 23 | Tropical storm | 75 km/h (45 mph) | 985 hPa (29.09 inHg) | Vietnam, Cambodia | None | 14 | |
| Prapiroon (Lusing) | August 24 – September 1 | Typhoon | 130 km/h (80 mph) | 950 hPa (28.50 inHg) | Caroline Islands, Ryukyu Islands, East China, Taiwan, Korea, Russia | $6.01 billion | 75 | |
| Maria | August 27 – September 2 | Tropical storm | 75 km/h (45 mph) | 985 hPa (29.09 inHg) | China | None | None | |
| TD | August 31 – September 1 | Tropical depression | Not specified | 1004 hPa (29.65 inHg) | None | None | None | |
| Saomai (Osang) | August 31 – September 16 | Typhoon | 175 km/h (110 mph) | 925 hPa (27.32 inHg) | Mariana Islands, Ryukyu Islands, East China, Korea, Russia | $6.3 billion | 28 | |
| TD | September 1 | Tropical depression | Not specified | 1004 hPa (29.65 inHg) | None | None | None | |
| Bopha (Ningning) | September 4 – 11 | Tropical storm | 75 km/h (45 mph) | 988 hPa (29.17 inHg) | Philippines, Taiwan, Ryukyu Islands | None | None | |
| Wukong (Maring) | September 4 – 10 | Typhoon | 140 km/h (85 mph) | 955 hPa (28.20 inHg) | South China, Vietnam, Laos | None | None | |
| Sonamu | September 14 – 18 | Severe tropical storm | 100 km/h (65 mph) | 980 hPa (28.94 inHg) | Japan | None | None | |
| TD | September 14 – 16 | Tropical depression | Not specified | 1008 hPa (29.77 inHg)) | None | None | None | |
| TD | September 17 | Tropical depression | Not specified | 1012 hPa (29.88 inHg) | None | None | None | |
| Shanshan | September 17 – 24 | Typhoon | 175 km/h (110 mph) | 925 hPa (27.32 inHg) | None | None | None | |
| TD | September 27 – 29 | Tropical depression | Not specified | 1006 hPa (29.71 inHg) | Vietnam | None | None | |
| 27W | September 27 – October 2 | Tropical depression | 55 km/h (35 mph) | 1008 hPa (29.77 inHg) | None | None | None | |
| 28W | October 6 – 14 | Tropical depression | 55 km/h (35 mph) | 998 hPa (29.47 inHg) | Vietnam, South China | None | None | |
| TD | October 13 – 14 | Tropical depression | Not specified | 1008 hPa (29.77 inHg) | None | None | None | |
| TD | October 17 – 18 | Tropical depression | Not specified | 1008 hPa (29.77 inHg) | None | None | None | |
| Yagi (Paring) | October 21 – 28 | Typhoon | 130 km/h (80 mph) | 965 hPa (28.50 inHg) | Ryukyu Islands, Taiwan | None | None | |
| Xangsane (Reming) | October 25 – November 1 | Typhoon | 140 km/h (85 mph) | 960 hPa (28.35 inHg) | Caroline Islands, Philippines, Taiwan, Japan | Unknown | 181 | |
| Bebinca (Seniang) | October 31 – November 7 | Severe tropical storm | 110 km/h (70 mph) | 980 hPa (28.94 inHg) | Philippines, South China | None | 26 | |
| 32W | November 7 – 9 | Tropical depression | 55 km/h (35 mph) | 1004 hPa (29.65 inHg) | Ryukyu Islands | None | None | |
| Rumbia (Toyang) | November 27 – December 7 | Tropical storm | 75 km/h (45 mph) | 990 hPa (29.23 inHg) | Philippines, Vietnam | $1 million | 48 | |
| Ulpiang | December 6 – 8 | Tropical depression | 55 km/h (35 mph) | 1004 hPa (29.65 inHg) | Philippines | None | 3 | |
| TD | December 24 | Tropical depression | Not specified | 1008 hPa (29.77 inHg) | None | None | None | |
| TD | December 24 | Tropical depression | Not specified | 1006 hPa (29.71 inHg) | None | None | None | |
| Soulik (Welpring) | December 29, 2000 – January 4, 2001 | Typhoon | 150 km/h (90 mph) | 955 hPa (28.20 inHg) | None | None | None | |
| Season aggregates | ||||||||
| 52 systems | February 7, 2000 – January 4, 2001 |
220 km/h (140 mph) | 920 hPa (27.17 inHg) | $13.1 billion | 467 | |||
See also[]
- Tropical cyclones in 2000
- Pacific typhoon season
- 2000 Pacific hurricane season
- 2000 Atlantic hurricane season
- 2000 North Indian Ocean cyclone season
- South-West Indian Ocean cyclone seasons: 1999–2000, 2000–01
- Australian region cyclone seasons: 1999–2000, 2000–01
- South Pacific cyclone seasons: 1999–2000, 2000–01
References[]
- ^ Philippine Atmospheric, Geophysical and Astronomical Services Administration (2000). "2000 PAGASA TROPICAL CYCLONE TRACK DATA". Department of Science and Technology. Archived from the original on September 22, 2013. Retrieved 2014-04-05.
- ^ Joint Typhoon Warning Center (2000). "Annual Typhoon Report 2000" (PDF). United States Navy. Retrieved 2014-04-05.
- ^ Luke, Robert (May 1962). "Mariners Weather Log". 44 (3). United States Weather Bureau: 58. Retrieved 2014-04-05. Cite journal requires
|journal=(help) - ^ Leung, John; Chan, C.; Ho, Joly. "The 18 June 2000 Midget Tropical Depression over Hong Kong" (PDF). Hong Kong Observatory.
- ^ Staff Writer (July 12, 2000). "Typhoon Kirogi Brushes Japan, Causing Minimal Damage". Business Services Industry. Retrieved August 9, 2009.
- ^ "Typhoon Kirogi ravages Japanese cities, killing 3".
- ^ "Death toll rises to 116 as disease fears grow in Philippine dump". ReliefWeb. Agence France-Presse. July 12, 2000. Retrieved May 15, 2016.
- ^ На Приморье опять льет (in Russian). Kommersant. July 12, 2000. Retrieved August 9, 2009.
- ^ "Australia Severe Weather Agency". 2006-08-22. Archived from the original on 2006-08-22. Retrieved 2018-10-02.
- ^ Kitamoto, Asanobu (2000-08-15). "Daily Weather Charts". National Institute of Informatics. Japan Meteorological Agency. Retrieved 2019-07-03.
- ^ Kitamoto, Asanobu (2000-08-18). "Daily Weather Charts". National Institute of Informatics. Japan Meteorological Agency. Retrieved 2019-07-03.
- ^ Yuh-Lang Lin, Darrell B. Ensley, and Sen Chiao. Orographic Influences on Rainfall and Track Deflection Associated with the Passage of a Tropical Cyclone. Retrieved on 2008-12-01.
- ^ "Tropical Storm Kaemi kills 14 persons in Vietnam".
- ^ 2000 Annual Tropical Cyclone Report (PDF) (Report). p. 188. Retrieved February 11, 2021.
- ^ "Monthly Global Tropical Cyclone Summary December 2000". australiasevereweather.com. Retrieved 2021-02-03.
- ^ a b Padgett, Gary. "Monthly Tropical Cyclone summary December 1999". Australian Severe Weather. Archived from the original on August 28, 2012. Retrieved August 28, 2012.
- ^ a b the Typhoon Committee (February 21, 2012). "Typhoon Committee Operational Manual 2012" (PDF). World Meteorological Organization. pp. 37–38. Archived (PDF) from the original on August 28, 2012.
External links[]
| Wikimedia Commons has media related to 2000 Pacific typhoon season. |
- Japan Meteorological Agency
- Satellite movie of 2000 Pacific typhoon season
- China Meteorological Agency
- National Weather Service Guam
- Hong Kong Observatory
- Macau Meteorological Geophysical Services
- Korea Meteorological Agency
- Philippine Atmospheric, Geophysical and Astronomical Services Administration
- Taiwan Central Weather Bureau
- Joint Typhoon Warning Center
- Digital Typhoon - Typhoon Images and Information
- Typhoon2000 Philippine typhoon website
Tropical cyclones of the 2000 Pacific typhoon season | ||||||||||||||||||||||||||||||||||||||||||||||||||||||||||||||||||||||||||||||||||||||||||||||||||||||||
|---|---|---|---|---|---|---|---|---|---|---|---|---|---|---|---|---|---|---|---|---|---|---|---|---|---|---|---|---|---|---|---|---|---|---|---|---|---|---|---|---|---|---|---|---|---|---|---|---|---|---|---|---|---|---|---|---|---|---|---|---|---|---|---|---|---|---|---|---|---|---|---|---|---|---|---|---|---|---|---|---|---|---|---|---|---|---|---|---|---|---|---|---|---|---|---|---|---|---|---|---|---|---|---|---|
 |
| |||||||||||||||||||||||||||||||||||||||||||||||||||||||||||||||||||||||||||||||||||||||||||||||||||||||
| ||||||||||||||||||||||||||||||||||||||||||||||||||||||||||||||||||||||||||||||||||||||||||||||||||||||||
- 2000 Pacific typhoon season
- Tropical cyclones in 2000