Tongde County
Tongde County
同德县 | |
|---|---|
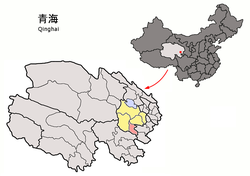 Tongde County (light red) within Hainan Prefecture (yellow) and Qinghai | |
 Tongde Location in Qinghai | |
| Coordinates: 35°00′N 100°30′E / 35.000°N 100.500°ECoordinates: 35°00′N 100°30′E / 35.000°N 100.500°E | |
| Country | People's Republic of China |
| Province | Qinghai |
| Autonomous prefecture | Hainan |
| Area | |
| • Total | 4,758 km2 (1,837 sq mi) |
| Population (2010)[2] | |
| • Total | 64,369 |
| • Density | 14/km2 (35/sq mi) |
| Time zone | UTC+8 (China Standard) |

Tongde County (simplified Chinese: 同德县; traditional Chinese: 同德縣; pinyin: Tóngdé Xiàn) is a county of Qinghai province, China. It is under the administration of Hainan Tibetan Autonomous Prefecture.
Geography[]
Tongde County has an alpine subarctic climate (Köppen Dwc), with long, very cold and dry winters, and short, rainy, mild summers. Average low temperatures are below freezing from mid/late September to mid May; however, due to the wide diurnal temperature variation (at an average 16.9 °C or 30.4 °F), only January has an average high that is below freezing. Despite frequent rain during summer, when a majority of days sees rain, no month has less than 50% of possible sunshine; with monthly percent possible sunshine ranging from 51% in June to 81% in November, the county seat receives 2,806 hours of bright sunshine annually. The monthly 24-hour average temperature ranges from −13.0 °C (8.6 °F) in January to 11.7 °C (53.1 °F) in July, while the annual mean is 0.57 °C (33.0 °F). Over 70% of the annual precipitation of 426 mm (16.8 in) is delivered from June to September.
| hideClimate data for Tongde County (1981−2010 normals) | |||||||||||||
|---|---|---|---|---|---|---|---|---|---|---|---|---|---|
| Month | Jan | Feb | Mar | Apr | May | Jun | Jul | Aug | Sep | Oct | Nov | Dec | Year |
| Average high °C (°F) | −1.1 (30.0) |
2.1 (35.8) |
6.6 (43.9) |
11.0 (51.8) |
14.5 (58.1) |
16.5 (61.7) |
18.5 (65.3) |
18.9 (66.0) |
14.9 (58.8) |
10.1 (50.2) |
5.1 (41.2) |
0.8 (33.4) |
9.8 (49.7) |
| Daily mean °C (°F) | −13.0 (8.6) |
−8.7 (16.3) |
−3.2 (26.2) |
2.3 (36.1) |
7.0 (44.6) |
10.0 (50.0) |
11.7 (53.1) |
10.8 (51.4) |
6.8 (44.2) |
1.2 (34.2) |
−6.5 (20.3) |
−11.6 (11.1) |
0.6 (33.0) |
| Average low °C (°F) | −22.3 (−8.1) |
−18.1 (−0.6) |
−11.7 (10.9) |
−5.9 (21.4) |
−0.1 (31.8) |
4.0 (39.2) |
5.3 (41.5) |
3.9 (39.0) |
0.6 (33.1) |
−5.5 (22.1) |
−14.9 (5.2) |
−20.6 (−5.1) |
−7.1 (19.2) |
| Average precipitation mm (inches) | 2.7 (0.11) |
3.2 (0.13) |
8.4 (0.33) |
19.2 (0.76) |
54.1 (2.13) |
83.9 (3.30) |
91.2 (3.59) |
72.0 (2.83) |
64.0 (2.52) |
23.1 (0.91) |
2.7 (0.11) |
1.3 (0.05) |
425.8 (16.77) |
| Average precipitation days (≥ 0.1 mm) | 3.5 | 3.8 | 6.3 | 7.9 | 15.3 | 18.0 | 19.3 | 16.3 | 14.2 | 7.7 | 2.1 | 1.7 | 116.1 |
| Average relative humidity (%) | 43 | 38 | 41 | 48 | 59 | 69 | 74 | 72 | 72 | 63 | 50 | 42 | 56 |
| Mean monthly sunshine hours | 235.2 | 216.9 | 234.2 | 248.4 | 242.6 | 221.4 | 230.4 | 247.9 | 204.1 | 231.4 | 249.7 | 243.8 | 2,806 |
| Percent possible sunshine | 76 | 71 | 64 | 64 | 56 | 51 | 52 | 60 | 55 | 66 | 81 | 80 | 63 |
| Source: China Meteorological Administration (precipitation days and sunshine 1971–2000)[3][4] | |||||||||||||
See also[]
References[]
- ^ http://www.citypopulation.de/en/china/qinghai/admin/h%C4%83in%C3%A1n_z%C3%A0ngz%C3%BA_z%C3%ACzh%C3%AC/632522__t%C3%B3ngd%C3%A9_xi%C3%A0n/
- ^ http://www.citypopulation.de/en/china/qinghai/admin/h%C4%83in%C3%A1n_z%C3%A0ngz%C3%BA_z%C3%ACzh%C3%AC/632522__t%C3%B3ngd%C3%A9_xi%C3%A0n/
- ^ 中国气象数据网 - WeatherBk Data (in Chinese). China Meteorological Administration. Retrieved 2020-04-15.
- ^ 中国地面国际交换站气候标准值月值数据集(1971-2000年). China Meteorological Administration. Archived from the original on 2013-09-21. Retrieved 2010-05-25.
| show Authority control |
|---|
This Qinghai location article is a stub. You can help Wikipedia by . |
- Tongde County
- County-level divisions of Qinghai
- Hainan Tibetan Autonomous Prefecture
- Northwestern China geography stubs