von Kármán–Gabrielli diagram

A Gabrielli–von Karman diagram
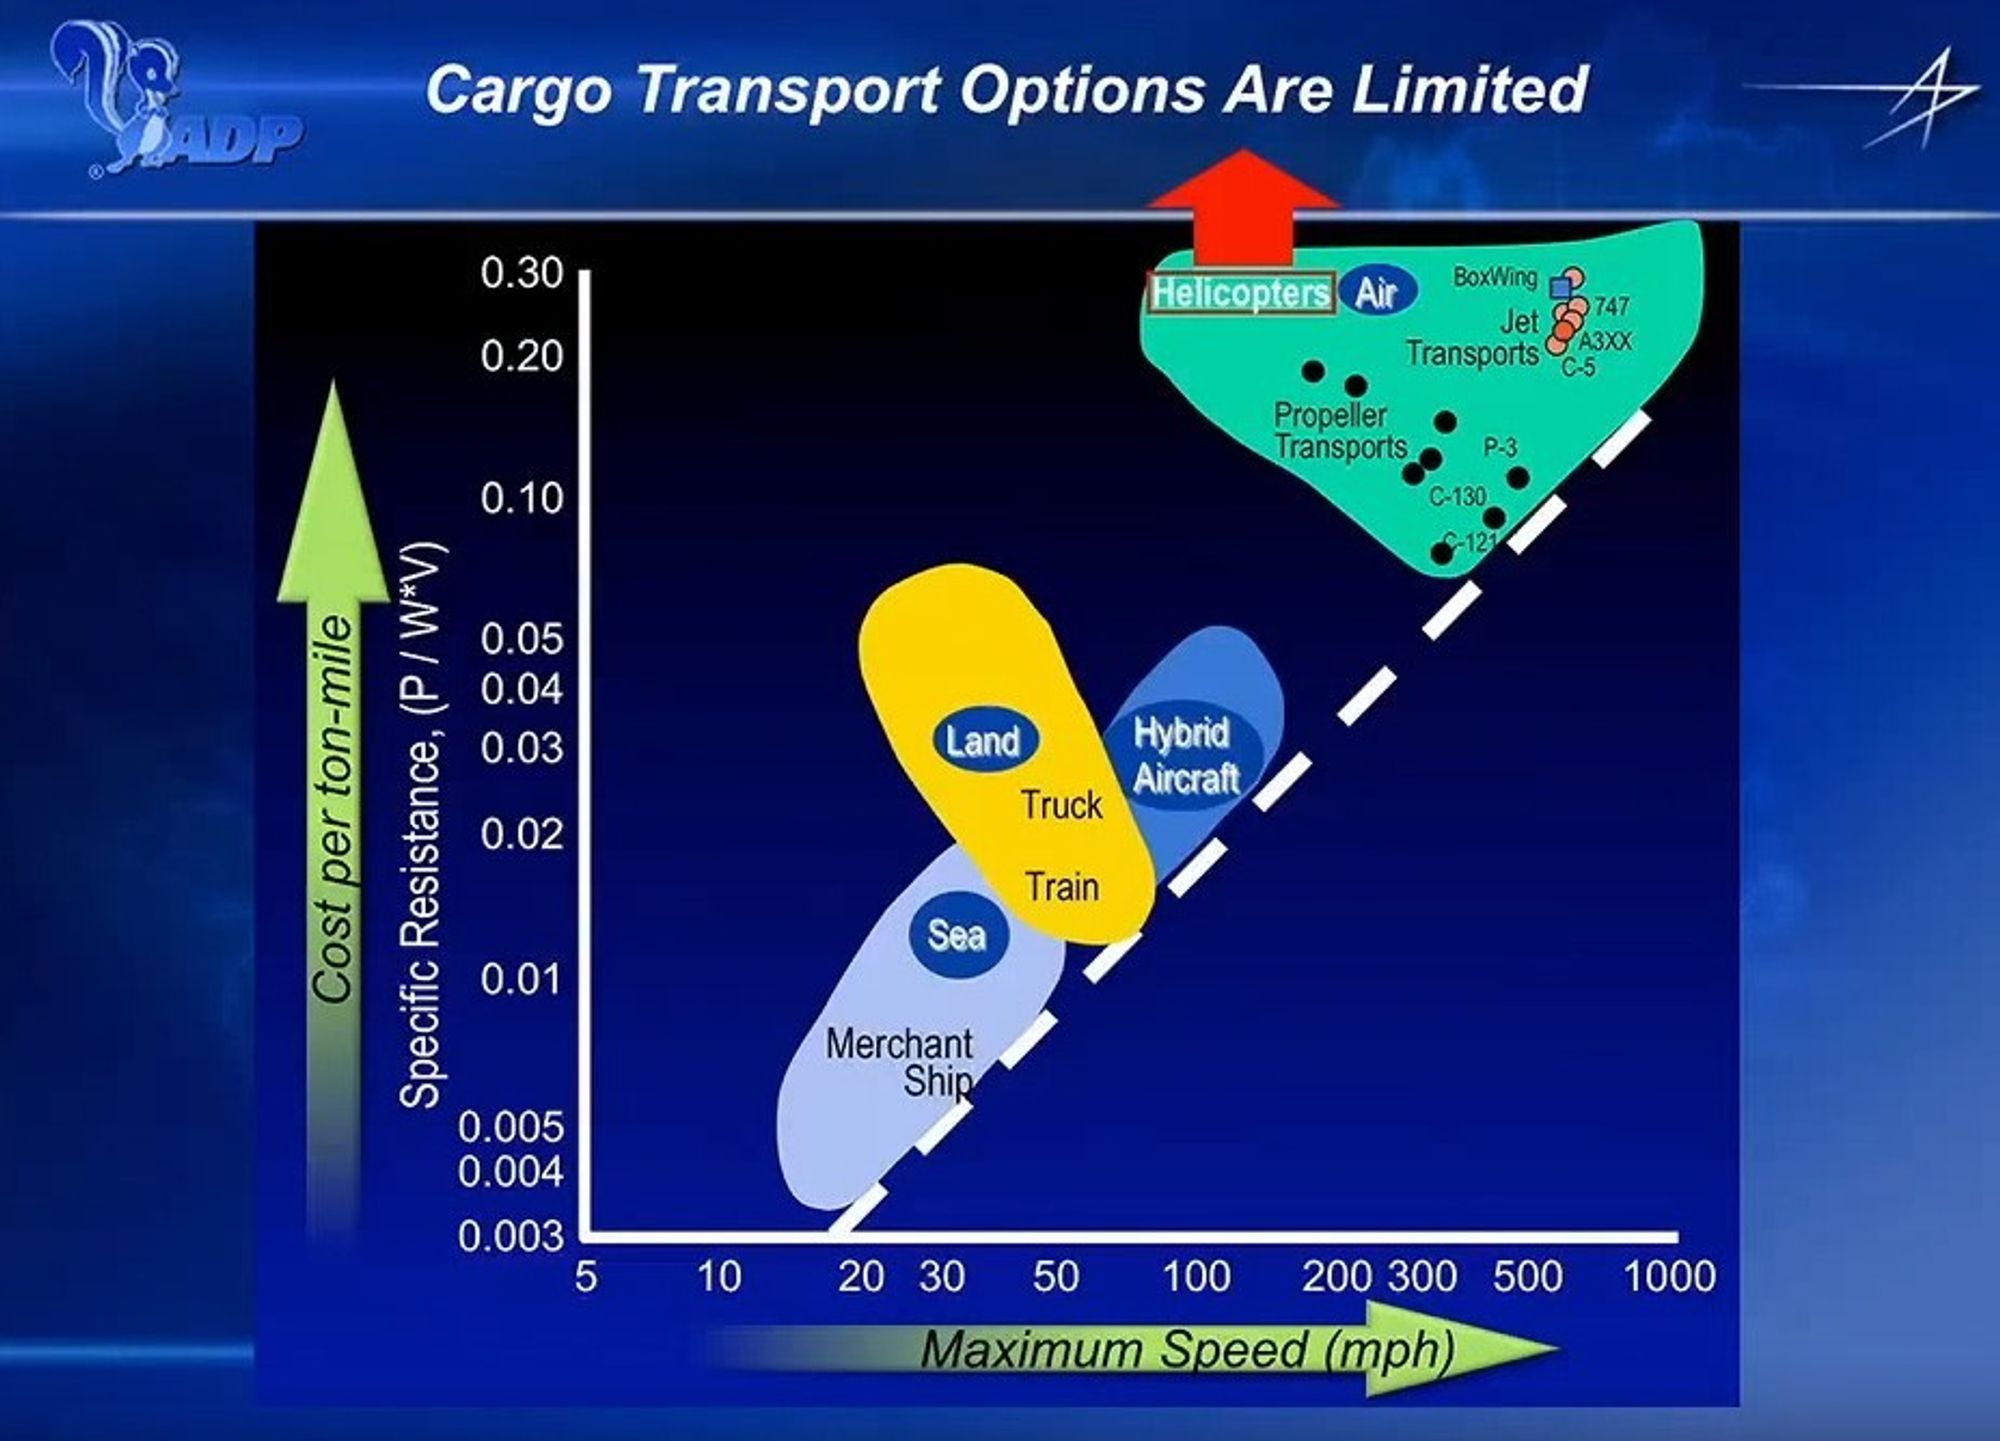
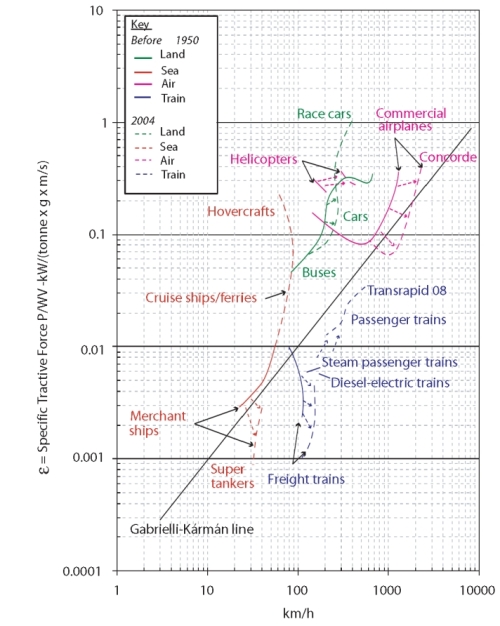
The von Kármán–Gabrielli diagram (also Gabrielli–von Kármán diagram, GvK diagram) is a diagram which compares the efficiency of transportation methods by plotting specific tractive force, or specific resistance (ε = P/mgv = E/mgd) against velocity (v). It was first used by Theodore von Kármán and Giuseppe Gabrielli in their 1950 paper on this subject.[1][2][3]
The basic idea is that formally, 1 kWh/100 km has the dimensional units of a force, a resistance force amounting to 36 N.[4]
See also[]
- Ragone chart
References[]
- ^ "What price speed? Specific power required for propulsion of vehicles", G. Gabrielli and Th. von Kármán, Mechanical Engineering 72 (1950), #10, pp. 775-781.
- ^ "What Price Speed - Revisited", The Railway Research Group, Imperial College, Ingenia 22 (March 2005). PDF with the graphs
- ^ pp. 385-386, Springer Handbook of Robotics, eds. Bruno Siciliano and Oussama Khatib, Springer, 2008, ISBN 978-3-540-23957-4, doi:10.1007/978-3-540-30301-5.
- ^ Useful data - Cambridge repository website repository.cam.ac.uk; see page 328.
External links[]
This article about energy, its collection, its distribution, or its uses is a stub. You can help Wikipedia by . |
Categories:
- Diagrams
- Energy in transport
- Energy stubs