West Rand District Municipality
West Rand | |
|---|---|
District municipality | |
 Seal | |
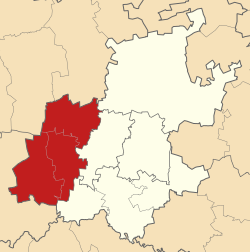 Location in Gauteng | |
| Coordinates: 26°15′S 27°30′E / 26.250°S 27.500°ECoordinates: 26°15′S 27°30′E / 26.250°S 27.500°E | |
| Country | South Africa |
| Province | Gauteng |
| Seat | Randfontein |
| Local municipalities | |
| Government | |
| • Type | Municipal council |
| • Mayor | Boyce Maneli (ANC) |
| Area | |
| • Total | 4,087 km2 (1,578 sq mi) |
| Population (2011)[2] | |
| • Total | 820,995 |
| • Density | 200/km2 (520/sq mi) |
| Racial makeup (2011) | |
| • Black African | 79.2% |
| • Coloured | 2.5% |
| • Indian/Asian | 1.1% |
| • White | 16.7% |
| First languages (2011) | |
| • Tswana | 27.3% |
| • Afrikaans | 16.9% |
| • Xhosa | 14.9% |
| • Sotho | 10.8% |
| • Other | 30.1% |
| Time zone | UTC+2 (SAST) |
| Municipal code | DC48 |

West Rand District Municipality[1] is one of the districts of Gauteng province of South Africa, that covers the West Rand area, with the exception of Roodepoort (which is part of the City of Johannesburg Metropolitan Municipality). The seat of the district municipality is Randfontein.[4][5] The most spoken language among its population of 820,995 is Tswana (2011 census). The district code is CBDC8.
Geography[]
Neighbours[]
West Rand is surrounded by:
- Bojanala Platinum (DC37) to the north
- Tshwane (Pretoria) to the north-east
- Johannesburg to the east
- Sedibeng (DC42) to the south-east
- Dr Kenneth Kaunda (DC40) to the south-west
Local municipalities[]
The district contains the following local municipalities:
| Name | Code | Seat | Area (km²)[6] |
Population (2016)[7] |
Pop. density (per km²) |
|---|---|---|---|---|---|
| Merafong City | GT484 | Carletonville | 1,631 | 188,843 | 115.8 |
| Mogale City | GT481 | Krugersdorp | 1,342 | 383,864 | 286.0 |
| Rand West City | GT485 | Randfontein | 1,115 | 265,887 | 238.5 |
Demographics[]
The following statistics are from the 2011 census.
| Language | Population | % |
|---|---|---|
| Tswana | 215 507 | 24.96% |
| Afrikaans | 126 338 | 16.98% |
| Xhosa | 123 501 | 16.60% |
| Sotho | 86 236 | 11.59% |
| Zulu | 63 541 | 8.54% |
| Tsonga | 38 410 | 5.16% |
| English | 35 811 | 4.81% |
| Northern Sotho | 22 618 | 3.04% |
| Other | 10 587 | 1.42% |
| Swati | 9 918 | 1.33% |
| Venda | 8 927 | 1.20% |
| Ndebele | 2 759 | 0.37% |
Gender[]
| Gender | Population | % |
|---|---|---|
| Male | 400 157 | 53.77% |
| Female | 344 011 | 46.23% |
Ethnic group[]
| Ethnic group | Population | % |
|---|---|---|
| Black African | 587 665 | 78.84% |
| White | 132 849 | 17.85% |
| Coloured | 17 531 | 2.36% |
| Indian/Asian | 7 123 | 0.96% |
Age[]
| Age | Population | % |
|---|---|---|
| 000 - 004 | 63 062 | 8.47% |
| 005 - 009 | 55 983 | 7.52% |
| 010 - 014 | 55 746 | 7.49% |
| 015 - 019 | 58 721 | 7.89% |
| 020 - 024 | 72 868 | 9.79% |
| 025 - 029 | 82 601 | 11.10% |
| 030 - 034 | 77 616 | 10.43% |
| 035 - 039 | 76 425 | 10.27% |
| 040 - 044 | 65 412 | 8.79% |
| 045 - 049 | 46 479 | 6.25% |
| 050 - 054 | 31 153 | 4.19% |
| 055 - 059 | 19 826 | 2.66% |
| 060 - 064 | 14 459 | 1.94% |
| 065 - 069 | 9 058 | 1.22% |
| 070 - 074 | 6 526 | 0.88% |
| 075 - 079 | 4 177 | 0.56% |
| 080 - 084 | 2 561 | 0.34% |
| 085 - 089 | 897 | 0.12% |
| 090 - 094 | 395 | 0.05% |
| 095 - 099 | 130 | 0.02% |
| 100 plus | 73 | 0.01% |
Politics[]
Election results[]
This section needs to be updated. (October 2017) |
Election results for West Rand in the South African general election, 2004.
- Population 18 and over: 535 436 [71.95% of total population]
- Total votes: 267 225 [35.91% of total population]
- Voting % estimate: 49.91% votes as a % of population 18 and over
| Party | Votes | % |
|---|---|---|
| African National Congress | 196 513 | 73.54% |
| Democratic Alliance | 41 008 | 15.35% |
| Inkhata Freedom Party | 6 748 | 2.53% |
| Freedom Front Plus | 4 235 | 1.58% |
| United Democratic Movement | 4 093 | 1.53% |
| African Christian Democratic Party | 3 301 | 1.24% |
| Independent Democrats | 3 076 | 1.15% |
| Pan African Congress | 2 481 | 0.93% |
| New National Party | 1 645 | 0.62% |
| United Christian Democratic Party | 1 244 | 0.47% |
| Azanian People's Organisation | 1 215 | 0.45% |
| UF | 350 | 0.13% |
| CDP | 338 | 0.13% |
| SOPA | 258 | 0.10% |
| NA | 242 | 0.09% |
| PJC | 182 | 0.07% |
| TOP | 82 | 0.03% |
| EMSA | 64 | 0.02% |
| KISS | 61 | 0.02% |
| Minority Front | 59 | 0.02% |
| NLP | 30 | 0.01% |
| Total | 267 225 | 100.00% |
References[]
- ^ a b "West Rand District Municipality | Government Communication and Information System (GCIS)". www.gcis.gov.za. Government Communication and Information System. Retrieved 20 June 2017.
- ^ a b "Statistics by place". Statistics South Africa. Retrieved 27 September 2015.
- ^ "Statistics by place". Statistics South Africa. Retrieved 27 September 2015.
- ^ "West Rand District Municipality". www.localgovernment.co.za. Yes Media. Retrieved 20 June 2017.
- ^ "West Rand District Municipality Contact". www.wrdm.gov.za. West Rand District Municipality. Retrieved 20 June 2017.
- ^ "2016 Boundaries". Municipal Demarcation Board (Shapefile). 2016.
- ^ "Community Survey 2016". Statistics South Africa (Data file). 2016.
External links[]
| Metropolitan |  | ||||
|---|---|---|---|---|---|
| District and local |
| ||||
List of municipalities in Gauteng | |||||
Municipalities and communities of West Rand District Municipality, Gauteng | ||
|---|---|---|
District seat: Randfontein | ||
| Mogale City | 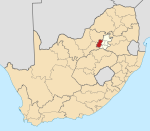 | |
| Merafong City |
| |
| Rand West City |
| |
Categories:
- District municipalities of Gauteng
- West Rand District Municipality