Merafong City Local Municipality
Merafong City | |
|---|---|
 Seal | |
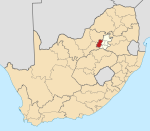
 Location of Merafong City Local Municipality within Gauteng | |
| Coordinates: 26°25′S 27°25′E / 26.417°S 27.417°ECoordinates: 26°25′S 27°25′E / 26.417°S 27.417°E | |
| Country | South Africa |
| Province | Gauteng |
| District | West Rand |
| Seat | Carletonville |
| Wards | 28 |
| Government | |
| • Type | Municipal council |
| • Mayor | S.M Mogale-Letsie (ANC) |
| Area | |
| • Total | 1,631 km2 (630 sq mi) |
| Population (2011)[2] | |
| • Total | 197,520 |
| • Density | 120/km2 (310/sq mi) |
| Racial makeup (2011) | |
| • Black African | 86.5% |
| • Coloured | 1.1% |
| • Indian/Asian | 0.3% |
| • White | 11.8% |
| First languages (2011) | |
| • Xhosa | 24.9% |
| • Tswana | 21.4% |
| • Sotho | 19.3% |
| • Afrikaans | 12.8% |
| • Other | 21.6% |
| Time zone | UTC+2 (SAST) |
| Municipal code | GT484 |

Merafong City Local Municipality is a local municipality in West Rand District Municipality, Gauteng, South Africa. Its boundaries encloses some of the richest gold mines in the world. It is situated about 65 km from Johannesburg and is serviced by a number of major roads, including the N12 from Johannesburg to Beaufort West and the N14 (the main road between Gauteng and Vryburg via Ventersdorp).
Formerly a cross-border municipality, the entire municipality was transferred to the North West province[4] following the abolition of cross-border municipalities by an amendment to the South African Constitution in 2005. The municipality was a part of the North West Province from 2005 to 2009, when it was reincorporated into the Gauteng Province by another amendment to the Constitution, following often violent protests in the township of Khutsong.[5]
Merafong's historical development is closely knit with the discovery of rich gold deposits in the early 1930s.
Fochville is the oldest town in the region and was declared a town in 1951.[6]
The town Carletonville was named after Guy Carleton Jones, an engineer from the Gold Fields Ltd mining company, who played a prominent role in the discovery of the West Wits gold field, of which Carletonville forms a part. The mining company decided in November 1946 to establish the town. Carletonville was proclaimed in 1948 and attained Town Council Status on 1 July 1959.[6]
Wedela is situated in between Western Deep Levels and Elandsrand mine. The town's name is derived from the prefixes of the two mines: the "Wed-" from Western Deep Levels and the "-ela" from Elandsrand. Wedela was established as a mining village in December 1978 by Harry Oppenheimer, and municipal status was granted to the town on 1 January 1990.[6]
Attached to Fochville and Carletonville are the towns of Khutsong, Kokosi, Greenspark, Welverdiend, and Blybank.
Main places[]
The 2001 census divided the municipality into the following main places:[7]
| Place | Code | Area (km2) | Population | Most spoken language |
|---|---|---|---|---|
| 78801 | 6.90 | 471 | Zulu | |
| Blyvooruitzicht | 78802 | 6.31 | 6,461 | Xhosa |
| Carletonville | 78803 | 12.67 | 18,364 | Afrikaans |
| 78804 | 9.41 | 3,356 | Afrikaans | |
| Doornfontein | 78805 | 1.51 | 2,575 | Xhosa |
| East Driefontein Mine | 78806 | 2.03 | 11,481 | Xhosa |
| Elandsfontein | 68801 | 0.43 | 5,256 | Sotho |
| Elandsrand | 68802 | 0.19 | 1,786 | Sotho |
| 78807 | 2.78 | 2,881 | Afrikaans | |
| Fochville | 68803 | 9.53 | 11,344 | Afrikaans |
| Khutsong | 78808 | 8.60 | 69,858 | Tswana |
| Kokosi | 68804 | 4.90 | 23,062 | Tswana |
| 68805 | 0.30 | 1,176 | Sotho | |
| 78809 | 0.76 | 1,511 | Xhosa | |
| Oberholzer | 78811 | 3.09 | 5,368 | Afrikaans |
| Phomolong | 78812 | 0.25 | 947 | Xhosa |
| Wedela | 68807 | 2.18 | 14,159 | Xhosa |
| Welverdiend | 78813 | 4.06 | 2,226 | Afrikaans |
| Westdriefontein | 78814 | 38.29 | 4,792 | Sotho |
| 78815 | 44.72 | 11,274 | Sotho | |
| Remainder of the municipality | 78810 + 68806 | 1,471.53 | 12,144 |
Politics[]
The municipal council consists of fifty-five members elected by mixed-member proportional representation. Twenty-eight councillors are elected by first-past-the-post voting in twenty-eight wards, while the remaining twenty-seven are chosen from party lists so that the total number of party representatives is proportional to the number of votes received. In the election of 3 August 2016 the African National Congress (ANC) won a majority of seats on the council.
The following table shows the results of the election.[8][9]
| Party | Votes | Seats | ||||||
|---|---|---|---|---|---|---|---|---|
| Ward | List | Total | % | Ward | List | Total | ||
| ANC | 28,909 | 28,022 | 56,931 | 54.0 | 23 | 7 | 30 | |
| Democratic Alliance | 11,488 | 11,425 | 22,913 | 21.7 | 5 | 7 | 12 | |
| EFF | 8,564 | 8,509 | 17,073 | 16.2 | 0 | 9 | 9 | |
| African Independent Congress | 600 | 1,653 | 2,253 | 2.1 | 0 | 1 | 1 | |
| Freedom Front Plus | 1,053 | 1,072 | 2,125 | 2.0 | 0 | 1 | 1 | |
| IFP | 726 | 711 | 1,437 | 1.4 | 0 | 1 | 1 | |
| UDM | 724 | 690 | 1,414 | 1.3 | 0 | 1 | 1 | |
| Others | 753 | 610 | 1,363 | 1.3 | 0 | 0 | 0 | |
| Total | 52,817 | 52,692 | 105,509 | 100.0 | 28 | 27 | 55 | |
| Spoilt votes | 812 | 984 | 1,796 | |||||
References[]
- ^ "Contact list: Executive Mayors". Government Communication & Information System. Archived from the original on 14 July 2010. Retrieved 22 February 2012.
- ^ Jump up to: a b "Statistics by place". Statistics South Africa. Retrieved 27 September 2015.
- ^ "Statistics by place". Statistics South Africa. Retrieved 27 September 2015.
- ^ Integrated Development Plan. Archived 2011-10-09 at the Wayback Machine Merafong City Local Municipality. Retrieved on Oct 6, 2009.
- ^ "NCOP Passes Merafong Bills." Archived 2010-11-28 at the Wayback Machine Press release. Parliament of the Republic of South Africa. Retrieved on Oct 15, 2009.
- ^ Jump up to: a b c About Merafong. Merafong City Local Municipality. Retrieved on Oct 6, 2009.
- ^ Lookup Tables - Statistics South Africa[permanent dead link]
- ^ "Results Summary – All Ballots: Merafong City" (PDF). Independent Electoral Commission. Retrieved 24 August 2016.
- ^ "Seat Calculation Detail: Merafong City" (PDF). Independent Electoral Commission. Retrieved 24 August 2016.
External links[]

| show Municipalities and communities of West Rand District Municipality, Gauteng |
|---|
- Local municipalities of the West Rand District Municipality