From Wikipedia, the free encyclopedia
1924 Norwegian parliamentary election
First party
Second party
Third party
Leader
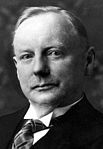
Ivar Lykke
Gunnar Knudsen
Oscar Torp
Party
Conservative
Liberal
Labour
Last election
42 seats, 33.3%
37 seats, 20.1%
29 seats, 21.3%
Seats won
43
34
24
Seat change
Popular vote
316,846 (H +FV )
180,979
179,567
Percentage
32.5% (H +FV )
18.6%
18.4%
Fourth party
Fifth party
Sixth party
Leader
Karl Wilhelm Wefring
?
Party
Farmers'
Free-minded
Social Democratic Labour
Last election
17 seats, 13.1%
15 seats with H
8 seats, 9.2%
Seats won
22
11
8
Seat change
Popular vote
131,706
Alliance with H
85,743
Percentage
13.5%
—
8.8%
Seventh party
Eighth party
Leader
Sverre Støstad
?
Party
Communist
Radical People's
Last election
New
2 seats, 2.5%
Seats won
6
2
Seat change
Popular vote
59,401
17,144
Percentage
6.1%
1.8%
Parliamentary elections were held in Norway on 21 October 1924.[1] Conservative Party -Liberal Left Party alliance, which won 54 of the 150 seats in the Storting . To date, this is the last election in which the Labour Party did not receive the most votes or the most seats in the Storting of participating parties.
Results [ ]
Party
Votes
%
Seats
+/–
Conservative Party 316,846
32.5
43
+1
Free-minded Liberal Party 11
–4
Liberal Party 180,979
18.6
34
–3
Labour Party 179,567
18.4
24
–5
Farmers' Party 131,706
13.5
22
+5
Social Democratic Labour Party 85,743
8.8
8
0
Communist Party 59,401
6.1
6
New
Radical People's Party 17,144
1.8
2
0
Other parties
2,493
0.3
0
–
Wild votes
62
0.0
–
–
Invalid/blank votes
13,244
–
–
–
Total 987,185 100 150 0
Registered voters/turnout
1,412,441
69.9
–
–
Source: Nohlen & Stöver
References [ ]
^ Dieter Nohlen & Philip Stöver (2010) Elections in Europe: A data handbook , p1438 ISBN 978-3-8329-5609-7
Categories :
General elections in Norway 1920s elections in Norway 1924 elections in Europe 1924 in Norway October 1924 events


