From Wikipedia, the free encyclopedia
1985 Norwegian parliamentary election
First party
Second party
Third party
Leader
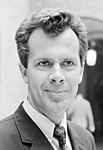
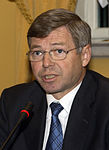
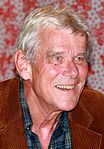
Gro Harlem Brundtland
Erling Norvik
Kjell Magne Bondevik
Party
Labour
Conservative
Christian Democratic
Last election
66 seats, 37.2%
53 seats, 35.3%
15 seats, 12.5%
Seats won
71
50
16
Seat change
Popular vote
1,061,712
791,537
214,969
Percentage
40.8%
30.4%
8.3%
Fourth party
Fifth party
Sixth party
Leader
Johan J. Jakobsen
Theo Koritzinsky
Carl I. Hagen
Party
Centre
Socialist Left
Progress
Last election
11 seats, 7.8%
4 seats, 4.9%
4 seats, 4.5%
Seats won
12
6
2
Seat change
Popular vote
171,770
141,950
96,797
Percentage
6.6%
5.5%
3.7%
Parliamentary elections were held in Norway on 8 and 9 September 1985.[1] Labour Party remained the largest party in the Storting , winning 71 of the 157 seats. It was the first election since 1885 in which the Liberal Party failed to win a seat.
Results [ ]
Party
Votes
%
Seats
+/–
Labour Party 1,061,712
40.8
71
+5
Conservative Party 791,537
30.4
50
–3
Christian People's Party 214,969
8.3
16
+1
Centre Party 171,770
6.6
12
+1
Socialist Left Party 141,950
5.5
6
+2
Progress Party 96,797
3.7
2
–2
Liberal Party 81,202
3.1
0
–2
Red Electoral Alliance 14,818
0.6
0
0
Liberal People's Party 12,958
0.5
0
0
Pensioners' Party 7,846
0.3
0
New
Communist Party 4,245
0.2
0
New
Sunnmøre List 2,013
0.5
0
New
Freely Elected Representatives
0
0
Society Party 0
New
Non-Partisan List
0
New
Invalid/blank votes
3,619
–
–
–
Total 2,605,436 100 157 +2
Registered voters/turnout
3,100,479
84.0
–
–
Source: Nohlen & Stöver
References [ ]
^ Dieter Nohlen & Philip Stöver (2010) Elections in Europe: A data handbook , p1438 ISBN 978-3-8329-5609-7
Categories :
General elections in Norway 1980s elections in Norway 1985 elections in Europe 1985 in Norway September 1985 events in Europe


