1974 Belgian general election

From Wikipedia, the free encyclopedia

1974 Belgian general election

← 1971 10 March 1974 1977 →

212 seats in the Chamber of Representatives
  First party Second party Third party
  Edmond Leburton.jpg Leo Tindemans No image.png
Leader Edmond Leburton Leo Tindemans Frans Grootjans
Party Socialist CVP Open Vld
Leader since Candidate for PM Candidate for PM 1973
Last election 25 seats, 10.40%[a] 40 seats, 18.32% 16 seats, 7.42%
Seats won 59 50 30
Seat change Increase 34 Increase 10 Increase 14
Popular vote 1,401,725 1,222,646 798,818
Percentage 26.66% 23.25% 15.19%
Swing Increase 16.26% Increase 4.91% Increase 7.77%

  Fourth party Fifth party Sixth party
  No image.png Charles-Ferdinand Nothomb in 2011.jpg No image.png
Leader Frans Van der Elst Charles-Ferdinand Nothomb André Lagasse
Party VU cdH DéFI
Leader since 1955 1972 1972
Last election 21 seats, 11.11% 15 seats, 6.20% 12 seats, 5.43%
Seats won 22 22 14
Seat change Increase 1 Increase 7 Increase 2
Popular vote 536,287 478,209 301,303
Percentage 10.20% 9.09% 5.73%
Swing Decrease 0.91% Increase 2.89% Increase 0.30%

Belgian federal election 1974 - Chamber - circumscriptions.svg
Colours denote the winning party in each electoral district (for the Chamber of Deputies).
a In the 1971 election, the Belgian Socialist Party ran as its two separate language parts (owing to the recent establishment of two sub parties), however they ran as one under the Socialist prime minister for this election, with his Walloon section of the party's results showing here.

Government before election

Leburton II
BSP/PSB-CVP-PSC-PVV-PRL

Government after election

Tindemans I
CVP-PSC-PVV-PRL

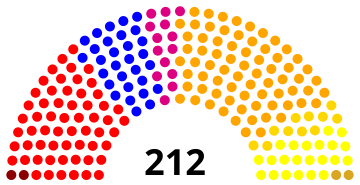
General elections were held in Belgium on 10 March 1974.[1] The Belgian Socialist Party emerged as the largest faction in the Chamber of Representatives with 59 of the 212 seats. Voter turnout was 90.3%.[2] Elections were also held for the nine provincial councils, as well as for the Council of the German Cultural Community for the first time.

Results[]

Chamber of Deputies[]

Belgian Chamber 1974.svg
Party Votes % Seats +/–
Belgian Socialist Party 1,401,725 26.66 59 New
Christian People's Party 1,222,646 23.25 50 +10
Party for Freedom and Progress 798,818 15.19 30 +26
People's Union 536,287 10.20 22 +1
Christian Social Party 478,209 9.09 22 +7
FDF- 301,303 5.73 14 New
Walloon Rally 269,455 5.12 11 −1
Belgian Socialist Party (Wallonia) 164,592 3.13 0 −25
Communist Party of Belgium 107,481 2.04 2 New
BSPRed Lions 86,929 1.65 0 New
UDP 58,257 1.11 0 New
Party for Freedom and Progress (Wallonia) 20,866 0.40 0 −11
AMADA/TPO 19,794 0.38 0 New
VFP-PFU 18,511 0.35 0 New
MO 9,184 0.17 0 New
Party of German-speaking Belgians 8,700 0.17 0 New
PLW 6,846 0.13 0 New
FDP 4,729 0.09 0 New
UDP-DN 3,623 0.07 2 New
Rex Fr 2,764 0.05 0 New
RLiège 1,810 0.03 0 New
Kaganov 1,678 0.03 0 New
SAP 1,445 0.03 0 New
Diependale 1,229 0.02 0 New
A74 979 0.02 0 New
PRS 905 0.02 0 New
Zwartberg 665 0.01 0 New
Trotskyists 645 0.01 0 New
URB 389 0.01 0 New
PUR 184 0.00 0 New
Invalid/blank votes 453,108
Total 5,711,639 100 212 0
Source: Belgian Elections

Senate[]

Belgium Senate 1974.svg
Party Votes % Seats +/–
Belgian Socialist Party 1,301,722 25.11 27 New
Christian People's Party 1,219,811 23.53 27 New
Party for Freedom and Progress 755,694 14.58 16 +1
FDF-RW- 589,553 11.37 13 New
People's Union 545,215 10.52 10 New
Christian Social Party 430,512 8.30 10 New
Communist Party of Belgium 115,007 2.22 1 0
BSPRed Lions 82,959 1.60 2 +2
UDP 60,400 1.16 0 0
Party for Liberty and Progress (Wallonia) 21,782 0.42 0 New
AMADA 16,744 0.32 0 New
Party of German-speaking Belgians 15,624 0.30 0 New
VFP 11,910 0.23 0 New
PMO 5,918 0.11 0 New
Iependael 2,874 0.05 0 New
Zwartberg 5,129 0.04 0 New
Kaganovemus 1,903 0.04 0 0
PMO/URB 1,078 0.02 0 New
A74 942 0.02 0 New
PLW 597 0.01 0 New
PUR 156 0.00 0 New
Invalid/blank votes 527,014
Total 5,711,729 100 106 0
Source: Belgian Elections

Council of the German Cultural Community[]

In this election, the new Council of the German Cultural Community (Rat der deutschen Kulturgemeinschaft) was directly elected for the first time; members of the council had been appointed a year earlier. The council is the precursor to the Parliament of the German-speaking Community.

Party 1974 1973 diff.
perc. seats seats seats
Christian Social Party (CSP) 46.9% 12 13 -1
Party of German-speaking Belgians (PJU-PDB) 25.4% 6 3 +3
Party for Freedom and Progress (PFF) 14.9% 4 6 -2
Socialist Party (SP) 12.1% 3 3 =
Others 0.7% 0 0 =
Total 100.0 25 25 0

References[]

  1. ^ Dieter Nohlen & Philip Stöver (2010) Elections in Europe: A data handbook, p289 ISBN 978-3-8329-5609-7
  2. ^ Nohlen & Stöver, p291
Retrieved from ""