From Wikipedia, the free encyclopedia
1977 Belgian general election
First party
Second party
Third party
Leader
Leo Tindemans
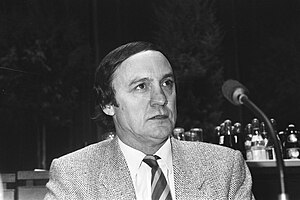
André Cools
Karel Van Miert
Party
CVP
Socialist
Socialist
Leader since
Candidate for PM
1973
1977
Last election
50 seats, 23.25%
59 seats, 26.66%[a]
59 seats, 26.66%[a]
Seats won
56
34
27
Seat change
Popular vote
1,460,757
602,132
725,513
Percentage
26.20%
10.80%
13.01%
Swing
Fourth party
Fifth party
Sixth party
PSC
VU
PVV
Leader
Georges Gramme
Hugo Schiltz
Frans Grootjans
Party
cdH
VU
Open Vld
Leader since
1976
1975
1973
Last election
22 seats, 9.09%
22 seats, 10.20%
30 seats, 15.19%
Seats won
24
20
17
Seat change
Popular vote
406,694
559,567
475,917
Percentage
7.29%
10.04%
8.54%
Swing
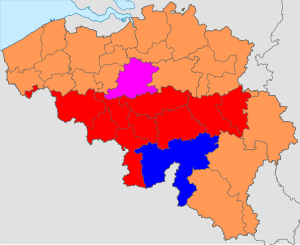
Colours denote the winning party in each electoral district (for the Chamber of Deputies).
a Whilst still technically the same party in this election, for the first time the Walloon and Flemish sections of the party ran candidates separately.
General elections were held in Belgium on 17 April 1977.[1] Christian People's Party , which won 56 of the 212 seats in the Chamber of Representatives and 28 of the 106 seats in the Senate . Voter turnout was 95.1%.[2] Council of the German Cultural Community .
Results [ ] Chamber of Deputies [ ]
Party
Votes
%
Seats
+/–
Christian People's Party 1,460,757
26.20
56
+6
Belgian Socialist Party (Flanders) 725,513
13.01
27
New
Belgian Socialist Party 602,132
10.80
34
New
People's Union 559,567
10.04
20
–2
Party for Freedom and Progress 475,917
8.54
17
New
Christian Social Party 406,694
7.29
24
+2
Democratic Front of the Francophones 263,104
4.72
11
New
Party of Reforms and Freedom of Wallonia 191,196
3.34
16
New
Belgian Socialist Party (Wallonia) 145,771
2.61
0
0
PSC-CSP
138,361
2.48
0
New
Walloon Rally 132,773
2.38
4
–7
PRLW /PRF107,015
1.92
0
New
PRLW -PL92,178
1.65
0
New
Communist Party of Belgium 62,410
1.12
0
–2
PCB-UDP
51,930
0.93
0
New
Community Party (Wallonia) 37,104
0.67
2
New
PSB -RW 33,598
0.60
1
New
AMADA
22,919
0.41
0
New
ECOLOG
11,839
0.21
0
New
RAL
8,562
0.15
0
New
Party of German-speaking Belgians 7,735
0.14
0
0
PLPW
5,220
0.09
0
New
ECOLOG-PBNZ
4,321
0.08
0
New
Ecolo 3,834
0.07
0
New
LRT-RAL
3,127
0.06
0
New
LRT
2,905
0.05
0
New
AGALEV 2,435
0.04
0
New
FFF
2,099
0.04
0
New
TPO
1,980
0.04
0
New
CPC/URB
1,547
0.03
0
New
PRF
1,514
0.03
0
New
RLiège
1,421
0.03
0
0
UB
1,083
0.02
0
New
FNP
994
0.02
0
New
VFP
967
0.02
0
New
KAGANO
884
0.02
0
New
COLOGIQUE
777
0.01
0
New
EW
605
0.01
0
New
PCBML
533
0.01
0
New
VOP
443
0.01
0
New
VB77
377
0.01
0
New
UCMLB
222
0.00
0
New
UC-MEUNIER
199
0.00
0
New
PORT
175
0.00
0
New
PP
169
0.00
0
New
POE
152
0.00
0
New
Invalid/blank votes
431,153
–
–
–
Total 6,006,211 100 212 0
Source: Belgian Elections
Senate [ ]
Party
Votes
%
Seats
+/–
Christian People's Party 1,446,806
26.18
28
+1
Belgian Socialist Party (Wallonia) 756,401
13.69
19
New
Belgian Socialist Party (Flanders) 719,533
13.02
12
New
People's Union 562,894
10.19
10
0
Christian Social Party 522,613
9.46
11
+1
Party for Freedom and Progress 472,645
8.55
9
New
Party of Reforms and Freedom of Wallonia 316,292
5.72
7
New
Democratic Front of the Francophones 546,367
4.46
6
New
Walloon Rally 158,642
2.87
2
New
Communist Party of Belgium 108,000
1.95
1
0
PL
70,458
1.28
0
New
PCB -UDP50,749
0.92
0
New
BSP -RW 33,945
0.61
1
New
AMADA-TPO
27,693
0.50
0
New
Party of German-speaking Belgians 10,213
0.18
0
0
Ecolo 7,558
0.14
0
New
PLPW
5,305
0.10
0
New
VFP-PFU
3,413
0.06
0
New
AGALEV 3,270
0.06
0
New
UB
1,182
0.02
0
New
VOP
896
0.02
0
New
LRT-RAL
387
0.01
0
New
URB
207
0.00
0
New
Invalid/blank votes
486,091
–
–
–
Total 6,012,062 100 106 0
Source: Belgian Elections
References [ ]
^ Dieter Nohlen & Philip Stöver (2010) Elections in Europe: A data handbook , p289 ISBN 978-3-8329-5609-7 ^ Nohlen & Stöver, p291
Categories :
1977 elections in Belgium April 1977 events in Europe Hidden categories:
Articles with short description Short description is different from Wikidata