1989–90 South Pacific cyclone season
| 1989–90 South Pacific cyclone season | |
|---|---|
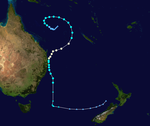
 Season summary map | |
| Seasonal boundaries | |
| First system formed | November 8, 1989 |
| Last system dissipated | March 25, 1990 |
| Strongest storm | |
| Name | Ofa |
| • Maximum winds | 185 km/h (115 mph) (10-minute sustained) |
| • Lowest pressure | 925 hPa (mbar) |
| Seasonal statistics | |
| Total depressions | 11 |
| Tropical cyclones | 5 |
| Severe tropical cyclones | 2 |
| Total fatalities | 11 |
| Total damage | > $187 million (1990 USD) |
| Related articles | |
The 1989–90 South Pacific cyclone season was a below-average season with only five tropical cyclones occurring within the South Pacific to the east of 160°E.[A 1] The season officially ran from November 1, 1989, to April 30, 1990, with the first disturbance of the season forming on November 8 and the last disturbance dissipating on March 19.[A 2] This is the period of the year when most tropical cyclones form within the South Pacific Ocean.[1]
During the season at least 15 people were killed from tropical disturbances whilst overall damage was estimated at $196 million. The most damaging tropical disturbance was Cyclone Ofa, one of the strongest storms to affect Samoa in the 20th century, which caused at least $180 million in damage to multiple countries and left eight dead. Cyclone Nancy caused $14 million in damages to Queensland and NSW, Australia and killed four people. During the formative stages of Cyclone Peni, the system caused $1 million in damages to the Cook Islands. Cyclone Rae drowned three people in Fiji but caused only $1 million (1990 USD) of damages to crops and vegetation. As a result of the impacts caused by Ofa and Peni, the names were retired from the tropical cyclone naming lists.[1]
During the season, tropical cyclones were monitored by the Tropical Cyclone Warning Centers (TCWC) in Nadi, Fiji, and in Wellington, New Zealand.[A 3] Whilst tropical cyclones that moved to the west of 160°E were monitored as a part of the Australian region. Both the United States Joint Typhoon Warning Center (JTWC) and the Naval Western Oceanography Center (NWOC) issued unofficial warnings within the southern Pacific. The JTWC issued warnings between 160°E and the International Date Line whilst the NWOC issued warnings for tropical cyclones forming between the International Date Line and the coasts of the Americas. Both the JTWC and the NWOC designated tropical cyclones with a number and a P suffix with numbers assigned in order to tropical cyclones developing within the whole of the Southern Hemisphere. TCWC Nadi, TCWC Wellington and TCWC Brisbane all use the Australian Tropical Cyclone Intensity Scale and estimate wind speeds over a ten-minute period, while the JTWC estimates sustained winds over a one-minute period, which are subsequently compared to the Saffir–Simpson hurricane wind scale (SSHWS).
Seasonal summary[]

Systems[]
Cook Islands Depression[]
| Tropical depression (Australian scale) | |
 | |
| Duration | November 8 – November 10 |
|---|---|
| Peak intensity | Winds not specified |
Samoa Depression[]
| Tropical depression (Australian scale) | |
| | |
| Duration | December 14 – December 17 |
|---|---|
| Peak intensity | Winds not specified |
Tropical Depression Felicity[]
| Tropical depression (Australian scale) | |
| Tropical depression (SSHWS) | |
  | |
| Duration | December 19 – December 22 |
|---|---|
| Peak intensity | 75 km/h (45 mph) (10-min) 990 hPa (mbar) |
On December 19, the remnants of Tropical Cyclone Felicity, moved into the basin with 10-minute sustained windspeeds of 75 km/h (45 mph), which would have made it a category 1 tropical cyclone on the Australian scale.[2] However, because it did not have the "classical characteristics of a tropical cyclone", it was treated as a tropical depression by the BoM and the FMS.[3][4] Over the next couple of days, in response to an upper-level trough of low pressure weakening, the depression slowly weakened further, while accelerating to towards the southeast.[3] Felicity was absorbed by a short-wave trough of low pressure to the north of New Zealand before it was last noted during December 22.[3][2]
Coral Sea Depression[]
| Tropical depression (Australian scale) | |
 | |
| Duration | January 20 – January 25 |
|---|---|
| Peak intensity | 75 km/h (45 mph) (10-min) |
On January 20, TCWC Nadi started to monitor a shallow area of low pressure that had developed within a trough of low pressure, about 600 mi (965 km) to the Northwest of Noumea in New Caledonia.[5]
The depression was last noted on January 25, as it moved below 25°S and into MetService's area of responsibility.[5][6][7]
There were no reports of any damage associated with this depression within New Caledonia, which was largely due to its small and not so intense nature of the system.[5]
Severe Tropical Cyclone Ofa[]
| Category 4 severe tropical cyclone (Australian scale) | |
| Category 4 tropical cyclone (SSHWS) | |
  | |
| Duration | January 27 – February 10 |
|---|---|
| Peak intensity | 185 km/h (115 mph) (10-min) 925 hPa (mbar) |
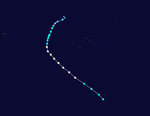
On January 27, a shallow tropical depression formed within the South Pacific Convergence Zone, about 430 km (265 mi) to the southeast of Funafuti, Tuvalu.[8] Over the next two days the system developed little and remained slow moving, near the Tuvaluan atoll of Funafuti.[8] During January 30, the depression moved towards the north-east and started to organize, as pressures near the systems center rapidly falling.[8] During the next day the system subsequently started to curve south-eastwards and away from Tuvalu, before the NWOC initiated advisories on the system and designated it as Tropical Cyclone 13P.[9][10] Late on January 31, TCWC Nadi named the tropical depression Ofa, after it had developed into a category 1 tropical cyclone on the Australian scale.[9][2] Over the few days the system moved towards the south-southeast and intensified further. Ofa subsequently passed about 110 km (70 mi) to the west of the Western Samoan Island of Savai'i between 10:00 and 18:00 UTC during February 3.[9] Early the next day as the system started to accelerate towards the south-southeast towards the island nation of Niue, the NWOC estimated that Ofa had peaked with 1-minute sustained wind speeds of 215 km/h (130 mph), which made it equivalent to a category 4 hurricane on the SSHWS.[11] Later that day TCWC Nadi also estimated that the system had peaked with 10-minute sustained wind speeds of 185 km/h (115 mph) as a category 4 severe tropical cyclone,.[2] During February 5, the system passed about 55 km (35 mi) to the west of Niue, as it started to weaken and started to transition into an extratropical cyclone.[7][9] The system completed this transition during February 8, before the remnants were last noted during February 10 after they had performed a small clockwise loop.[7]
Cyclone Ofa affected seven different island nations and caused gales or much stronger winds in six of those countries which resulted in damage ranging from moderate to very severe.[9] Storm tide from the cyclone which is the combined effect of storm surge and high tide caused havoc in several countries and was the major cause of destruction.[9] Overall the system killed at least eight people while it was estimated that the overall damage would amount to over US$180 million with damage totals of at least US$150 million and US$30 million in Western and American Samoa.[9]
Tropical Cyclone Nancy[]
| Category 1 tropical cyclone (Australian scale) | |
| Category 1 tropical cyclone (SSHWS) | |
  | |
| Duration | January 31 – February 1 |
|---|---|
| Peak intensity | 85 km/h (50 mph) (10-min) 987 hPa (mbar) |
Late on January 30, TCWC Nadi started to issue warnings on a tropical depression, that was intensifying as it moved southeastwards and approached 160°E and the South Pacific tropical cyclone basin.[12] The system subsequently moved into the basin early the next day and was named Nancy by TCWC Nadi, after it had become a category 1 tropical cyclone.[12][13] During that day the system re-curved and started to move towards the south-southwest, as it was steered around the southern extension of an upper-level trough of low pressure.[12] The system subsequently moved out of the basin during February 1, as it intensified into a category 2 tropical cyclone.[2][13] While the system was in the basin the JTWC estimated that Nancy had peak 1-minute sustained winds of 215 km/h (130 mph), which made it equivalent to a category 1 hurricane on the SSHWS.[14] The system subsequently re-entered the basin as an extratropical cyclone on February 6, before it dissipated to the west of New Zealand on February 8.[13] There was no damage associated with Nancy while it was in the basin, however it later caused 5 deaths, when it affected the Australian states of Queensland and New South Wales.[13]
Samoa Depression[]
| Tropical depression (Australian scale) | |
 | |
| Duration | February 6 – February 9 |
|---|---|
| Peak intensity | 65 km/h (40 mph) (10-min) |
On February 6, the FMS reported that a depression had developed, within the South Pacific Convergence Zone near the islands of Tuvalu.[15] Over the next few days the system was steered towards the southeast by a north-westerly steering flow on the eastern side of an upper-level trough of low pressure.[15] As the depression moved towards the southeast it passed in between Western Samoa and the northern islands of Tonga before it came very close to Niue during February 8.[15] Despite marginal gale-force winds being present in the depressions eastern quadrant, strong north-westerlies prevented the depression, from strengthening into a tropical cyclone.[15] The depression was subsequently last noted during February 9, as it was absorbed into the Westerlies.[15] The only damage that could be attributed to the depression is a number of houses that were destroyed on the Tuvaluan atoll of Vaitupu on February 6, however it is possible that the houses were destroyed by the strong and squally north-westerlies that were prevailing over the northern islands of Tuvalu at that time.[15] As Tuvalu, Western Samoa, American Samoa, Tonga, Niue had all been affected by Cyclone Ofa a few days earlier; any damage would have been difficult to assess.[15]
Severe Tropical Cyclone Peni[]
| Category 3 severe tropical cyclone (Australian scale) | |
| Category 1 tropical cyclone (SSHWS) | |
  | |
| Duration | February 12 – February 18 |
|---|---|
| Peak intensity | 120 km/h (75 mph) (10-min) 970 hPa (mbar) |
A shallow area of low-pressure began to develop near Rakahanga, an island in the Cook Island chain. The storm had also formed on the South Pacific convergence zone. The storm was first recognized on February 12, and had received tropical cyclone characteristics on the 13th. At 21:00 UTC, the storm was recognized as Tropical Cyclone Peni. The storm then took a path southwest towards the Cook Islands, Peni made a narrow turn and passed close to Aitutaki. Peni had gained hurricane status on the 15th, at 06:00 UTC. Peni had been able to keep hurricane characteristics until February 17, when it was downgraded to a storm, and soon, was declared extratropical. The name Peni was retired from the naming list.
Tropical Cyclone Hilda[]
| Category 2 tropical cyclone (Australian scale) | |
| Tropical storm (SSHWS) | |
  | |
| Duration | March 7 – March 7 |
|---|---|
| Peak intensity | 95 km/h (60 mph) (10-min) 985 hPa (mbar) |
During March 7, Tropical Cyclone Hilda moved into the basin from the Australian region, as a category 2 tropical cyclone while it was located about 640 km (400 mi) to the northeast of Noumea, New Caledonia.[2][16] During that day, the system passed about 640 km (400 mi) to the south-west of New Caledonia, as it moved south-southwestwards and degenerated into an extratropical depression.[16] Over the next couple of days, the system moved through the Tasman Sea and passed near New Zealand's South Island, before it was absorbed into a high-latitude trough of low pressure.[7]
Tropical Cyclone Rae[]
| Category 2 tropical cyclone (Australian scale) | |
| Tropical storm (SSHWS) | |
  | |
| Duration | March 16 – March 24 |
|---|---|
| Peak intensity | 95 km/h (60 mph) (10-min) 985 hPa (mbar) |
During March 16, the FMS started to monitor a shallow tropical depression, that had developed within the South Pacific Convergence Zone in between Vanuatu and Fiji.[7][17] Over the next couple of days, the system caused strong winds and heavy rain over the island nation of Tuvalu, as it slowly moved south-eastwards, before it passed around 110 km (70 mi) to the east of Rotuma.[18] During March 19, Rae started to impact Fiji with heavy rain and strong winds as it slowed down and started to move south-westwards, before it passed around 75 km (45 mi) to the west of the Yasawa Islands during March 20.[18] The depression continued to move south-westwards for the next 30 hours, before it curved southwards as it started to intensify slowly.[7][18] During March 22, the JTWC initiated advisories on the system and designated it as Tropical Cyclone 26P, before the FMS named the system Rae later that day, after it had accelerated eastwards.[10][18]
The JTWC and the FMS both estimated during March 23, that the system had peaked with winds of 95 km/h (60 mph), which made it a Category 2 tropical cyclone on the Australian Scale.[19] At this time, the system was located about 225 km (140 mi) to the south of Kadavu in Fiji and had started to move south-eastwards towards higher latitudes.[18][19] Rae subsequently weakened as it experienced stronger vertical windshear and cooler sea surface temperatures, which caused the system to weaken and loose its tropical characteristics.[18] The system degenerated into a depression during March 24, as it maintained its south-eastwards track, before it dissipated to the south of Niue during the next day.[7] The system impacted Fiji between March 19 - 24, where it caused strong winds and landslides, as well as minor damage to trees, houses and crops.[18] Torrential rain associated with the system helped to ease a drought and caused flooding to be reported across the archipelago.[18][20] Within the island nation, the floods were responsible for three deaths in flooded rivers, as well as disruption to transport services, water and electricity supplies.[18][20] Between March 23 - 24, Rae caused strong winds and high seas at the wave rider buoy at Tongatapu, Tonga, where waves of 6 m (20 ft) were recorded as the winds changed direction.[21]
Other systems[]
On March 15, the precursor shallow tropical depression to Cyclone Ivor developed within the South Pacific convergence zone, about 390 km (240 mi) to the northeast of Port Villa in Vanuatu.[22] During that day, the low moved towards the southwest and moved into the Australian region where it developed into Tropical Cyclone Ivor during March 16.[22]
Season effects[]
This table lists all the storms that developed in the South Pacific basin during the 1989–90 season. It includes their intensity on the Australian Tropical cyclone intensity scale, duration, name, areas affected, deaths, and damages.
| Name | Dates active | Peak classification | Sustained wind speeds |
Pressure | Areas affected | Damage (USD) |
Deaths | Refs |
|---|---|---|---|---|---|---|---|---|
| Cook Islands | November 8 – 10 | Tropical Depression | Not Specified | Not Specified | Southern Cook Islands | |||
| Samoa | December 14 – 17 | Tropical Depression | Not Specified | Not Specified | Samoan Islands | |||
| Felicity | December 19 – 22 | Tropical Depression | 75 km/h (45 mph) | 990 hPa (29.24 inHg) | Norfolk Island | |||
| Coral Sea | January 20 – 25 | Tropical Depression | 75 km/h (45 mph) | Not Specified | New Caledonia | None | None | [6] |
| Ofa | January 27 – February 10 | Category 4 severe tropical cyclone | 185 km/h (115 mph) | 925 hPa (27.32 inHg) | Polynesia | $187 million | 8 | [9] |
| Nancy | January 31 – February 1 | Category 1 tropical cyclone | 85 km/h (50 mph) | 987 hPa (29.14 inHg) | None | None | None | [12] |
| Samoa | February 6 – 9 | Tropical Depression | 65 km/h (40 mph) | Not Specified | Polynesia | Unknown | None | [15] |
| Peni | February 12 – 18 | Category 3 severe tropical cyclone | 120 km/h (75 mph) | 970 hPa (28.64 inHg) | Cook Islands | |||
| Hilda | March 7 – 9 | Category 2 tropical cyclone | 95 km/h (60 mph) | 985 hPa (29.10 inHg) | Tuvalu, Vanuatu, New Caledonia | |||
| Ivor | March 14 – 16 | Tropical Depression | Not Specified | Not Specified | None | None | None | [22] |
| Rae | March 16 – 25 | Category 2 tropical cyclone | 95 km/h (60 mph) | 985 hPa (29.10 inHg) | Tuvalu, Fiji, Tonga | 3 | [18] | |
| Season aggregates | ||||||||
| 11 systems | November 8 – March 25 | 185 km/h (115 mph) | 925 hPa (27.32 inHg) | >$187 million | 11 | |||
Notes[]
- ^ An average season has nine tropical cyclones, about half of which become severe tropical cyclones.
- ^ TCWC Nadi warned on systems in the South Pacific which is located from the equator to 25°S and from 160°E to 120°W. TCWC Wellington warns on systems from 25°S to 40°S and from 160°E to 120°W
- ^ TCWC Nadi warned on systems in the South Pacific located from the Equator to 25°S and from 160°E to 120°W. TCWC Wellington warns on systems from 25°S to 40°S and from 160°E to 120°W
References[]
- ^ a b RA V Tropical Cyclone Committee (November 3, 2021). Tropical Cyclone Operational Plan for the South-East Indian Ocean and the Southern Pacific Ocean 2021 (PDF) (Report). World Meteorological Organization. pp. I-4–II-9 (9–21). Retrieved November 11, 2021.
- ^ a b c d e f MetService (May 22, 2009). "TCWC Wellington Best Track Data 1967–2006". International Best Track Archive for Climate Stewardship.[permanent dead link]
- ^ a b c Tropical Cyclone Felicity (Report). Australian Bureau of Meteorology. Archived from the original on April 7, 2012. Retrieved April 7, 2012.
- ^ Singh, Arveen K (Summer 1990). DeAngellis, Richard M (ed.). "Tropical depression in Coral Sea (former T.C. Felicity), December 18–20, 1989". Mariners Weather Log. 34 (3): 48. hdl:2027/uiug.30112104094245.
- ^ a b c Waqaicelua, Alipate; Fiji Meteorological Service (Fall 1990). DeAngellis, Richard M (ed.). "Coral Sea Depression". Mariners Weather Log. United States National Oceanic and Atmospheric Administration's National Oceanographic Data Service. 34 (4): 49. hdl:2027/uiug.30112104094252.
- ^ a b Darwin Regional Specialised Meteorological Centre (1990). Darwin Tropical Diagnostic Statement: January 1990 (PDF) (Report). Vol. 09. Australian: Bureau of Meteorology. p. 2. ISSN 1321-4233. Archived from the original (PDF) on October 17, 2014. Retrieved April 6, 2012.
- ^ a b c d e f g Ready, Steve; Woodcock, Frank (1992). "The South Pacific and Southeast Indian Ocean tropical cyclone season 1989–90" (PDF). Australian Meteorological Magazine. 40: 111–121.
- ^ a b c Fiji Meteorological Service (Summer 1990). DeAngellis, Richard M (ed.). Tropical Cyclone Ofa (Mariners Weather Log). Vol. 34. United States National Oceanic and Atmospheric Administration's National Oceanographic Data Service. pp. 23–25. hdl:2027/uiug.30112104094245. ISSN 0025-3367. OCLC 648466886.
- ^ a b c d e f g h Prasad, Rajendra (May 3, 1990). Tropical Cyclone Ofa, January 31 - February 7, 1990 (PDF) (Tropical Cyclone Report 90/4). Fiji Meteorological Service. Archived from the original (PDF) on February 13, 2014. Retrieved May 12, 2014.
- ^ a b Annual Tropical Cyclone Report: 1990 (PDF) (Report). United States Joint Typhoon Warning Center. Retrieved December 21, 2021.
- ^ Naval Pacific Meteorology and Oceanography Center; Joint Typhoon Warning Center. "Tropical Cyclone 13P (Ofa) best track analysis". United States Navy, United States Air Force. Retrieved March 13, 2013.
- ^ a b c d Koop, Neville L (May 3, 1990). Tropical Cyclone Nancy, 27 January - 4 February (Tropical Cyclone Report). Fiji Meteorological Service. Archived from the original on April 29, 2013. Retrieved May 27, 2014.
- ^ a b c d Tropical Cyclone Nancy (Report). Australian Bureau of Meteorology. Archived from the original on May 27, 2014. Retrieved May 27, 2014.
- ^ Joint Typhoon Warning Center; Naval Pacific Meteorology and Oceanography Center. "Tropical Cyclone 12P best track analysis". United States Navy, United States Air Force. Retrieved May 29, 2014.
- ^ a b c d e f g h Koop, Neville L; Fiji Meteorological Service (1991). DeAngellis, Richard M (ed.). Samoa Depression (Mariners Weather Log: Volume 35, Issue 1: Winter 1991). United States National Oceanic and Atmospheric Administration's National Oceanographic Data Service. p. 53. hdl:2027/uiug.30112104094104. ISSN 0025-3367. OCLC 648466886.
- ^ a b Singh, M. Manoj (April 9, 1990). Tropical Cyclone Report 90/2: Tropical Cyclone Hilda March 4 - 8, 1990 (Report). Fiji Meteorological Service.
- ^ Darwin Tropical Diagnostic Statement: March 1990 (PDF) (Report). Australian Bureau of Meteorology. 1990. Archived from the original (PDF) on March 4, 2016.
- ^ a b c d e f g h i j Prasad, Rajendra. Tropical Cyclone Rae, March 17–24 (Tropical Cyclone Report 90/3). Fiji Meteorological Service. Archived from the original on April 29, 2013. Retrieved August 8, 2013.
- ^ a b "1990 Tropical Cyclone Rae (1990076S12165)". International Best Track Archive for Climate Stewardship. Retrieved December 27, 2021.
- ^ a b McGree, Simon; Yeo, Stephen W; Devi, Swastika (October 1, 2010). Flooding in the Fiji Islands between 1840 and 2009 (PDF) (Report). Risk Frontiers. p. 37. Archived from the original (PDF) on July 12, 2020. Retrieved December 27, 2021.
- ^ Barstow, Stephen; Haug, Ola. The Wave Climate of the Kingdom of Tonga (PDF) (Report). South Pacific Applied Geoscience Commission. Retrieved December 27, 2021.
- ^ a b c Brisbane Tropical Cyclone Warning Center. Severe Tropical Cyclone Ivor (Report). Australian Bureau of Meteorology. Archived from the original on April 7, 2012. Retrieved April 7, 2012.
External links[]

- 1989–90 South Pacific cyclone season
- South Pacific cyclone seasons