1989–90 Australian region cyclone season
| 1989–90 Australian region cyclone season | |
|---|---|
 Season summary map | |
| Seasonal boundaries | |
| First system formed | July 14, 1989 |
| Last system dissipated | April 18, 1990 |
| Strongest storm | |
| Name | Alex |
| • Maximum winds | 220 km/h (140 mph) (10-minute sustained) |
| • Lowest pressure | 927 hPa (mbar) |
| Seasonal statistics | |
| Tropical lows | 14 |
| Tropical cyclones | 14 |
| Severe tropical cyclones | 5 |
| Total fatalities | Unknown |
| Total damage | Unknown |
| Related articles | |
The 1989–90 Australian region cyclone season was an above average tropical cyclone season. It was also an event in the ongoing cycle of tropical cyclone formation. It ran from 1 November 1989 to 30 April 1990. The regional tropical cyclone operational plan also defines a tropical cyclone year separately from a tropical cyclone season, and the "tropical cyclone year" ran from 1 July 1989 to 30 June 1990.
Tropical cyclones in this area were monitored by four Tropical Cyclone Warning Centres (TCWCs): the Australian Bureau of Meteorology in Perth, Darwin, and Brisbane; and TCWC Port Moresby in Papua New Guinea.
Seasonal summary[]

Systems[]
Tropical Storm 02S[]
| Tropical storm (SSHWS) | |
  | |
| Duration | July 14 – July 16 |
|---|---|
| Peak intensity | 65 km/h (40 mph) (1-min) 997 hPa (mbar) |
Tropical Storm 02S existed from July 14 to July 16.
Tropical Cyclone Pedro[]
| Category 2 tropical cyclone (Australian scale) | |
| Category 1 tropical cyclone (SSHWS) | |
  | |
| Duration | November 4 – November 13 |
|---|---|
| Peak intensity | 110 km/h (70 mph) (10-min) 982 hPa (mbar) |
At 0:00 UTC on November 6, the BOM detected an area of low pressure within a monsoonal trough near 7.8°S, 97.2°E., which gradually organized while drifting westward for the next couple of days. On November 8, the disturbance strengthened into a tropical cyclone and was named Pedro. The cyclone continued to intensify before reaching its peak intensity at 13:00 UTC on November 10 with 10-minute sustained winds of around 70 mph (110 km/h) and a minimum pressure of 982 mbar (28.99 inHg), with a short-lived eye visible on satellite imagery. As Pedro moved southward, strong vertical wind shear left the low-level center bare and displaced convection to the northwestern side of the storm. At 0:00 UTC on November 13, Pedro's winds weakened below gale-force and the system degenerated into a remnant system, which dissipated the following day.[1]
Pedro passed within 85 miles (140 km)[nb 1] of Cocos Island, where a peak wind gust of around 85 mph (137 km/h) was recorded. At least 7.9 inches (202 mm) of precipitation fell on the island within a 24-hour period, causing localized flooding. A palm plantation and loading wharf were damaged by the storm.[1]
Severe Tropical Cyclone Felicity[]
| Category 3 severe tropical cyclone (Australian scale) | |
| Category 1 tropical cyclone (SSHWS) | |
  | |
| Duration | 13 December – 20 December |
|---|---|
| Peak intensity | 140 km/h (85 mph) (10-min) 975 hPa (mbar) |
On 13 December, the BoM started to monitor a monsoon low, that had developed within the Arafura Sea to the northeast of Darwin.[2] Over the next day, the system moved southeastwards over the Northern Territory, before it re-curved slightly and entered the Gulf of Carpentaria.[2] Early on 15 December, the system was named Felicity by TCWC Brisbane, after it had become a category 1 tropical cyclone on the Australian Scale.[2] During that day the JTWC initiated advisories on the system and designated it as Tropical Cyclone 07P, with peak 1-minute sustained wind speeds of 110 km/h (70 mph).[3] TCWC Brisbane subsequently reported peak 10-minute sustained wind speeds of 110 km/h (70 mph), before the system made landfall over the Cape York Peninsula where it weakened below cyclone intensity.[2] The system subsequently moved into the Coral Sea during 16 December, where it started to rapidly deepen, but did not reattain the classical characteristics of a tropical cyclone.[2][4] As a result, both TCWC Nadi and TCWC Brisbane treated the system as a tropical depression over the next four days despite winds of between 110 and 115 km/h (68 and 71 mph) being observed in the southwest quadrant.[2][4] Felicity subsequently dissipated during 20 December as it was absorbed by a short-wave trough of low pressure to the north of New Zealand.[2][4] Some minor damage to vegetation was recorded on the Cape York Peninsula.[2][4]
Tropical Cyclone Rosita[]
| Category 1 tropical cyclone (Australian scale) | |
  | |
| Duration | January 4 – January 17 |
|---|---|
| Peak intensity | 85 km/h (50 mph) (10-min) 988 hPa (mbar) |
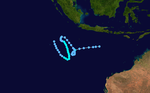
Rosita was first noted as a low-pressure system at 18:00 UTC on January 4 while it located well south of Java. Moving swiftly westward, the disturbance gradually organized for two days until slightly weakening due to increasing vertical wind shear. The system remained quasi-stationary until January 9 when a developing ridge in the middle-latitudes forced the disturbance northwestward. The low was ill-defined with a weak and sheared structure on satellite imagery while moving equatorward. By 6:00 UTC the following day, convection began to redevelop and consolidate through January 12 as the disturbance strengthened.[5]
At 15:00 UTC on January 13, tropical storm-force winds formed around the center, prompting the BOM to upgrade the low into Tropical Cyclone Rosita. The nascent cyclone tracked south-southeastward, remaining under the influence of vertical wind shear causing majority of convection to be displaced west of the center. Rosita once again changed course late the next day, shifting northwestward as it lost gale-force winds. The remnants tracked around the periphery of the more intense Severe Tropical Cyclone Sam, before moving equatorward and dissipating on January 17.[5]
Severe Tropical Cyclone Sam[]
| Category 3 severe tropical cyclone (Australian scale) | |
| Category 1 tropical cyclone (SSHWS) | |
  | |
| Duration | January 11 – January 21 |
|---|---|
| Peak intensity | 130 km/h (80 mph) (10-min) 966 hPa (mbar) |
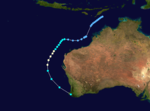
Sam, 11 to 21 January 1990, near Western Australia
Tropical Cyclone Tina[]
| Category 2 tropical cyclone (Australian scale) | |
| Category 1 tropical cyclone (SSHWS) | |
  | |
| Duration | January 24 – January 29 |
|---|---|
| Peak intensity | 95 km/h (60 mph) (10-min) 972 hPa (mbar) |
Tina, 24 to 29 January 1990, crossed Western Australia
Tropical Cyclone Nancy[]
| Category 2 tropical cyclone (Australian scale) | |
| Category 1 tropical cyclone (SSHWS) | |
  | |
| Duration | January 26 – February 4 |
|---|---|
| Peak intensity | 95 km/h (60 mph) (10-min) 975 hPa (mbar) |
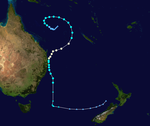
In late January, a monsoon trough spawned a tropical depression on 26 January, over the Coral Sea. The depression developed good outflow, before gaining tropical cyclone characteristic on 31 January, and was designated as Tropical Cyclone Nancy. An upper-level trough forced the storm southward, before shifting southwestward. At 3:00 UTC on 1 February, Nancy reached its peak intensity with 10-minute sustained winds of around 60mph (110 km/h) and a minimum pressure of 975 mbar. Between 1–2 February, the cyclone gradually moved just offshore the Brisbane area. Nancy then weakened while continuing to move southward, before transitioning into an extratropical low on 4 February. The remnants eventually dissipated to the west of New Zealand on 8 February.[6]
Nancy caused flash floods responsible for five fatalities.[7]
Severe Tropical Cyclone Vincent[]
| Category 3 severe tropical cyclone (Australian scale) | |
| Category 1 tropical cyclone (SSHWS) | |
  | |
| Duration | February 25 – March 6 |
|---|---|
| Peak intensity | 130 km/h (80 mph) (10-min) 965 hPa (mbar) |
Vincent, 25 February to 6 March 1990, near Western Australia
Tropical Cyclone Greg[]
| Category 1 tropical cyclone (Australian scale) | |
| Tropical depression (SSHWS) | |
  | |
| Duration | February 28 – March 5 |
|---|---|
| Peak intensity | 75 km/h (45 mph) (10-min) 990 hPa (mbar) |
Greg, 28 February to 5 March 1990, Gulf of Carpentaria
Tropical Cyclone Walter–Gregoara[]
| Category 2 tropical cyclone (Australian scale) | |
| Tropical storm (SSHWS) | |
  | |
| Duration | March 4 – March 13 (Exited basin) |
|---|---|
| Peak intensity | 95 km/h (60 mph) (10-min) 985 hPa (mbar) |
Walter, 3 to 27 March 1990, Indian Ocean
Tropical Cyclone Hilda[]
| Category 2 tropical cyclone (Australian scale) | |
| Tropical storm (SSHWS) | |
  | |
| Duration | March 4 – March 7 |
|---|---|
| Peak intensity | 110 km/h (70 mph) (10-min) 970 hPa (mbar) |
Cyclone Hilda had cloud tops estimated at 62,000 feet tall. The measured cloud top temperature was -152 °F, which is the coldest cloud-top temperature ever measured.
Severe Tropical Cyclone Alex[]
| Category 5 severe tropical cyclone (Australian scale) | |
| Category 4 tropical cyclone (SSHWS) | |
  | |
| Duration | March 14 – March 26 |
|---|---|
| Peak intensity | 220 km/h (140 mph) (10-min) 927 hPa (mbar) |
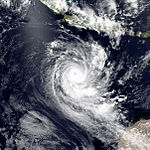
Alex was a fairly intense system. It existed from 14 to 26 March 1990. Despite the intensity, Alex never caused significant damage.
Severe Tropical Cyclone Ivor[]
| Category 4 severe tropical cyclone (Australian scale) | |
| Category 1 tropical cyclone (SSHWS) | |
  | |
| Duration | March 14 – March 26 |
|---|---|
| Peak intensity | 165 km/h (105 mph) (10-min) 965 hPa (mbar) |
Ivor, 14 to 26 March 1990, crossed Cape York, Queensland
Tropical Cyclone Bessi[]
| Category 1 tropical cyclone (Australian scale) | |
| Tropical storm (SSHWS) | |
  | |
| Duration | April 11 – April 18 |
|---|---|
| Peak intensity | 75 km/h (45 mph) (10-min) 990 hPa (mbar) |
Bessi, 11 to 18 April 1990, Indian Ocean
Notes[]
- ^ This calculation is rounded to the nearest tenth, which is why it may differ from others.
See also[]
- List of Southern Hemisphere tropical cyclone seasons
- Atlantic hurricane seasons: 1989, 1990
- Pacific hurricane seasons: 1990, 1990
- Pacific typhoon seasons: 1989, 1990
- North Indian Ocean cyclone seasons: 1989, 1990
References[]
- ^ a b "Tropical Cyclone Pedro". Bureau of Meteorology. Retrieved May 9, 2021.
- ^ a b c d e f g h Tropical Cyclone Felicity (Report). Australian Bureau of Meteorology. Archived from the original on 7 April 2012. Retrieved 26 May 2014.
- ^ Joint Typhoon Warning Center; Naval Pacific Meteorology and Oceanography Center. Annual Tropical Cyclone Report: 1990 (PDF) (Report). United States Navy, United States Air Force. p. 234. Retrieved 26 May 2014.
- ^ a b c d Singh, Arveen K; Fiji Meteorological Service (Summer 1990). DeAngellis, Richard M (ed.). "Tropical depression in Coral Sea (former T.C. Felicity), December 18–20, 1989" (Mariners Weather Log). 34 (3). United States National Oceanic and Atmospheric Administration's National Oceanographic Data Service: 48. hdl:2027/uiug.30112104094245. Cite journal requires
|journal=(help) - ^ a b "Tropical Cyclone Rosita" (PDF). Bureau of Meteorology. Retrieved May 9, 2021.
- ^ "Tropical Cyclone Nancy". Bureau of Meteorology. Retrieved January 22, 2021.
- ^ "EMA Disasters Database". Archived from the original on 2011-09-27.
- 1989–90 Australian region cyclone season
- Australian region cyclone seasons
- 1989–90 Southern Hemisphere tropical cyclone season