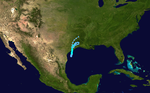
1989 Atlantic hurricane season
| 1989 Atlantic hurricane season | |
|---|---|
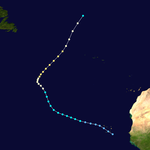
 Season summary map | |
| Seasonal boundaries | |
| First system formed | June 15, 1989 |
| Last system dissipated | December 4, 1989 |
| Strongest storm | |
| Name | Hugo |
| • Maximum winds | 160 mph (260 km/h) (1-minute sustained) |
| • Lowest pressure | 918 mbar (hPa; 27.11 inHg) |
| Seasonal statistics | |
| Total depressions | 15 |
| Total storms | 11 |
| Hurricanes | 7 |
| Major hurricanes (Cat. 3+) | 2 |
| Total fatalities | 136 total |
| Total damage | $11 billion (1989 USD) |
| Related articles | |
The 1989 Atlantic hurricane season was an average season with 11 named storms. The season officially began on June 1, and ended on November 30.[1][2] The first storm, Tropical Depression One, developed on June 15, and dissipated two days later without effects on land. Later that month, Tropical Storm Allison caused severe flooding, especially in Texas and Louisiana. Tropical Storm Barry, Tropical Depressions Six, Nine, and Thirteen, and Hurricanes Erin and Felix caused negligible impact. Hurricane Gabrielle and Tropical Storm Iris caused light effects on land, with the former resulting in nine fatalities from rip currents offshore the East Coast of the United States and Atlantic Canada, while the latter produced minor flooding in the United States Virgin Islands.
The most notable storm of the season was the costliest tropical cyclone in the Atlantic basin at the time, Hurricane Hugo, a Category 5 hurricane that caused $9.47 billion (1989 USD)[nb 1] in damage and 88 fatalities as it ravaged the Lesser Antilles and the United States, especially the state of South Carolina. Hugo ranked as the costliest Atlantic hurricane until Hurricane Andrew in 1992, and has since fallen further due to destructive storms in the 2000s and 2010s.[3] Few other storms in 1989 caused significant damage; hurricanes Chantal and Jerry both resulted in flooding and wind impacts in Texas. Hurricane Dean also caused light damage in Bermuda and the Canadian province of Newfoundland. Tropical Storm Karen, the final storm of the season, brought heavy rainfall and a tornado to Cuba, before dissipating on December 4. Overall, the storms of the season collectively caused 136 fatalities and at least $10.2 billion in damage.
Seasonal Forecasts[]
Pre-season forecasts[]
| Source | Date | Named storms |
Hurricanes | Major hurricanes |
| WRC[4] | 1989 | 10 | 6 | N/A |
| CSU[1] | May 31, 1989 | 7 | 4 | N/A |
| Record high activity | 30 | 15 | 7 | |
| Record low activity | 1 | 0 (tie) | 0 | |
| Actual activity | 11 | 7 | 2 | |
Forecasts of hurricane activity are issued before each hurricane season by noted hurricane experts such as Dr. William M. Gray and his associates at Colorado State University (CSU). A normal season as defined by the National Oceanic and Atmospheric Administration (NOAA), has eleven named storms, of which six reach hurricane strength and two of those become major hurricanes.[nb 2][6] On May 31, 1989, the CSU forecast that there would be seven named storms, four of which would intensify into a hurricane; there was no prediction of the number of major hurricanes.[1] Prior to the season, the Weather Research Center (WRC) in Houston, Texas also issued a forecast, which called for ten named storms and six hurricanes.[4]
Season summary[]

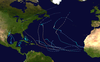
The Atlantic hurricane season officially began on June 1, 1989.[1] It was an above average season in which 15 tropical depressions formed. Eleven depressions attained tropical storm status, and seven of these attained hurricane status. Two hurricanes further intensified into major hurricanes. The season was above average most likely because of relatively small amounts of dust within the Saharan Air Layer. Four hurricanes and one tropical storm made landfall during the season[7] and caused 124 deaths and at least $10.2 billion in damage.[8][9][10][11][12][13][14][15][16][17][18] The last storm of the season, Tropical Storm Karen, dissipated on December 4,[7] four days after the official end of the season on November 30.[2]
Tropical cyclogenesis in the 1989 Atlantic hurricane season began with a tropical depression developing on June 16. Later that month, another tropical depression developed, and intensified, eventually becoming Tropical Storm Allison. After June, the month of July was slightly more active with three tropical depressions developing; however, the latter two (Hurricane Chantal and Hurricane Dean) did not form until extremely late in the month. August was the most active month of the season, with a total of seven tropical cyclones either existing or developing in that period.[7] Although September is the climatological peak of hurricane season,[2] only two tropical cyclones developed in that month, which later become Hurricane Hugo and Tropical Storm Iris. Two tropical cyclones also developed in October, and the latter one in that month eventually became Hurricane Jerry. Finally, one tropical cyclone developed in November; it eventually became Tropical Storm Karen and lasted until December 4.[7]
The season's activity was reflected with a cumulative accumulated cyclone energy (ACE) rating of 135,[5] which is classified as "above normal".[6] ACE is, broadly speaking, a measure of the power of the hurricane multiplied by the length of time it existed, so storms that last a long time, as well as particularly strong hurricanes, have high ACEs. It is only calculated for full advisories on tropical systems at or exceeding 39 mph (63 km/h), which is tropical storm intensity.[19]
Systems[]
Tropical Depression One[]
| Tropical depression (SSHWS) | |
  | |
| Duration | June 15 – June 17 |
|---|---|
| Peak intensity | 30 mph (45 km/h) (1-min) 1007 mbar (hPa) |
A frontal system developed into Tropical Depression One at 1800 UTC on June 15,[20][21] while located about 160 miles (260 km) northeast of Veracruz, Veracruz. The depression initially headed northeastward, before curving southward on June 16. It peaked with winds of 30 mph (50 km/h). Early on June 17, the depression dissipated about 85 miles (140 km) northeast of Coatzacoalcos, Veracruz.[20]
Tropical Storm Allison[]
| Tropical storm (SSHWS) | |
  | |
| Duration | June 24 – June 27 |
|---|---|
| Peak intensity | 50 mph (85 km/h) (1-min) 999 mbar (hPa) |
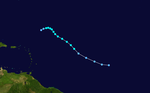
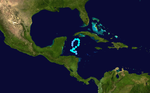
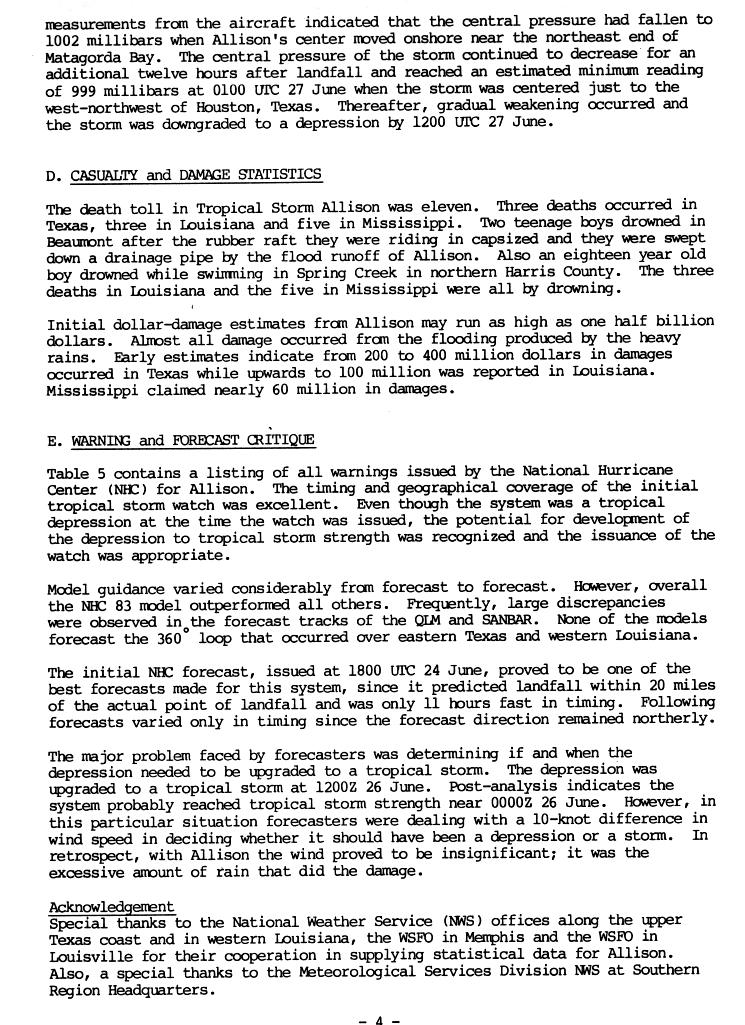
The second tropical depression developed on June 24 in the northwestern Gulf of Mexico, from the interaction of a tropical wave and the remnants of eastern Pacific Hurricane Cosme. Heading northward, it slowly intensified, becoming Tropical Storm Allison early on June 26.[22] Allison continued to slowly intensify, and made landfall near Freeport with winds of 50 mph (80 km/h) on the following day. Moving inland, Allison rapidly weakened over eastern Texas, and transitioned into an extratropical storm on June 28. Although it rapidly became extratropical over land, the remnants of Allison meandered over the Southern United States and reached as far north as Indiana. The remnants turned south and then west-northwest after reaching Mississippi, before finally dissipating over Arkansas on July 7.[23]
Allison caused significant flooding in several states, especially Louisiana and Texas. Precipitation from the storm peaked at 25.27 inches (642 mm) in Winnfield, Louisiana.[24] As a result, more than 1,200 structures in Louisiana were flooded and over 430,000 acres of crops were ruined, mostly soybeans and cotton. Three drowning fatalities were also reported. Several tornadoes were spawned in the state, the worst occurred in Ouachita Parish. It destroyed 5 homes, severely damaged 10 others, and inflicted minor impact on 100 houses. In Texas, flooding was more severe. More than 6,200 homes received water damage, forcing hundreds of residents to evacuate and stranding thousands of other people.[25] Three deaths occurred in Texas, all of which were teenage boys that drowned. In Mississippi, the storm caused $60 million in losses and five drowning deaths. Widespread, but mostly minor flooding was reported elsewhere in the Eastern United States. Overall, damage was estimated to have reached $360–560 million and 11 people were killed.[8]
Tropical Storm Barry[]
| Tropical storm (SSHWS) | |
  | |
| Duration | July 9 – July 14 |
|---|---|
| Peak intensity | 50 mph (85 km/h) (1-min) 1005 mbar (hPa) |
A tropical wave emerged into the Atlantic Ocean from the west coast of Africa on July 7. The wave quickly developed a low-level circulation by July 9 and was designated Tropical Depression Three at 1800 UTC, while located about midway between Africa and the Lesser Antilles. The depression moved northwestward in response to an area of high pressure located north of the Azores. The depression strengthened and was upgraded to Tropical Storm Barry on July 11. It slowly intensified and reached its peak intensity of 50 mph (80 km/h) the next day. By July 13, Barry weakened back to a depression and dissipated shortly after while located 545 miles (880 km) northeast of the Lesser Antilles.[26]
Hurricane Chantal[]
| Category 1 hurricane (SSHWS) | |
  | |
| Duration | July 30 – August 3 |
|---|---|
| Peak intensity | 80 mph (130 km/h) (1-min) 984 mbar (hPa) |
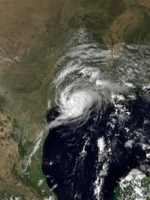
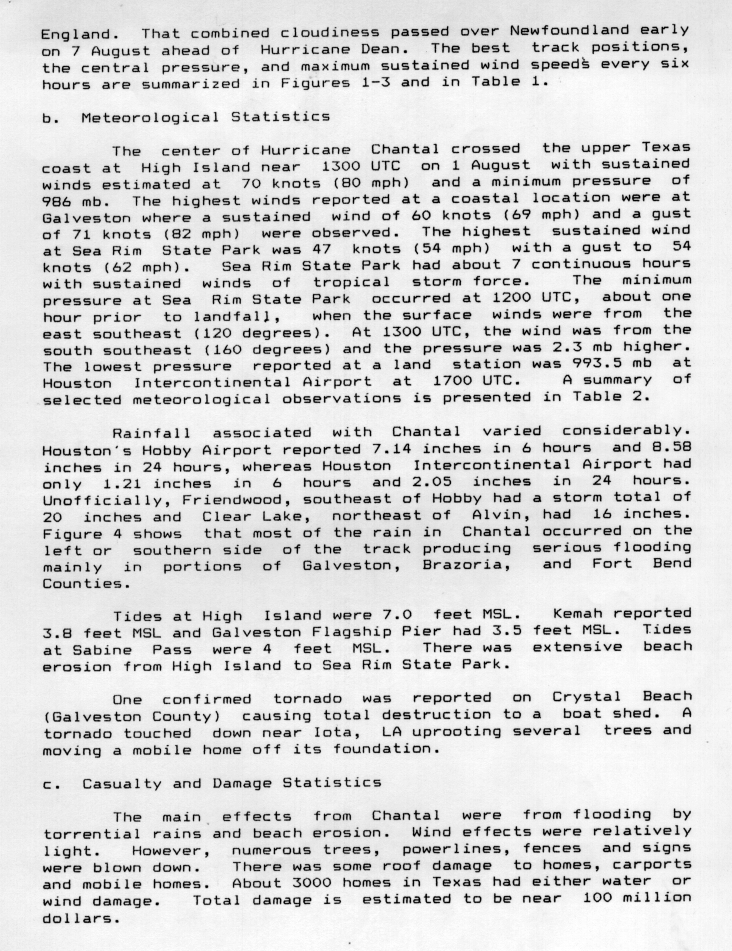
In late July, a tropical disturbance within the Intertropical Convergence Zone (ITCZ) was first observed near Trinidad and Tobago. The disturbance later reached the Gulf of Mexico and developed into a tropical depression on July 30. While heading north-northwestward, the depression intensified and was upgraded to Tropical Storm Chantal on the following day. Thereafter, Chantal quickly strengthened and became a hurricane on August 1. After intensifying slightly further, it made landfall near High Island, Texas later that day. The storm quickly weakened upon moving inland and fell to tropical storm intensity a few hours after landfall. Early on August 2, Chantal weakened to a tropical depression and dissipated over Oklahoma by August 4.[27]
While making landfall in Texas, the storm produced relatively small tides, with most locations reporting waves less than 4 feet (1.2 m) in height. However, some locations experienced extensive beach erosion.[28] In addition, there were numerous rescues made by the U.S. Coast Guard.[29] Due to both rainfall and high winds at least 3,000 homes were damaged, and numerous trees and sign were knocked down. Two tornadoes were reported, with one wrecking a shed in Crystal Beach, Texas, and the other knocking over several trees and mobile homes in Iota, Louisiana. Elsewhere, Chantal and its remnants brought light to moderate rainfall to several other states, although affects were minor in other states.[28] Overall, 13 fatalities occurred, all of which due to drowning,[29] and at least $100 million in damage was reported.[28]
Hurricane Dean[]
| Category 2 hurricane (SSHWS) | |
  | |
| Duration | July 31 – August 8 |
|---|---|
| Peak intensity | 105 mph (165 km/h) (1-min) 968 mbar (hPa) |
A tropical wave developed into Tropical Depression Five on July 31, while situated about halfway between Cape Verde and the Lesser Antilles. The following day, the depression intensified into Tropical Storm Dean. Heading generally west-northwestward, Dean intensified into a hurricane on August 2. The storm remained a Category 1 hurricane as it curved northward, bypassing the Lesser Antilles. Tracking northward, Dean accelerated and intensified into a Category 2 hurricane while bypassing Bermuda late on August 6. Thereafter, Dean turned northeastward and weakened to a tropical storm, before making landfall in southern Newfoundland on August 8. The storm continued in the northeast direction and lost tropical characteristics south of Greenland on the following day.[30]
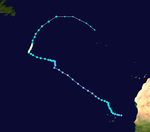
As Dean approached the Lesser Antilles, heavy rainfall and strong winds were reported in Antigua and Barbuda. However, no damage was reported. In Bermuda, winds gusted up to 113 mph (182 km/h) and 3–5 inches (76.2–127 mm) of precipitation fell. Although Dean caused no fatalities, 16 people were injured. According to insurance claims, the storm damaged 648 buildings, 72 boats, 36 vehicles, and one pier. Additionally, strong winds downed power lines, leaving 65,000 people without electricity. Overall, damage on the island was approximately $8.9 million, with $3.9 million incurred at the Naval Air Station Bermuda Annex. Storm surge up to 1.7 feet (0.52 m) occurred in India, though no significant erosion was reported.[31] In Atlantic Canada, light to moderate rainfall was reported, and tropical storm force winds were observed in some areas.[32] Furthermore, waves at 26 ft (7.92 m) were reported on Sable Island.[33]
Tropical Depression Six[]
| Tropical depression (SSHWS) | |
  | |
| Duration | August 8 – August 17 |
|---|---|
| Peak intensity | 35 mph (55 km/h) (1-min) |
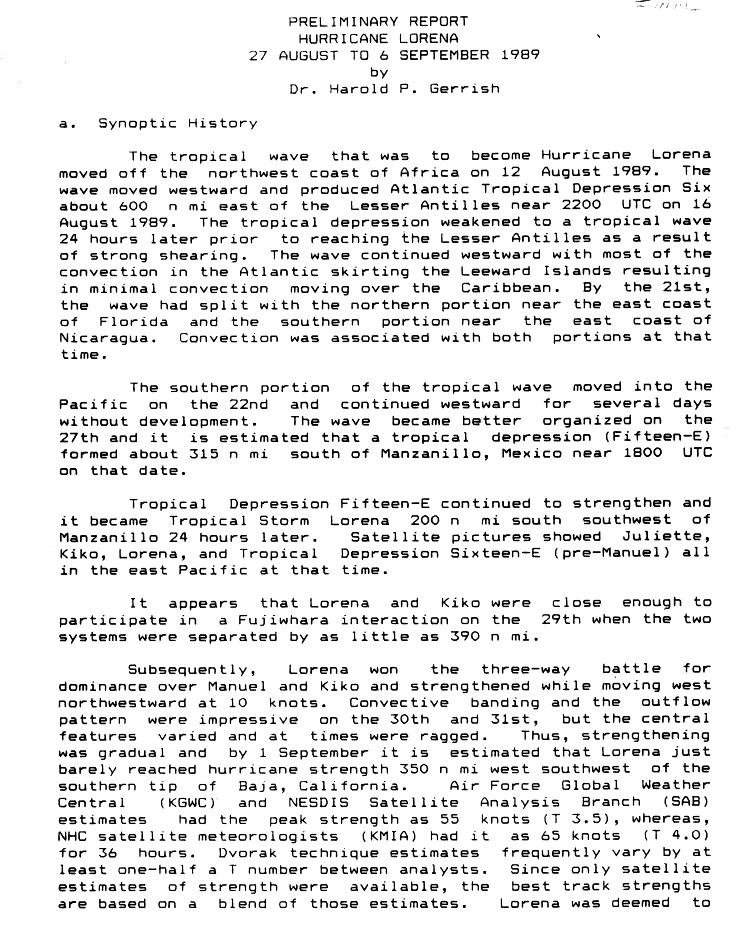
A tropical wave developed into Tropical Depression Six on August 8, while located about 125 miles (200 km) east of easternmost islands of Cape Verde.[20] While approaching the Lesser Antilles, a tropical storm watch was issued. However, an upper-level low increased wind shear on the system.[21] As a result, the depression degenerated into a tropical wave on August 17. The wave eventually split in two, with the southern part eventually becoming Hurricane Lorena in the eastern Pacific Ocean.[34]
Hurricane Erin[]
| Category 2 hurricane (SSHWS) | |
  | |
| Duration | August 18 – August 27 |
|---|---|
| Peak intensity | 105 mph (165 km/h) (1-min) 968 mbar (hPa) |
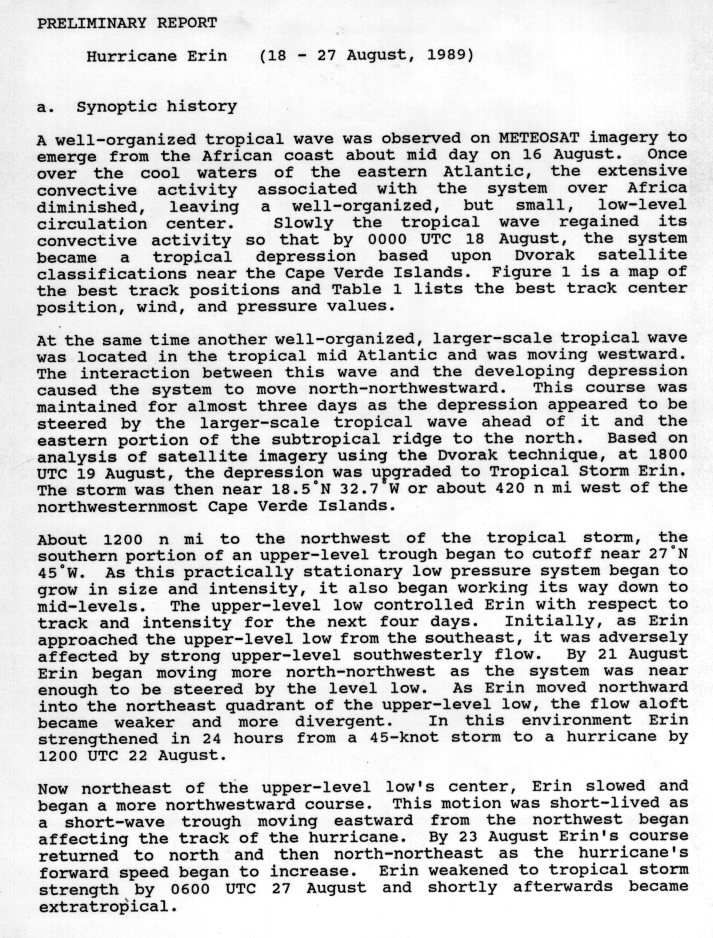
An organized tropical wave emerged into the Atlantic Ocean from the west coast of Africa on August 16. Convection diminished due to cooler sea surface temperatures, but a small, well-defined low-level circulation remained. The convection later redeveloped, and the system became a tropical depression early on August 18, while located just southeast of Cape Verde. Thereafter, the interaction between the tropical depression, a tropical wave, and a subtropical system caused it to move north-northwestward. The depression strengthened and was upgraded to Tropical Storm Erin at 1800 UTC on August 19.[35]
Erin continued to move north-northwestward, until curving northward on August 21. The storm intensified into a hurricane on August 22, after being in the northeastern quadrant of an upper-level low, which caused the flow aloft to become more divergent. It slowed and began to move northwestward while northeast of the upper-level low. However, shortly thereafter, a wave moving westward forced Erin to move north and eventually north-northeastward. Early on August 24, the storm strengthened into a Category 2 hurricane. Later that day, Erin peaked with sustained winds of 105 mph (170 km/h). The storm then began to weaken and degenerated into a tropical storm on August 27. Shortly thereafter, Erin transitioned into an extratropical cyclone over the far northern Atlantic.[35]
Hurricane Felix[]
| Category 1 hurricane (SSHWS) | |
  | |
| Duration | August 26 – September 9 |
|---|---|
| Peak intensity | 85 mph (140 km/h) (1-min) 979 mbar (hPa) |
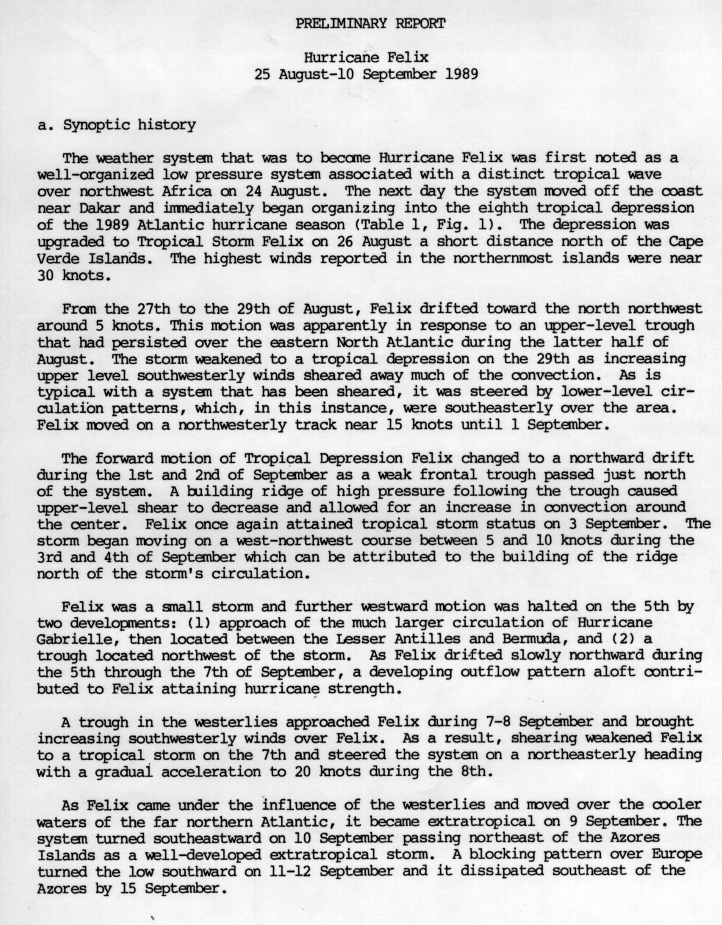
A tropical wave was observed over northwestern Africa on August 24. By the following day, the system moved into the Atlantic Ocean near Dakar, Senegal. It immediately began organizing and became Tropical Depression Eight at 0000 UTC on August 26. The depression initially headed west-northwestward and strengthened into Tropical Storm Felix later that day. Shortly thereafter, the storm grazed Cape Verde, with some islands reporting sustained winds near 35 mph (55 km/h). Between August 27 and August 29, Felix drifted north-northwestward in response to a persistent upper-level trough. Southwesterly winds sheared away much of the deep convection, causing Felix to weaken back to a tropical depression on August 29.[36]
The storm then headed northwestward, until a weak frontal trough turned Felix northward on September 1. Wind shear decreased, allowing Felix to become a tropical storm again on September 3. The storm continued to strengthen while moving west-northwestward and by early on September 5, it became a hurricane. Later that day, Felix peaked with winds of 85 mph (135 km/h). Drifting north-northeastward, the storm eventually began to accelerate, after weakening back to a tropical storm on September 7, due to colder sea surface temperatures and increasing wind shear. At 1200 UTC on September 9, Felix became extratropical while located well east of Cape Race, Newfoundland.[36] The remnants later curved east-southeastward and then dissipated on September 10.[20]
Tropical Depression Nine[]
| Tropical depression (SSHWS) | |
  | |
| Duration | August 27 – August 28 |
|---|---|
| Peak intensity | 30 mph (45 km/h) (1-min) |
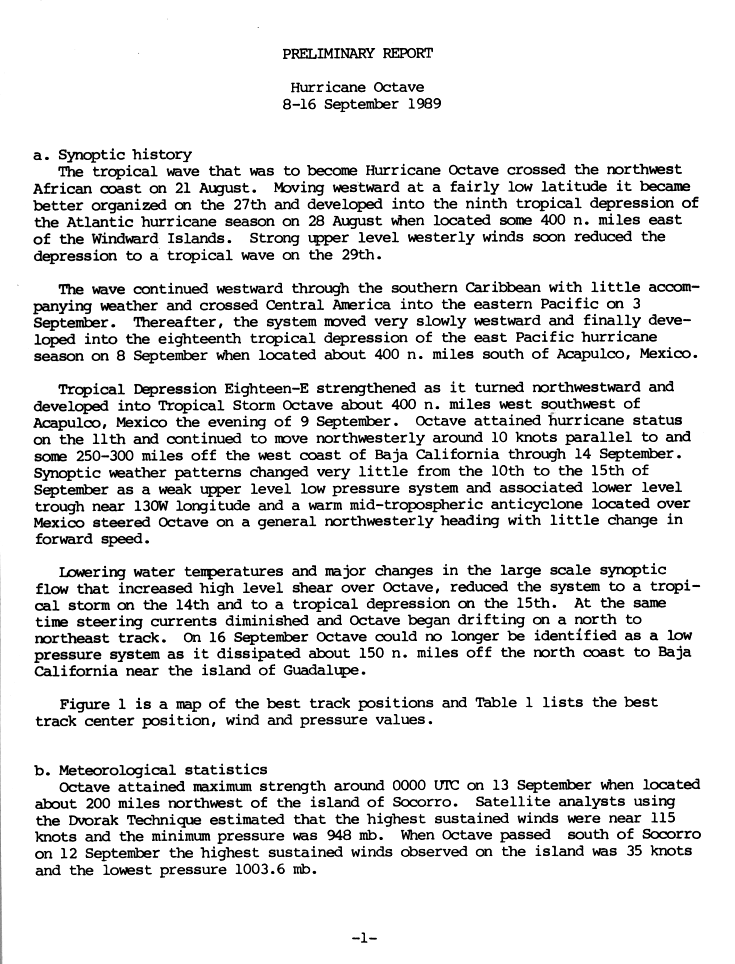
Tropical Depression Nine developed from a tropical wave 490 mi (790 km) east of Barbados on August 27. However, on the following day, a reconnaissance aircraft did not indicate a low-level circulation. Thus, the depression degenerated back into a tropical wave.[21] Tropical Depression Nine did not re-develop in the Atlantic or the Caribbean Sea, although the remnants entered the Pacific and regenerated into Hurricane Octave on September 8.[37]
Hurricane Gabrielle[]
| Category 4 hurricane (SSHWS) | |
  | |
| Duration | August 30 – September 13 |
|---|---|
| Peak intensity | 145 mph (230 km/h) (1-min) 935 mbar (hPa) |
The tenth tropical depression of the season developed from a tropical wave on August 30. The depression quickly intensified into Tropical Storm Gabrielle on the following day. Gabrielle moved generally westward, but curved slightly west-northwestward after intensifying into a hurricane on September 1. Further intensification continued, and Gabrielle eventually peaked as a very strong Category 4 hurricane on September 5. After peaking with sustained winds of 145 mph (235 km/h), Gabrielle slowly curved nearly due north.[38] Gabrielle significantly weakened while heading northward, with sustained winds dropping from a high-end Category 4 hurricane to a strong Category 3 hurricane within 12 hours on September 7. While weakening as it headed northward, Gabrielle bypassed the island of Bermuda early on September 8.[39]
Gabrielle further weakened to a Category 2 hurricane late on September 8, and became nearly stationary roughly almost halfway between Bermuda and Cape Race, Newfoundland. Gabrielle then weakened to a tropical storm and headed due westward on September 10. Thereafter, the storm made a sharp turn to the northeast on September 11 and weakened to a tropical depression on the following day. By September 13, the depression merged with a storm developing off Newfoundland.[39] Although it never approached land, Gabrielle was an extremely large and powerful storm that generated swells up to 20 ft (6 m) all the way from the Lesser Antilles to Canada.[40] On Dominica, severe erosion occurred on the east and north coasts.[41] Large waves responsible for eight deaths on the East Coast of the United States; almost all of the fatalities occurred in New England. In Nova Scotia, waves reached a height of 30 ft (9 m).[40] In addition, one fatality was reported in Canada, when a man drowned near Ketch Harbor, Nova Scotia.[42]
Hurricane Hugo[]
| Category 5 hurricane (SSHWS) | |
  | |
| Duration | September 10 – September 22 |
|---|---|
| Peak intensity | 160 mph (260 km/h) (1-min) 918 mbar (hPa) |
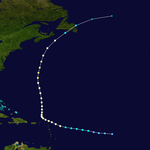
A westward moving tropical wave developed into Tropical Depression Eleven on September 10, while located southeast of Cape Verde. It headed generally westward and intensified into Tropical Storm Hugo on September 11. Hugo became a hurricane by September 13. After becoming a major hurricane early on September 15, rapid intensification commenced, and less than 24 hours later, Hugo peaked as a Category 5 hurricane as winds of 160 mph (255 km/h) and a minimum barometric pressure of 918 mbar (27.1 inHg). Six hours later, Hugo weakened back to a Category 4 hurricane. After weakening on September 17, Hugo entered the Caribbean Sea after passing between Guadeloupe and Montserrat with winds near 140 mph (225 km/h) and later made landfall on St. Croix at the same intensity. Hugo was further downgraded to a Category 3 hurricane, before landfall on eastern Puerto Rico. The storm weakened to a Category 2 hurricane on September 18, after re-emerging into the Atlantic. As Hugo accelerated to the northwest, re-intensification occurred, and it eventually reached a secondary peak intensity as a low-end Category 4 hurricane. Early on September 22, Hugo made landfall near Charleston, South Carolina with winds of 140 mph (225 km/h). After landfall, Hugo rapidly weakened as it turned to the northeast, and transitioned into an extratropical cyclone in northwestern Pennsylvania on September 23. The remnants continued rapidly northeastward, and dissipated on September 25 near Greenland.[43]
The storm caused significant damage in Guadeloupe due to winds of 140 mph (225 km/h). Eleven fatalities and 107 injuries were reported, while 10,000 homes were destroyed, leaving 35,000 people homeless. Crop losses were extreme, with the storm wiping out 100% of the banana crop, 50% of the sugar cane crop, and nearly all coconut crops. Ten people were killed on Montserrat, while 89 others were injured. Damage on the island topped $260 million. In Antigua, one person was killed and 30% of the homes damaged. Dominica suffered the loss of 80% of its banana crop, and landslides cut off many towns for days.[44] Two people were killed, 80 were injured, and 90% of the buildings were damaged or destroyed on Saint Croix.[45] About 3,500 people were left homeless.[46] Damage estimates for Saint Croix exceeded $1 billion. Damage from erosion and crop losses in St. Kitts reached $43 million and one fatality was reported. In Puerto Rico, the storm downed thousands of trees in the El Yunque National Forest and caused near complete destruction of coffee and damage crops.[45] Extreme damage also occurred at Ceiba, Culebra, Fajardo, and Luquillo.[46] Additionally, 28,000 people were left homeless, 12 deaths were reported, and losses exceeded $1 billion.[45] In South Carolina alone, the Red Cross estimates that 3,307 single family homes were destroyed, 18,171 were inflicted major damage, and 56,580 sustained minor impact. Additionally, more than 12,600 mobile homes and 18,000 multi-family houses were either damaged or destroyed.[47] There were 35 deaths and about $5.9 billion in damage in the state.[46][48] The most significant impact elsewhere in the United States occurred in North Carolina, where 205 structure were destroyed, 1,149 suffered major damage, and 2,638 were inflicted minor impacts. There was one fatality and damaged reached $1 billion.[46] Overall, Hugo caused at least 88 fatalities and $9.47 billion in losses,[43][44][45][3][49] making it the costliest hurricane in the Atlantic basin, at the time.[46][49]
Tropical Storm Iris[]
| Tropical storm (SSHWS) | |
  | |
| Duration | September 16 – September 21 |
|---|---|
| Peak intensity | 70 mph (110 km/h) (1-min) 1001 mbar (hPa) |
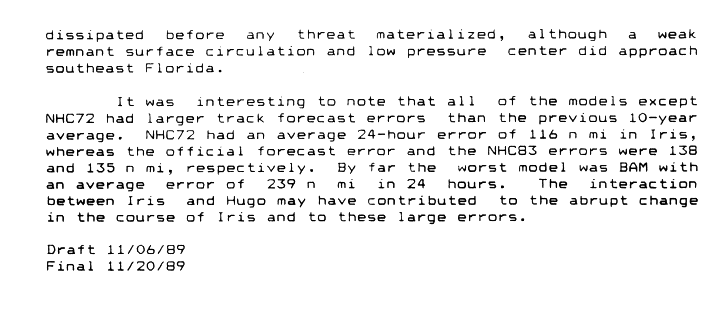
A tropical wave exited the west coast of Africa and entered the Atlantic Ocean on September 12. After undergoing tropical cyclogenesis, a tropical depression developed around 18:00 UTC on September 16, while located about halfway between the Windward Islands and the Cape Verde islands. It slowly strengthened and intensified into Tropical Storm Iris early on September 18. Thereafter, the storm turned north-northwestward and paralleled the Leeward Islands.[50] Initially, there was uncertainty in its path due to potential for a Fujiwhara interaction with Hugo.[51]
While passing east of the Lesser Antilles, Iris produced 7.53 in (191 mm) of rainfall on Saint John in the U.S. Virgin Islands, resulting in flooding. There were few reports of winds or precipitation on other islands, as Hugo destroyed observation stations a few days prior.[51] On September 19, Iris attained its maximum sustained wind speed of 70 mph (115 km/h). Thereafter, the storm weakened due to increased wind shear from Hugo. On September 21, the winds decreased below tropical storm force, after the center became exposed from the convection. The next day, Iris dissipated while approaching the Bahamas,[50] though a remnant circulation persisted and tracked toward southern Florida.[52]
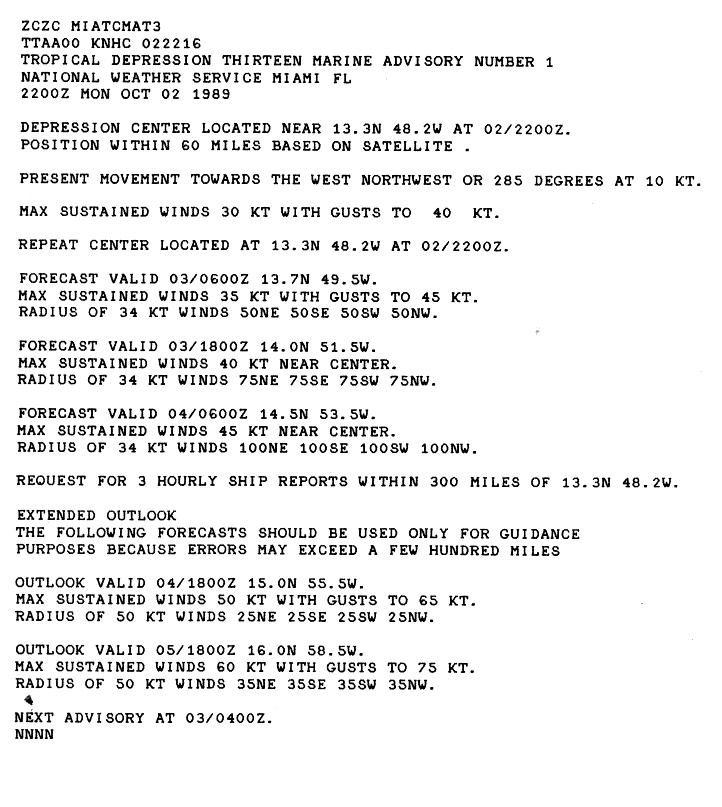
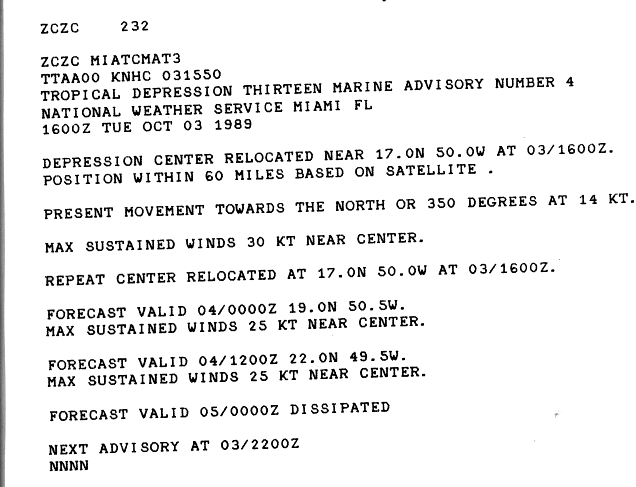
Tropical Depression Thirteen[]
| Tropical depression (SSHWS) | |
  | |
| Duration | October 2 – October 5 |
|---|---|
| Peak intensity | 35 mph (55 km/h) (1-min) |
A tropical wave developed into Tropical Depression Thirteen on October 2, while located a few hundred miles east of the Lesser Antilles.[21] Although the depression was predicted to intensify to near hurricane status by October 5,[53] a mid-latitude trough increased wind shear, inducing weakening.[21] Later on October 3, the National Hurricane Center began to forecast weakening of the depression.[54] The depression continued weakening and dissipated on October 5.[20]
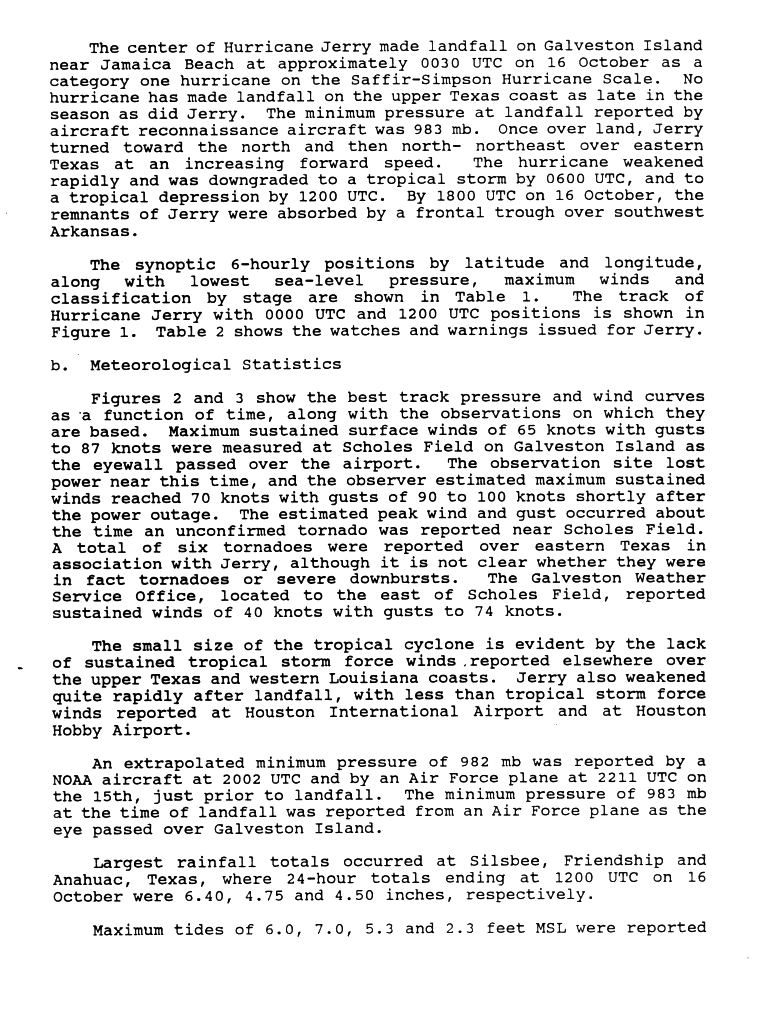
Hurricane Jerry[]
| Category 1 hurricane (SSHWS) | |
  | |
| Duration | October 12 – October 16 |
|---|---|
| Peak intensity | 85 mph (140 km/h) (1-min) 982 mbar (hPa) |
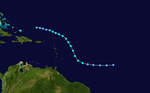
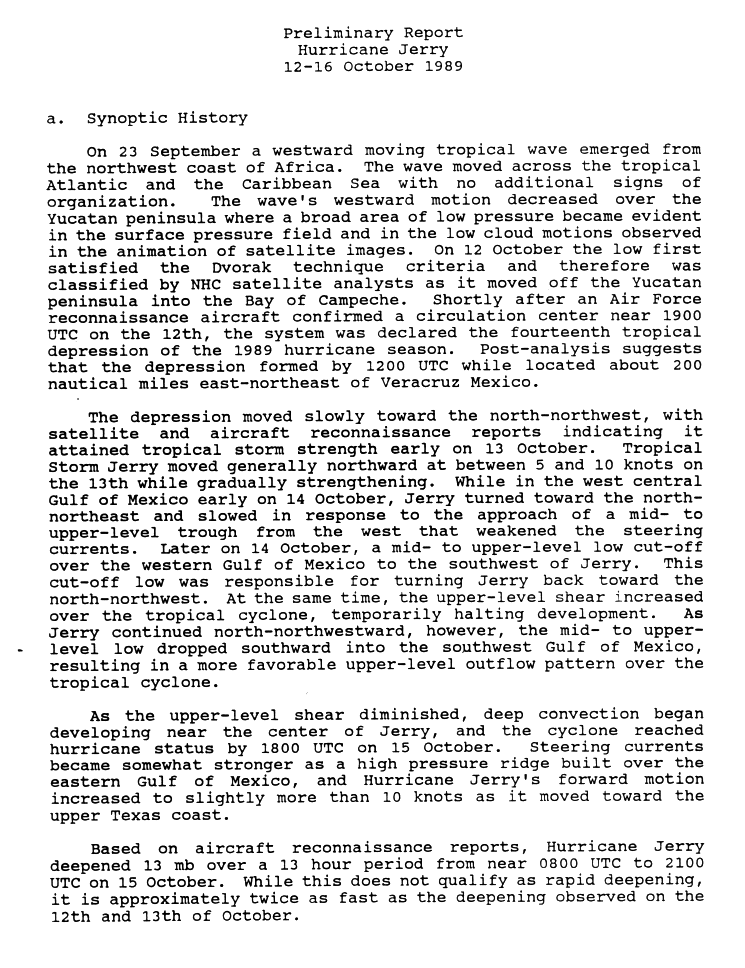
A tropical wave emerged into the Atlantic Ocean from the west coast of Africa on September 23. Only minimal development occurred as the wave crossed the Atlantic and Caribbean Sea. However, after crossing the Yucatán Peninsula and emerging into the Bay of Campeche on October 12, it developed into a tropical depression. The system quickly intensified into Tropical Storm Jerry on the following day. Jerry tracked generally northward while intensifying and reached hurricane status on October 15.[55] After intensifying slightly more, Jerry made landfall near Jamaica Beach, Texas with winds of 85 mph (135 km/h). Jerry rapidly weakened after moving inland, and dissipated by October 16. The remnants moved through the Tennessee Valley ahead of a frontal zone and eventually offshore the coast of the Mid-Atlantic states.[56]
Storm surge and rough surf along the coast of Texas destroyed a 20-mile (32 km) section of Texas State Highway 87,[57] which was never repaired.[58] Due to strong winds, about 52,000 homes and businesses were left without electricity, most of them in the Galveston area.[59] Many homes, businesses, and buildings were inflicted damage because of strong winds and three tornadoes spawned by the storm.[60] Despite the issuance of a hurricane warning just eight hours prior to landfall, Jerry caused only three fatalities in Texas, possibly due to the storm's small size; a car fell over the Galveston Seawall, killing its three occupants.[57] Minor wind and coastal flood damage was reported in Louisiana.[60] Jerry and its remnants brought flash flooding to portions of the Upland South, particularly in the states of Kentucky, Virginia, and West Virginia.[60] In eastern Kentucky, hundreds of homes were flooded and many bridges, culverts, and roads were washed out; this left hundreds of residents stranded.[61] Damage in Kentucky reached at least $5 million. Similar impact occurred in Virginia, with $3.4 million in damage in Buchanan County.[60] In West Virginia, overflowing rivers in the western portions of the state forced hundreds to evacuate.[62] Throughout the United States, Jerry resulted in about $70 million in damage.[57]
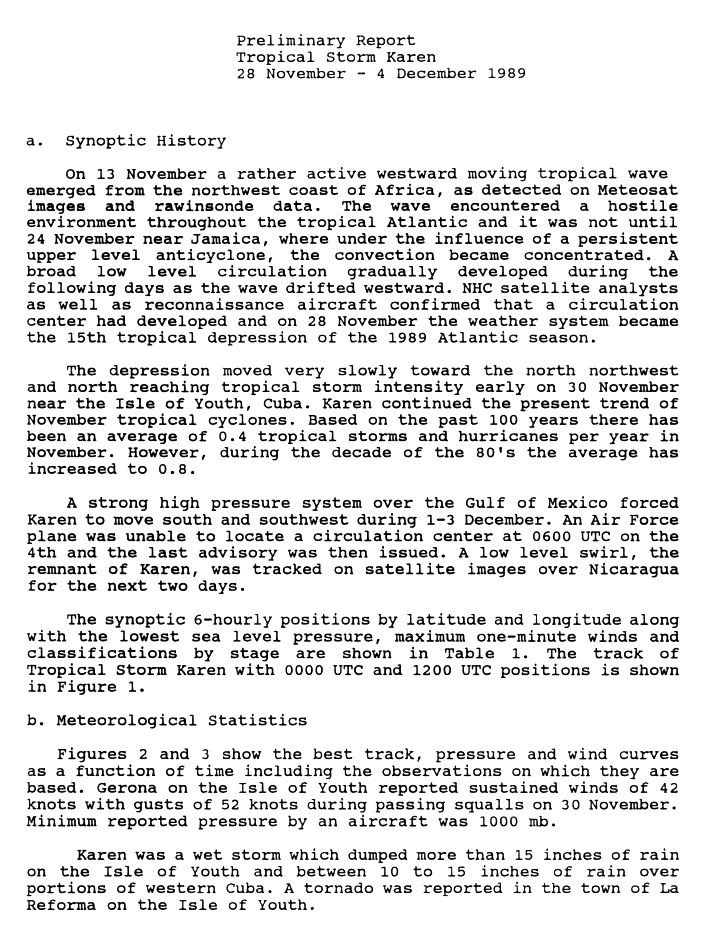
Tropical Storm Karen[]
| Tropical storm (SSHWS) | |
  | |
| Duration | November 28 – December 4 |
|---|---|
| Peak intensity | 60 mph (95 km/h) (1-min) 1000 mbar (hPa) |
A tropical wave moved off the coast of Africa on November 13 and failed to organize until reaching the western Caribbean Sea. Favorable conditions allowed convection to concentrate around a developing low-level circulation. On November 28, satellite imagery and reconnaissance aircraft indicated the development of a tropical depression just north of Honduras. The depression moved northwestward then northeastward, intensifying into Tropical Storm Karen on November 30, while located southwest of Isla de la Juventud, Cuba. Within 12 hours of reaching tropical storm intensity, Karen peaked with maximum sustained winds of 60 mph (95 km/h). Around that time, a building ridge in the Gulf of Mexico forced the storm southeastward.[63]
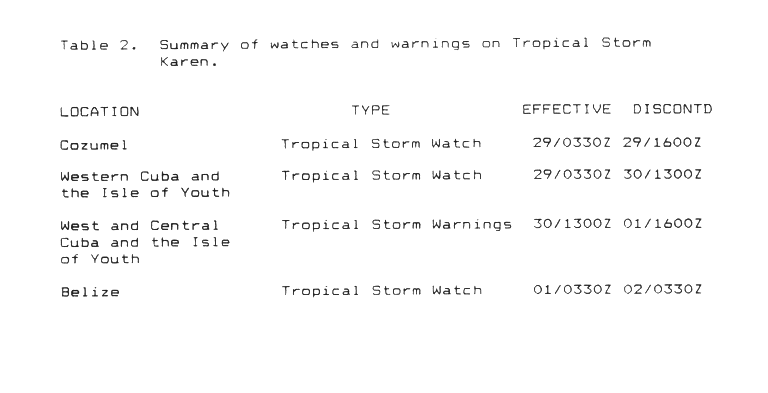
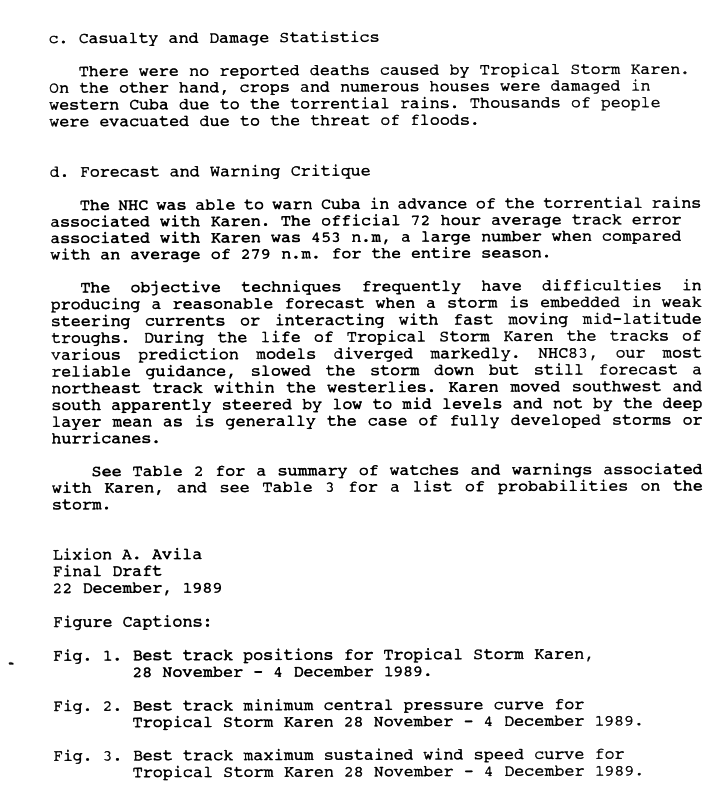
While Karen was threatening landmasses in the northwestern Caribbean Sea, tropical storm watches and warnings were issued for Cozumel on the Yucatán Peninsula, Isle de la Juventud, and western Cuba.[64] The storm dropped heavy rainfall in Cuba, reaching over 15 in (380 mm) on Isle de la Juventud. Wind gusts reached 60 mph (97 km/h), and there were reports of a tornado, but no damage or fatalities were reported.[65] After affecting Cuba, Karen turned to the southwest while steadily weakening.[63] It briefly threatened Belize, prompting a tropical storm watch,[64] but the storm turned to the southeast and dissipated on December 4; its remnants later moved over Nicaragua.[63] Karen was the last tropical cyclone to exist in December until Hurricane Nicole in 1998.[20]
Storm names[]
The following names were used for named storms that formed in the north Atlantic in 1989. The names not retired from this list were used again in the 1995 season. This is the same list used for the 1983 season except for Allison, which replaced Alicia.[1] Storms were named Allison, Erin, Felix, Gabrielle, Hugo, Iris, Jerry, and Karen for the first (and only time in the case of Hugo) in 1989. Names that were not assigned are marked in gray.
|
Retirement[]
The World Meteorological Organization retired one name in the spring of 1990: Hugo. It was replaced in the 1995 season by Humberto.[66]
Season effects[]
The following table lists all of the storms that have formed in the 1989 Atlantic hurricane season. It includes their duration, names, landfall(s) (in parentheses), damages, and death totals. Deaths in parentheses are additional and indirect (an example of an indirect death would be a traffic accident), but were still related to that storm. Damage and deaths include totals while the storm was extratropical, a wave, or a low, and all of the damage figures are in 1989 USD.
| Saffir–Simpson scale | ||||||
| TD | TS | C1 | C2 | C3 | C4 | C5 |
| Storm name |
Dates active | Storm category
at peak intensity |
Max 1-min wind mph (km/h) |
Min. press. (mbar) |
Areas affected | Damage (USD) |
Deaths | Ref(s)
| ||
|---|---|---|---|---|---|---|---|---|---|---|
| One | June 15–17 | Tropical depression | 30 (45) | 1007 | None | None | None | |||
| Allison | June 24–27 | Tropical storm | 50 (85) | 999 | Southern United States (Texas), Midwestern United States, Mid-Atlantic states | $560 million | 11 | |||
| Barry | July 9–14 | Tropical storm | 50 (80) | 1005 | None | None | None | |||
| Chantal | July 30 – August 3 | Category 1 hurricane | 80 (130) | 984 | Mexico, (Texas), Louisiana, Oklahoma, Kansas, Midwestern United States | $100 million | 13 | |||
| Dean | July 31 – August 8 | Category 2 hurricane | 105 (165) | 968 | Leeward Islands, Bermuda, North Carolina, Atlantic Canada (Newfoundland) | $8.9 million | None | |||
| Six | August 8–17 | Tropical depression | 35 (55) | N/A | None | None | None | |||
| Erin | August 18–27 | Category 2 hurricane | 105 (165) | 968 | Cape Verde | None | None | |||
| Felix | August 26 – September 9 | Category 1 hurricane | 85 (140) | 979 | None | None | None | |||
| Nine | August 27–28 | Tropical depression | 30 (45) | N/A | None | None | None | |||
| Gabrielle | August 30 – September 13 | Category 4 hurricane | 145 (230) | 935 | Leeward Islands, Bermuda, East Coast of the United States, Atlantic Canada | Minimal | 9 | |||
| Hugo | September 10–22 | Category 5 hurricane | 160 (260) | 918 | Cape Verde, Lesser Antilles, Puerto Rico, Hispaniola, Turks and Caicos Islands, U.S. Virgin Islands, Bahamas, East Coast of the United States, Atlantic Canada, Southern Greenland | $10.3 billion | 60 | |||
| Iris | September 16 – 21 | Tropical storm | 70 (110) | 1001 | United States Virgin Islands | None | None | |||
| Thirteen | October 2–5 | Tropical depression | 35 (55) | N/A | None | None | None | |||
| Jerry | October 12–16 | Category 1 hurricane | 85 (140) | 982 | Southern United States (Texas), Midwestern United States, Mid-Atlantic states | $70 million | 3 | |||
| Karen | November 28 – December 4 | Tropical storm | 60 (95) | 1000 | Cuba | None | None | |||
| Season aggregates | ||||||||||
| 15 systems | June 15 – December 4 | 160 (260) | 918 | $11 billion | 136 | |||||
See also[]
- List of Atlantic hurricanes
- Atlantic hurricane season
- 1989 Pacific hurricane season
- 1989 Pacific typhoon season
- 1989 North Indian Ocean cyclone season
- Southern Hemisphere tropical cyclone seasons: 1988–89, 1989–90
Notes[]
- ^ All damage figures are in 1989 USD, unless otherwise noted
- ^ A major hurricane is a storm that ranks as Category 3 or higher on the Saffir–Simpson hurricane wind scale.[5]
References[]
- ^ a b c d e "4 hurricane for the Atlantic predicted in 1989". Star-News. Bal Harbour, Florida. Associated Press. June 1, 1989. Retrieved May 10, 2014.
- ^ a b c Neal Dorst (January 12, 2010). FAQ: When is hurricane season?. Atlantic Oceanographic and Meteorological Laboratory (Report). Miami, Florida: National Oceanic and Atmospheric Administration. Retrieved May 10, 2014.
- ^ a b Costliest U.S. tropical cyclones tables updated (PDF) (Report). Miami, Florida: National Hurricane Center. January 26, 2018. Retrieved February 4, 2018.
- ^ a b Jill F. Hasling (May 1, 2008). Comparison of Weather Research Center's OCSI Atlantic Annual Seasonal Hurricane Forecasts with Colorado State Professor Bill Gray's Seasonal Forecast (PDF) (Report). Houston, Texas: Weather Research Center. Archived from the original (PDF) on March 3, 2016. Retrieved May 10, 2014.
- ^ a b Atlantic basin Comparison of Original and Revised HURDAT. Hurricane Research Division (Report). Miami, Florida: Atlantic Oceanographic and Meteorological Laboratory; National Oceanic and Atmospheric Administration. March 2011. Retrieved May 10, 2014.
- ^ a b Background information: the North Atlantic Hurricane Season. Climate Prediction Center (Report). Miami, Florida: National Oceanic and Atmospheric Administration. May 27, 2010. Archived from the original on May 10, 2011. Retrieved May 10, 2014.
- ^ a b c d Robert A. Case; B. Mayfield Max (May 1990). Atlantic hurricane season of 1989 (PDF). National Hurricane Center (Report). Miami, Florida: National Oceanic and Atmospheric Administration. Retrieved May 10, 2014.
- ^ a b Robert A. Case (August 16, 1989). D. Casualty and Damage Statistics. National Hurricane Center (Report). National Oceanic and Atmospheric Administration. p. 4. Retrieved January 28, 2013.
- ^ Harold P. Gerrish (November 22, 1989). Meteorological Statistics. National Hurricane Center (Report). Miami, Florida: National Oceanic and Atmospheric Administration. p. 3. Retrieved March 1, 2014.
- ^ B. Max Mayfield (October 22, 1989). Casualty and Damage Statistics. National Hurricane Center (Report). National Oceanic and Atmospheric Administration. p. 2. Retrieved March 1, 2014.
- ^ Robert A. Case (November 23, 1989). Casualty and damage statistics. National Hurricane Center (Report). Miami, Florida: National Oceanic and Atmospheric Administration. p. 3. Retrieved May 9, 2014.
- ^ 1989-Gabrielle (Report). Moncton, New Brunswick: Environment Canada. September 14, 2010. Retrieved May 10, 2014.
- ^ Miles B. Lawrence (November 15, 1989). Preliminary Report Hurricane Hugo 10–22 September 1989 (PDF). National Hurricane Center (Report). Miami, Florida: National Oceanic and Atmospheric Administration. Retrieved May 10, 2014.
- ^ Jeff Masters. "Day 10: Hugo Approaches the U.S. Virgin Islands". Remembering Hurricane Hugo. Weather Underground. Retrieved January 15, 2013.
- ^ Jay Hollifield; S. C. Lackey. Storm Data and Unusual Weather Phenomena: September 1989 (PDF) (Report). National Climatic Data Center. p. 43. Archived from the original (PDF) on May 11, 2014. Retrieved January 15, 2013.
- ^ Jeff Masters. Day 14: From the Carolinas to Buffalo (Report). Remembering Hurricane Hugo. Weather Underground. Retrieved January 15, 2013.
- ^ B. Max Mayfield (November 21, 1989). Casualty and Damage Statistics. National Hurricane Center (Report). Miami, Florida: National Oceanic and Atmospheric Administration. p. 3. Retrieved May 9, 2014.
- ^ Jay Hollifield; S. C. Lackey (1990). Storm Data and Unusual Weather Phenomena: October 1989 (PDF). National Climatic Data Center (Report). Asheville, North Carolina: National Oceanic and Atmospheric Administration. p. 21. Archived from the original (PDF) on May 9, 2014. Retrieved December 4, 2013.
- ^ David Levinson (August 20, 2008). 2005 Atlantic Ocean Tropical Cyclones. National Climatic Data Center (Report). Asheville, North Carolina: National Oceanic and Atmospheric Administration. Retrieved July 23, 2011.
- ^ a b c d e f "Atlantic hurricane best track (HURDAT version 2)" (Database). United States National Hurricane Center. May 25, 2020.
- ^ a b c d e Lixion A. Avila (May 1990). Atlantic Tropical Systems of 1989. National Hurricane Center (Report). Coral Gables, Florida: National Oceanic and Atmospheric Administration. doi:10.1175/1520-0493(1990)118<1178:ATSO>2.0.CO;2. Retrieved February 28, 2014.
- ^ Robert A. Case (August 16, 1989). Preliminary Report Tropical Storm Allison 24 – 27 June, 1989. National Hurricane Center (Report). Miami, Florida: National Oceanic and Atmospheric Administration. p. 1. Retrieved January 28, 2013.
- ^ Robert A. Case (August 16, 1989). Preliminary Report Tropical Storm Allison 24 – 27 June, 1989. National Hurricane Center (Report). Miami, Florida: National Oceanic and Atmospheric Administration. p. 2. Retrieved January 28, 2013.
- ^ David M. Roth (May 1, 2007). Tropical Storm Allison – June 24 – July 7, 1989. Weather Prediction Center (Report). College Park, Maryland: National Oceanic and Atmospheric Administration. Archived from the original on December 5, 2010. Retrieved February 28, 2014.
- ^ Jay Hollifield; S. C. Lackey. Storm Data and Unusual Weather Phenomena: June 1989 (PDF). National Climatic Data Center (Report). Asheville, North Carolina: National Oceanic and Atmospheric Administration. pp. 46, 85–86. Archived from the original (PDF) on February 28, 2014. Retrieved January 28, 2013.
- ^ Miles B. Lawrence (August 28, 1989). Preliminary Report Tropical Storm Berry (9 – 16 July 1989). National Hurricane Center (Report). Miami, Florida: National Oceanic and Atmospheric Administration. p. 1. Retrieved May 9, 2014.
- ^ Harold P. Gerrish (November 22, 1989). Preliminary Report Hurricane Chantal 30 July to 3 August 1989. National Hurricane Center (Report). Miami, Florida: National Oceanic and Atmospheric Administration. p. 1. Retrieved March 1, 2014.
- ^ a b c Harold P. Gerrish (November 22, 1989). Meteorological Statistics. National Hurricane Center (Report). Miami, Florida: National Oceanic and Atmospheric Administration. p. 3. Retrieved March 1, 2014.
- ^ a b Harold P. Gerrish (November 22, 1989). Meteorological Statistics. National Hurricane Center (Report). Miami, Florida: National Oceanic and Atmospheric Administration. p. 4. Retrieved May 21, 2014.
- ^ B. Max Mayfield (October 22, 1989). Preliminary Report Hurricane Dean 31 July - 8 August 1989. National Hurricane Center (Report). National Oceanic and Atmospheric Administration. p. 1. Retrieved March 1, 2014.
- ^ B. Max Mayfield (October 22, 1989). Casualty and Damage Statistics. National Hurricane Center (Report). National Oceanic and Atmospheric Administration. p. 2. Retrieved March 1, 2014.
- ^ 1989-Dean (Report). Environment Canada. September 14, 2010. Retrieved January 15, 2013.
- ^ "Hurricane sweeps past Nova Scotia". Syracuse Herald Journal. Associated Press. 1989.
- ^ Harold P. Gerrish (1989). Preliminary Report Hurricane Lorena 27 August to 6 September 1989. National Hurricane Center (Report). Miami, Florida: National Oceanic and Atmospheric Administration. p. 1. Retrieved May 9, 2014.
- ^ a b Jim Gross (December 4, 1989). Preliminary Report Hurricane Erin (18 - 27 August, 1989). National Hurricane Center (Report). Miami, Florida: National Oceanic and Atmospheric Administration. Retrieved March 1, 2014.
- ^ a b Preliminary Report Hurricane Felix 25 August – 10 September 1989. National Hurricane Center (Report). Miami, Florida: National Oceanic and Atmospheric Administration. November 17, 1989. Retrieved May 9, 2014.
- ^ Gilbert B. Clack (November 9, 1989). Preliminary Report Hurricane Octave 8 – 16 September 1989. National Hurricane Center (Report). Miami, Florida: National Oceanic and Atmospheric Administration. Retrieved May 9, 2014.
- ^ Robert A. Case (November 23, 1989). Preliminary Report Hurricane Gabrielle 30 August – 13 September 1989. National Hurricane Center (Report). Miami, Florida: National Oceanic and Atmospheric Administration. p. 1. Retrieved May 9, 2014.
- ^ a b Robert A. Case (November 23, 1989). Preliminary Report Hurricane Gabrielle 30 August – 13 September 1989. National Hurricane Center (Report). Miami, Florida: National Oceanic and Atmospheric Administration. p. 2. Retrieved May 9, 2014.
- ^ a b Robert A. Case (November 23, 1989). Casualty and damage statistics. National Hurricane Center (Report). Miami, Florida: National Oceanic and Atmospheric Administration. p. 3. Retrieved May 9, 2014.
- ^ Hurricane impact on beaches in the eastern Caribbean Islands 1989 - 1995 (Report). UNESCO. 2007. Retrieved May 21, 2014.
- ^ 1989-Gabrielle (Report). Moncton, New Brunswick: Environment Canada. September 14, 2010. Retrieved May 10, 2014.
- ^ a b Miles B. Lawrence (November 15, 1989). Preliminary Report Hurricane Hugo 10 – 22 September 1989 (PDF). National Hurricane Center (Report). Miami, Florida: National Oceanic and Atmospheric Administration. Retrieved May 10, 2014.
- ^ a b Jeff Masters. "Day 9: Hurricane Hugo Strikes Guadalupe". Remembering Hurricane Hugo. Weather Underground. Retrieved January 15, 2013.
- ^ a b c d Jeff Masters. "Day 10: Hugo Approaches the U.S. Virgin Islands". Remembering Hurricane Hugo. Weather Underground. Retrieved January 15, 2013.
- ^ a b c d e Jay Hollifield; S. C. Lackey. Storm Data and Unusual Weather Phenomena: September 1989 (PDF) (Report). National Climatic Data Center. p. 43. Archived from the original (PDF) on May 11, 2014. Retrieved January 15, 2013.
- ^ Claire B. Rubin; Roy Popkin (January 1990). Disaster Recovery After Hurricane Hugo In South Carolina (PDF). George Washington University (Report). University of Colorado at Boulder. pp. 3 and 4. Archived from the original (PDF) on June 20, 2013. Retrieved January 15, 2013.
- ^ J.M. Watson (September 15, 1997). Coastal Conflicts (Report). Reston, Virginia: United States Geological Survey. Retrieved March 25, 2013.
- ^ a b Jeff Masters. "Day 14: From the Carolinas to Buffalo". Remembering Hurricane Hugo. Weather Underground. Retrieved January 15, 2013.
- ^ a b Harold P. Gerrish (November 20, 1989). Preliminary Report Tropical Storm Iris 16 – 21 September 1989. National Hurricane Center (Report). Miami, Florida: National Oceanic and Atmospheric Administration. p. 1. Retrieved May 10, 2014.
- ^ a b Harold P. Gerrish (November 20, 1989). Preliminary Report Tropical Storm Iris 16 – 21 September 1989. National Hurricane Center (Report). Miami, Florida: National Oceanic and Atmospheric Administration. p. 2. Retrieved May 10, 2014.
- ^ Harold P. Gerrish (November 20, 1989). Preliminary Report Tropical Storm Iris 16 – 21 September 1989. National Hurricane Center (Report). Miami, Florida: National Oceanic and Atmospheric Administration. p. 3. Retrieved May 10, 2014.
- ^ Tropical Depression Thirteen Marine Advisory Number 1. National Hurricane Center (Report). Miami, Florida: National Oceanic and Atmospheric Administration. October 2, 1989. Retrieved May 9, 2014.
- ^ Tropical Depression Thirteen Marine Advisory Number 4. National Hurricane Center (Report). Miami, Florida: National Oceanic and Atmospheric Administration. October 3, 1989. Retrieved May 9, 2014.
- ^ B. Max Mayfield (November 21, 1989). Preliminary Report Hurricane Jerry 12 – 16 October 1989. National Hurricane Center (Report). Miami, Florida: National Oceanic and Atmospheric Administration. p. 1. Retrieved May 9, 2014.
- ^ B. Max Mayfield (November 21, 1989). Preliminary Report Hurricane Jerry 12 – 16 October 1989. National Hurricane Center (Report). Miami, Florida: National Oceanic and Atmospheric Administration. p. 2. Retrieved May 9, 2014.
- ^ a b c B. Max Mayfield (November 21, 1989). Casualty and Damage Statistics. National Hurricane Center (Report). Miami, Florida: National Oceanic and Atmospheric Administration. p. 3. Retrieved May 9, 2014.
- ^ Sarah Moore; Ryan Myers; Christine Rappl (November 16, 1989). "Did Hurricane Ike kill the chances of Texas 87 being rebuilt?". The Beaumont Enterprise. Retrieved May 9, 2014.
- ^ "Hurricane Jerry whips Gulf Coast, kills man, child in eastern". The Vindicator. Galveston, Texas. Associated Press. October 16, 1989. Retrieved December 14, 2013.
- ^ a b c d Jay Hollifield; S. C. Lackey (1990). Storm Data and Unusual Weather Phenomena: October 1989 (PDF). National Climatic Data Center (Report). Asheville, North Carolina: National Oceanic and Atmospheric Administration. p. 21. Archived from the original (PDF) on May 9, 2014. Retrieved December 4, 2013.
- ^ "Hurricane Jerry floods Kentucky". Pittsburgh Press. Associated Press. October 19, 1989. Retrieved May 9, 2014.
- ^ "Rain floods waterways in W.Va, Kentucky". Pittsburgh Press. Pikeville, Kentucky. Associated Press. October 18, 1989. Retrieved May 9, 2014.
- ^ a b c Lixion A. Avila (December 22, 1989). Preliminary Report Tropical Storm Karen 28 November – 4 December 1989. National Hurricane Center (Report). Miami, Florida: National Oceanic and Atmospheric Administration. p. 1. Retrieved May 10, 2014.
- ^ a b Lixion A. Avila (December 22, 1989). Summary of watches and warnings on Tropical Storm Karen. National Hurricane Center (Report). Miami, Florida: National Oceanic and Atmospheric Administration. p. 5. Retrieved May 10, 2014.
- ^ Lixion A. Avila (December 22, 1989). Casualty and Damage Statistics. National Hurricane Center (Report). Miami, Florida: National Oceanic and Atmospheric Administration. p. 2. Retrieved May 10, 2014.
- ^ National Hurricane Center (March 16, 2011). "Retired Hurricane Names Since 1954". National Oceanic and Atmospheric Administration. Archived from the original on June 28, 2011. Retrieved July 14, 2011.
External links[]
- 1989 Atlantic hurricane season