1992 United States presidential election in Nevada
| |||||||||||||||||||||||||||||||||
| |||||||||||||||||||||||||||||||||
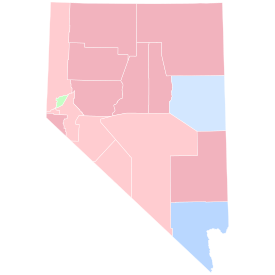 County Results
| |||||||||||||||||||||||||||||||||
| |||||||||||||||||||||||||||||||||


| Elections in Nevada |
|---|
 |
| None of These Candidates |
The 1992 United States presidential election in Nevada took place on November 3, 1992, as part of the 1992 United States presidential election. Voters chose four representatives, or electors to the Electoral College, who voted for president and vice president.
Nevada was won by Governor Bill Clinton (D-Arkansas) with 37.36% of the popular vote over incumbent President George H. W. Bush (R-Texas) with 34.73%. Businessman Ross Perot (I-Texas) finished in third, with 26.19% of the popular vote.[1] Clinton ultimately won the national vote, defeating incumbent President Bush and Perot.[2]
Clinton's win, although narrow, would mark the beginning of Nevada's transition from a safe Republican state into a swing state; in all three presidential elections held in the 1980s, Republicans had dominated Nevada by double digit margins and swept every county. Although Clinton carried only two of the state's seventeen counties, his win in Clark County, where Las Vegas is located, and the most populous county in the state, would prove the key to this and future Democratic victories in Nevada.
Clinton's percentage of the vote was the lowest to win a state since Woodrow Wilson carried only 32.08 percent of the vote in Idaho in 1912.
As of the 2020 presidential election, this is the last time a Democratic presidential candidate carried White Pine County in a presidential election,[3] and the last one where a third-party candidate carried any Nevada county. In this case, Ross Perot carried Storey County.[3]
Results[]
| 1992 United States presidential election in Nevada[1] | |||||
|---|---|---|---|---|---|
| Party | Candidate | Votes | Percentage | Electoral votes | |
| Democratic | Bill Clinton | 189,148 | 37.36% | 4 | |
| Republican | George H. W. Bush (incumbent) | 175,828 | 34.73% | 0 | |
| Independent | Ross Perot | 132,580 | 26.19% | 0 | |
| America First | James "Bo" Gritz | 2,892 | 0.57% | 0 | |
| N/A | "None of these candidates" | 2,537 | 0.50% | 0 | |
| Libertarian | Andre Marrou | 1,835 | 0.36% | 0 | |
| American Independent | Howard Phillips | 677 | 0.13% | 0 | |
| New Alliance | Lenora Fulani | 483 | 0.10% | 0 | |
| Natural Law | Dr. John Hagelin | 338 | 0.07% | 0 | |
| Totals | 506,318 | 100.0% | 4 | ||
Results by county[]
| County or City | William Jefferson Clinton[4] Democratic |
George Herbert Walker Bush[4] Republican |
Henry Ross Perot[4] Independent |
Various candidates[4] Other parties |
Margin | Total votes cast | |||||
|---|---|---|---|---|---|---|---|---|---|---|---|
| # | % | # | % | # | % | # | % | # | % | ||
| Churchill | 1,770 | 23.10% | 3,789 | 49.45% | 1,964 | 25.63% | 140 | 1.83% | 1,825[a] | 23.82% | 7,663 |
| Clark | 124,586 | 41.15% | 97,403 | 32.17% | 75,364 | 24.89% | 5,429 | 1.79% | 27,183 | 8.98% | 302,782 |
| Douglas | 3,928 | 25.94% | 6,182 | 40.82% | 4,814 | 31.79% | 221 | 1.46% | 1,368[a] | 9.03% | 15,145 |
| Elko | 2,782 | 23.33% | 5,208 | 43.67% | 3,628 | 30.42% | 308 | 2.58% | 1,580[a] | 13.25% | 11,926 |
| Esmeralda | 118 | 20.21% | 221 | 37.84% | 220 | 37.67% | 25 | 4.28% | 1[a] | 0.17% | 584 |
| Eureka | 129 | 18.70% | 330 | 47.83% | 214 | 31.01% | 17 | 2.46% | 116[a] | 16.81% | 690 |
| Humboldt | 810 | 22.99% | 1,505 | 42.72% | 1,149 | 32.61% | 59 | 1.67% | 356[a] | 10.11% | 3,523 |
| Lander | 423 | 21.23% | 885 | 44.43% | 652 | 32.73% | 32 | 1.61% | 233[a] | 11.70% | 1,992 |
| Lincoln | 511 | 27.52% | 890 | 47.93% | 394 | 21.22% | 62 | 3.34% | -379 | -20.41% | 1,857 |
| Lyon | 2,777 | 30.17% | 3,509 | 38.12% | 2,716 | 29.51% | 202 | 2.19% | -732 | -7.95% | 9,204 |
| Mineral | 909 | 34.42% | 918 | 34.76% | 746 | 28.25% | 68 | 2.57% | -9 | -0.34% | 2,641 |
| Nye | 2,561 | 31.92% | 2,743 | 34.19% | 2,501 | 31.18% | 217 | 2.71% | -182 | -2.27% | 8,022 |
| Pershing | 467 | 29.82% | 643 | 41.06% | 429 | 27.39% | 27 | 1.72% | -176 | -11.24% | 1,566 |
| Storey | 488 | 32.13% | 458 | 30.15% | 550 | 36.21% | 23 | 1.51% | -62[b] | -4.08% | 1,519 |
| Washoe | 39,500 | 34.45% | 42,636 | 37.18% | 30,974 | 27.01% | 1,561 | 1.36% | -3,136 | -2.73% | 114,671 |
| White Pine | 1,354 | 36.30% | 1,206 | 32.33% | 1,070 | 28.69% | 100 | 2.68% | 148 | 3.97% | 3,730 |
| Carson City | 6,035 | 32.10% | 7,302 | 38.83% | 5,195 | 27.63% | 271 | 1.44% | -1,267 | -6.74% | 18,803 |
| Totals | 189,148 | 37.36% | 175,828 | 34.73% | 132,580 | 26.19% | 8,762 | 1.73% | 13,320 | 2.63% | 506,318 |
Notes[]
- ^ Jump up to: a b c d e f g In this county where Clinton ran third behind Bush and Perot, margin given is Bush vote minus Perot vote and percentage is Bush percentage minus Perot percentage.
- ^ In this county where Bush ran third behind Clinton and Perot, margin given is Clinton vote minus Perot vote and percentage is Clinton percentage minus Perot percentage.
References[]
- ^ Jump up to: a b "1992 Presidential General Election Results – Nevada". U.S. Election Atlas. Retrieved 8 June 2012.
- ^ "1992 Presidential General Election Results". U.S. Election Atlas. Retrieved 8 June 2012.
- ^ Jump up to: a b Sullivan, Robert David; ‘How the Red and Blue Map Evolved Over the Past Century’; America Magazine in The National Catholic Review; June 29, 2016
- ^ Jump up to: a b c d Nevada Secretary of State, compiled 1992; General Election Returns (Carson City, 1992)
| show State and district results of the 1992 U.S. presidential election |
|---|

- 1992 United States presidential election by state
- United States presidential elections in Nevada
- 1992 Nevada elections