1992 United States presidential election in New Mexico
| |||||||||||||||||||||||||||||||||
| |||||||||||||||||||||||||||||||||
 County Results
| |||||||||||||||||||||||||||||||||
| |||||||||||||||||||||||||||||||||


| Elections in New Mexico |
|---|
 |
|
|
|
|
|
|
The 1992 United States presidential election in New Mexico took place on November 3, 1992, as part of the 1992 United States presidential election. State voters chose five electors to the Electoral College, who voted for president and vice president.
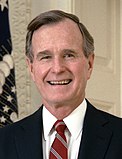
New Mexico was won by Governor Bill Clinton (D-Arkansas) with 45.90 percent of the popular vote over incumbent President George H.W. Bush (R-Texas) with 37.34 percent. Businessman Ross Perot (I-Texas) finished in third, with 16.12 percent of the popular vote.[1] Clinton ultimately won the national vote, defeating incumbent President Bush.[2]
As a result of his win, Clinton became the first Democratic presidential candidate since Lyndon B. Johnson in 1964 to win the state. However, this election would mark a major shift in the state's politics, and it would vote Democrat for every election after this except in 2004.
This was the 20th U.S. Presidential election that New Mexico participated in since 1912.
Results[]
| 1992 United States presidential election in New Mexico[1] | |||||
|---|---|---|---|---|---|
| Party | Candidate | Votes | Percentage | Electoral votes | |
| Democratic | Bill Clinton | 261,617 | 45.90% | 5 | |
| Republican | George H.W. Bush (incumbent) | 212,824 | 37.34% | 0 | |
| Independent | Ross Perot | 91,895 | 16.12% | 0 | |
| Libertarian | Andre Marrou | 1,615 | 0.28% | 0 | |
| U.S. Taxpayers' | Howard Phillips | 620 | 0.11% | 0 | |
| Natural Law | John Hagelin | 562 | 0.10% | 0 | |
| New Alliance | Lenora Fulani | 369 | 0.06% | 0 | |
| Socialist Workers | James Warren | 183 | 0.03% | 0 | |
| Workers World | Gloria La Riva | 181 | 0.03% | 0 | |
| Prohibition | Earl Dodge | 120 | 0.02% | 0 | |
| Totals | 569,986 | 100.0% | 5 | ||
Results by county[]
| County | William Jefferson Clinton Democratic |
George Herbert Walker Bush Republican |
Henry Ross Perot Independent |
Various candidates Other parties |
Margin | |||||
|---|---|---|---|---|---|---|---|---|---|---|
| % | # | % | # | % | # | % | # | % | # | |
| Taos | 66.01% | 7,051 | 21.16% | 2,260 | 12.17% | 1,300 | 0.66% | 70 | 44.86% | 4,791 |
| Rio Arriba | 67.86% | 7,832 | 23.22% | 2,680 | 8.53% | 984 | 0.40% | 46 | 44.64% | 5,152 |
| San Miguel | 65.90% | 6,186 | 23.26% | 2,183 | 10.28% | 965 | 0.56% | 53 | 42.64% | 4,003 |
| Santa Fe | 63.35% | 27,189 | 22.56% | 9,684 | 13.18% | 5,656 | 0.90% | 388 | 40.79% | 17,505 |
| Mora | 64.23% | 1,555 | 27.59% | 668 | 7.77% | 188 | 0.41% | 10 | 36.64% | 887 |
| McKinley | 60.56% | 9,405 | 30.39% | 4,720 | 8.40% | 1,304 | 0.66% | 102 | 30.17% | 4,685 |
| Grant | 54.52% | 5,603 | 28.38% | 2,917 | 16.40% | 1,685 | 0.70% | 72 | 26.14% | 2,686 |
| Guadalupe | 58.28% | 1,225 | 32.87% | 691 | 8.23% | 173 | 0.62% | 13 | 25.40% | 534 |
| Cibola | 53.06% | 3,334 | 32.64% | 2,051 | 13.48% | 847 | 0.83% | 52 | 20.42% | 1,283 |
| Colfax | 49.87% | 2,607 | 33.09% | 1,730 | 16.66% | 871 | 0.38% | 20 | 16.78% | 877 |
| Socorro | 47.77% | 2,908 | 35.91% | 2,186 | 15.08% | 918 | 1.25% | 76 | 11.86% | 722 |
| Sandoval | 46.45% | 10,951 | 36.02% | 8,491 | 16.77% | 3,954 | 0.76% | 178 | 10.44% | 2,460 |
| Doña Ana | 44.99% | 19,894 | 36.88% | 16,308 | 17.37% | 7,682 | 0.75% | 333 | 8.11% | 3,586 |
| Luna | 42.04% | 2,637 | 34.53% | 2,166 | 23.04% | 1,445 | 0.38% | 24 | 7.51% | 471 |
| Valencia | 44.70% | 7,495 | 37.60% | 6,305 | 17.31% | 2,902 | 0.39% | 66 | 7.10% | 1,190 |
| Bernalillo | 45.27% | 90,863 | 38.52% | 77,304 | 15.57% | 31,241 | 0.64% | 1,290 | 6.76% | 13,559 |
| Hidalgo | 42.98% | 995 | 37.62% | 871 | 19.09% | 442 | 0.30% | 7 | 5.36% | 124 |
| Sierra | 40.09% | 1,771 | 35.36% | 1,562 | 23.88% | 1,055 | 0.68% | 30 | 4.73% | 209 |
| Eddy | 40.70% | 7,409 | 40.18% | 7,313 | 18.84% | 3,430 | 0.27% | 50 | 0.53% | 96 |
| Quay | 40.99% | 1,758 | 41.01% | 1,759 | 17.60% | 755 | 0.40% | 17 | -0.02% | -1 |
| Torrance | 39.88% | 1,662 | 40.00% | 1,667 | 19.44% | 810 | 0.67% | 28 | -0.12% | -5 |
| Los Alamos | 36.62% | 3,897 | 40.59% | 4,320 | 21.98% | 2,339 | 0.81% | 86 | -3.97% | -423 |
| De Baca | 38.06% | 451 | 44.39% | 526 | 17.22% | 204 | 0.34% | 4 | -6.33% | -75 |
| Harding | 39.53% | 268 | 46.02% | 312 | 14.45% | 98 | 0.00% | 0 | -6.49% | -44 |
| San Juan | 37.32% | 11,302 | 44.30% | 13,415 | 17.67% | 5,351 | 0.70% | 213 | -6.98% | -2,113 |
| Otero | 33.19% | 5,377 | 46.17% | 7,481 | 20.10% | 3,257 | 0.54% | 88 | -12.99% | -2,104 |
| Chaves | 33.65% | 6,360 | 46.95% | 8,872 | 19.00% | 3,590 | 0.40% | 76 | -13.29% | -2,512 |
| Roosevelt | 33.35% | 2,172 | 49.36% | 3,215 | 16.66% | 1,085 | 0.63% | 41 | -16.01% | -1,043 |
| Lincoln | 29.54% | 1,730 | 45.57% | 2,669 | 24.43% | 1,431 | 0.46% | 27 | -16.03% | -939 |
| Lea | 30.94% | 5,047 | 48.56% | 7,921 | 19.82% | 3,233 | 0.67% | 110 | -17.62% | -2,874 |
| Catron | 29.94% | 465 | 49.65% | 771 | 18.61% | 289 | 1.80% | 28 | -19.70% | -306 |
| Union | 27.99% | 519 | 52.59% | 975 | 19.15% | 355 | 0.27% | 5 | -24.60% | -456 |
| Curry | 29.28% | 3,699 | 54.07% | 6,831 | 16.27% | 2,056 | 0.37% | 47 | -24.79% | -3,132 |
References[]
- ^ a b "1992 Presidential General Election Results - New Mexico". U.S. Election Atlas. Retrieved 9 June 2012.
- ^ "1992 Presidential General Election Results". U.S. Election Atlas. Retrieved 9 June 2012.
State and district results of the 1992 U.S. presidential election | ||
|---|---|---|
|  | |
- 1992 United States presidential election by state
- United States presidential elections in New Mexico
- 1992 New Mexico elections