1996 Derby City Council election
| |||||||||||||||||||||||||||||
All 44 seats in the Derby City Council 23 seats needed for a majority | |||||||||||||||||||||||||||||
|---|---|---|---|---|---|---|---|---|---|---|---|---|---|---|---|---|---|---|---|---|---|---|---|---|---|---|---|---|---|
| |||||||||||||||||||||||||||||
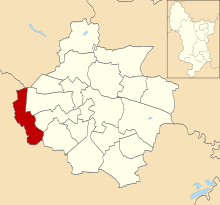
 Map showing the results of the 1996 Derby City Council elections. | |||||||||||||||||||||||||||||
| |||||||||||||||||||||||||||||
The 1996 Derby City Council election took place on 2 May 1996 to elect members of Derby City Council in England. Local elections were held in the United Kingdom in 1996.[3] This was on the same day as other local elections. This election was held ahead of Derby City Council becoming a unitary authority on 1 April 1997. As a result, the entire council was up for election and the elected councillors acted as a shadow authority until that date. The Labour Party retained control of the council.
Overall results[]
| Party | Seats | Gains | Losses | Net gain/loss | Seats % | Votes % | Votes | +/− | |
|---|---|---|---|---|---|---|---|---|---|
| Labour | 39 | 9 | 0 | 88.6 | 55.5 | 33,386 | |||
| Conservative | 3 | 0 | 9 | 6.8 | 27.6 | 16,593 | |||
| Liberal Democrats | 2 | 0 | 0 | 4.5 | 16.1 | 9,716 | |||
| Green | 0 | 0 | 0 | 0.0 | 0.6 | 385 | |||
| Independent | 0 | 0 | 0 | 0.0 | 0.1 | 85 | |||
| SDP | 0 | 0 | 0 | 0.0 | 0.1 | 36 | |||
| Total | 44 | 60,201 | |||||||
Ward results[]
Abbey[]
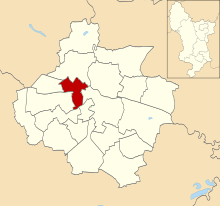
Location of Abbey ward
| Party | Candidate | Votes | % | |
|---|---|---|---|---|
| Labour | M. Fuller | 1,891 | ||
| Labour | M. Walker | 1,752 | ||
| Labour | J. Till | 1,725 | ||
| Conservative | A. Beckworth | 478 | ||
| Conservative | D. Sice | 353 | ||
| Conservative | I. Sice | 349 | ||
| Liberal Democrats | B. Harry | 253 | ||
| Liberal Democrats | J. Keane | 248 | ||
| Turnout | 25.6% | |||
| Labour hold | ||||
| Labour hold | ||||
| Labour hold | ||||
Allestree[]

Location of Allestree ward
| Party | Candidate | Votes | % | |
|---|---|---|---|---|
| Conservative | G. Du Sautoy | 1,838 | ||
| Conservative | R. Webb | 1,734 | ||
| Labour | J. Horobin | 1,087 | ||
| Labour | W. Cotton | 1,043 | ||
| Liberal Democrats | S. King | 413 | ||
| Liberal Democrats | T. Hall | 314 | ||
| Turnout | 42.6% | |||
| Conservative hold | ||||
| Conservative hold | ||||
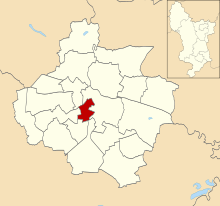
Alvaston[]

Location of Alvaston ward
| Party | Candidate | Votes | % | |
|---|---|---|---|---|
| Labour | J. Bayliss | 1,687 | ||
| Labour | N. Wawman | 1,532 | ||
| Conservative | G. Carran | 522 | ||
| Conservative | I. Gray | 480 | ||
| Liberal Democrats | D. Turner | 178 | ||
| Liberal Democrats | P. Turner | 167 | ||
| Turnout | 31.4% | |||
| Labour hold | ||||
| Labour gain from Conservative | ||||
Babington[]
Location of Babington ward
| Party | Candidate | Votes | % | |
|---|---|---|---|---|
| Labour | F. Hussain | 1,203 | ||
| Labour | A. Kalia | 1,160 | ||
| Labour | V. Wilsoncroft | 1,096 | ||
| Conservative | M. Hussain | 296 | ||
| Conservative | A. Alam | 257 | ||
| Conservative | J. Magee | 240 | ||
| Liberal Democrats | M. Sherazi | 139 | ||
| Liberal Democrats | M. Rashid | 131 | ||
| Liberal Democrats | A. Savage | 130 | ||
| Green | L. Davies | 95 | ||
| Turnout | 30.6% | |||
| Labour hold | ||||
| Labour hold | ||||
| Labour hold | ||||
Blagreaves[]
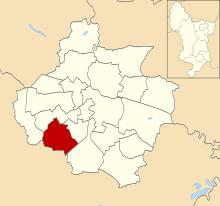
Location of Blagreaves ward
| Party | Candidate | Votes | % | |
|---|---|---|---|---|
| Labour | M. Redfern | 1,703 | ||
| Labour | M. Crosdale | 1,583 | ||
| Liberal Democrats | A. Spendlove | 1,580 | ||
| Liberal Democrats | E. Ashburner | 1,578 | ||
| Conservative | K. Lester | 832 | ||
| Conservative | P. McCandless | 736 | ||
| Turnout | 49.7% | |||
| Labour hold | ||||
| Labour gain from Conservative | ||||
Boulton[]
Location of Boulton ward
| Party | Candidate | Votes | % | |
|---|---|---|---|---|
| Labour | R. Blanksby | 1,973 | ||
| Labour | H. Dhindsa | 1,647 | ||
| Conservative | K. Thompson | 799 | ||
| Conservative | E. Birkinshaw | 724 | ||
| Liberal Democrats | P. Harlow | 361 | ||
| Liberal Democrats | R. Skelton | 206 | ||
| Independent | G. Hardy | 85 | ||
| Turnout | 36.7% | |||
| Labour hold | ||||
| Labour gain from Conservative | ||||
Breadsall[]

Location of Breadsall ward
| Party | Candidate | Votes | % | |
|---|---|---|---|---|
| Labour | P. Woodland | 3,139 | ||
| Labour | J. Whitby | 2,321 | ||
| Conservative | P. Latham | 1,862 | ||
| Conservative | G. Shaw | 1,560 | ||
| Liberal Democrats | M. Staines | 627 | ||
| Turnout | 34.9% | |||
| Labour hold | ||||
| Labour gain from Conservative | ||||
Chaddesden[]
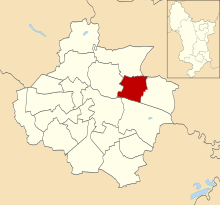
Location of Chaddesden ward
| Party | Candidate | Votes | % | |
|---|---|---|---|---|
| Labour | S. Bolton | 1,828 | ||
| Labour | M. Repton | 1,677 | ||
| Conservative | M. Kilminster | 764 | ||
| Conservative | H. Johnson | 731 | ||
| Liberal Democrats | L. Alcock | 355 | ||
| Liberal Democrats | P. Whitaker | 230 | ||
| Turnout | 36.3% | |||
| Labour hold | ||||
| Labour gain from Conservative | ||||
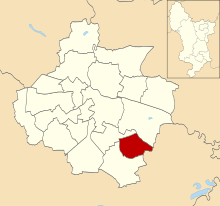
Chellaston[]

Location of Chellaston ward
| Party | Candidate | Votes | % | |
|---|---|---|---|---|
| Labour | D. Whitehead | 1,877 | ||
| Labour | B. Jackson | 1,852 | ||
| Conservative | J. Jennings | 1,569 | ||
| Conservative | M. Bertalan | 1,201 | ||
| Liberal Democrats | J. Eaton | 175 | ||
| Liberal Democrats | P. Kay | 158 | ||
| Turnout | 40.3% | |||
| Labour hold | ||||
| Labour gain from Conservative | ||||
Darley[]
Location of Darley ward
| Party | Candidate | Votes | % | |
|---|---|---|---|---|
| Labour | E. Wooley | 2,000 | ||
| Labour | J. Bijoux | 1,990 | ||
| Labour | P. Chadfield | 1,956 | ||
| Conservative | J. Brittain | 1,654 | ||
| Conservative | P. Hickson | 1,638 | ||
| Conservative | C. Hulls | 1,570 | ||
| Liberal Democrats | R. Jackson | 438 | ||
| Liberal Democrats | M. McCann | 423 | ||
| Liberal Democrats | G. Wood | 330 | ||
| Turnout | 44.4% | |||
| Labour hold | ||||
| Labour gain from Conservative | ||||
| Labour gain from Conservative | ||||
Derwent[]

Location of Derwent ward
| Party | Candidate | Votes | % | |
|---|---|---|---|---|
| Labour | D. Hayes | 1,742 | ||
| Labour | M. Young | 1,630 | ||
| Conservative | G. Francis | 317 | ||
| Conservative | C. Mellor | 302 | ||
| Liberal Democrats | P. Robinson | 212 | ||
| Turnout | 30.7% | |||
| Labour hold | ||||
| Labour hold | ||||
Kingsway[]

Location of Kingsway ward
| Party | Candidate | Votes | % | |
|---|---|---|---|---|
| Labour | A. Graves | 1,376 | ||
| Labour | K. Hill | 1,220 | ||
| Conservative | N. Brown | 961 | ||
| Conservative | B. Maw | 944 | ||
| Liberal Democrats | A. Crosby | 750 | ||
| Liberal Democrats | R. Troup | 521 | ||
| Turnout | 40.0% | |||
| Labour hold | ||||
| Labour gain from Conservative | ||||
Litchurch[]

Location of Litchurch ward
| Party | Candidate | Votes | % | |
|---|---|---|---|---|
| Labour | M. Akhtar | 1,221 | ||
| Labour | A. Rehman | 1,147 | ||
| Conservative | J. Alam | 429 | ||
| Conservative | M. Hussain | 379 | ||
| Green | J. Macdonald | 219 | ||
| Liberal Democrats | A. Piggott | 175 | ||
| Liberal Democrats | B. Sherazi | 93 | ||
| Turnout | 28.5% | |||
| Labour hold | ||||
| Labour hold | ||||
Littleover[]
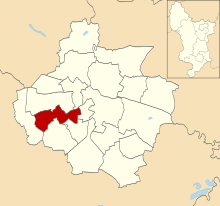
Location of Littleover ward
| Party | Candidate | Votes | % | |
|---|---|---|---|---|
| Liberal Democrats | L. Care | 2,065 | ||
| Liberal Democrats | M. Burgess | 1,879 | ||
| Labour | L. Shillingford | 779 | ||
| Labour | M. Manku | 778 | ||
| Conservative | A. Champion | 676 | ||
| Conservative | B. Samra | 559 | ||
| SDP | K. Dickenson | 36 | ||
| Turnout | 50.9% | |||
| Liberal Democrats hold | ||||
| Liberal Democrats hold | ||||
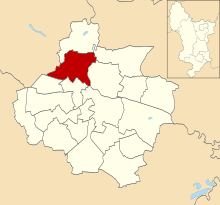
Mackworth[]
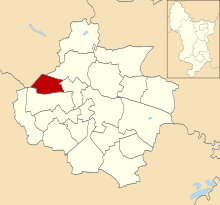
Location of Mackworth ward
| Party | Candidate | Votes | % | |
|---|---|---|---|---|
| Labour | R. Baxter | 1,649 | ||
| Labour | R. Gerrard | 1,503 | ||
| Conservative | J. Francis | 379 | ||
| Conservative | J. Veitch | 347 | ||
| Liberal Democrats | B. Benson | 216 | ||
| Liberal Democrats | J. Benson | 166 | ||
| Turnout | 36.5% | |||
| Labour hold | ||||
| Labour hold | ||||
Mickleover[]
Location of Mickleover ward
| Party | Candidate | Votes | % | |
|---|---|---|---|---|
| Labour | P. Taylor | 1,596 | ||
| Labour | A. Macdonald | 1,392 | ||
| Conservative | A. Griffiths | 1,247 | ||
| Conservative | R. Broadfield | 1,163 | ||
| Liberal Democrats | J. Foxon | 470 | ||
| Liberal Democrats | A. Wilbraham | 395 | ||
| Turnout | 37.5% | |||
| Labour hold | ||||
| Labour gain from Conservative | ||||
Normanton[]

Location of Normanton ward
| Party | Candidate | Votes | % | |
|---|---|---|---|---|
| Labour | R. Jones | 1,554 | ||
| Labour | Chris Williamson | 1,472 | ||
| Conservative | A. Blackwood | 311 | ||
| Conservative | J. Samra | 245 | ||
| Liberal Democrats | A. Cooper | 235 | ||
| Liberal Democrats | A. Hartropp | 206 | ||
| Green | E. Wall | 71 | ||
| Turnout | 32.2% | |||
| Labour hold | ||||
| Labour hold | ||||
Osmanton[]

Location of Osmaston ward
| Party | Candidate | Votes | % | |
|---|---|---|---|---|
| Labour | R. Laxton | 1,017 | ||
| Labour | J. McGiven | 878 | ||
| Liberal Democrats | C. Goacher | 236 | ||
| Liberal Democrats | I. Care | 193 | ||
| Turnout | 22.5% | |||
| Labour hold | ||||
| Labour hold | ||||
Sinfin[]

Location of Sinfin ward
| Party | Candidate | Votes | % | |
|---|---|---|---|---|
| Labour | A. Mullarkey | 1,765 | ||
| Labour | A. Nath | 1,576 | ||
| Conservative | H. Love | 231 | ||
| Liberal Democrats | P. Gale | 208 | ||
| Liberal Democrats | M. Platt | 203 | ||
| Conservative | A. Wood | 174 | ||
| Turnout | 29.4% | |||
| Labour hold | ||||
| Labour hold | ||||
Spondon[]

Location of Spondon ward
| Party | Candidate | Votes | % | |
|---|---|---|---|---|
| Labour | M. Byrne | 2,299 | ||
| Labour | J. Athern | 1,906 | ||
| Conservative | D. Black | 1,428 | ||
| Labour | R. Turner | 1,410 | ||
| Conservative | J. Lee | 1,347 | ||
| Conservative | A. Pegg | 1,299 | ||
| Liberal Democrats | P. Peat | 630 | ||
| Liberal Democrats | J. Whitaker | 313 | ||
| Turnout | 40.5% | |||
| Labour hold | ||||
| Labour hold | ||||
| Conservative hold | ||||
References[]
- ^ "Council compositions by year". The Elections Centre.
- ^ "Local Election Summaries 1996". The Elections Centre.
- ^ Rallings, Colin; Thrasher, Michael. Local Elections Handbook 1996 (PDF). The Elections Centre. Retrieved 21 February 2020.
- ^ a b c d e f g h i j k l m n o p q r s t "Derby City Council Election Results 1979-1995" (PDF). Elections Centre.
| Metropolitan boroughs | |
|---|---|
| Unitary authorities | |
| District councils | |
| Ad-hoc election | |
Categories:
- 1996 English local elections
- May 1996 events
- Derby City Council elections
- 1990s in Derbyshire