2010 South Korean local elections
| |||||||||||||||||||||||||||||||||||||||||
All 16 seats of Metropolitan Mayors and Governors (All 3,991 seats of Provincial and Municipal leaders and Assemblies) | |||||||||||||||||||||||||||||||||||||||||
|---|---|---|---|---|---|---|---|---|---|---|---|---|---|---|---|---|---|---|---|---|---|---|---|---|---|---|---|---|---|---|---|---|---|---|---|---|---|---|---|---|---|
| |||||||||||||||||||||||||||||||||||||||||
 Left top: Results of metropolitan mayoral and gubernatorial elections Right top: Results of municipal mayoral elections Left bottom: Results of provincial legislative elections Right top: Results of municipal legislative elections GNP DEP LFP DLP CKP NPP PFU PPP FU PPU Ind. | |||||||||||||||||||||||||||||||||||||||||


The 5th local elections were held in South Korea on 2 June 2010.[1] The voter turnout reached 54.4%, the highest in 15 years.[2]
Voter turnout by region[]
- Overall voter turnout: 54.5% (electoral: 38,851,159 Name / Number of votes: 21,166,886 people)
| Division | Electoral | Turnout | Percentage |
|---|---|---|---|
| Seoul | 8,211,461 | 4,426,182 | 53.8 |
| Busan | 2,849,895 | 1,410,126 | 49.5 |
| Daegu | 1,928,835 | 886,035 | 45.9 |
| Incheon | 2,096,853 | 1,067,431 | 50.9 |
| Gwangju | 1,064,913 | 529,901 | 49.8 |
| Daejeon | 1,127,547 | 596,683 | 52.9 |
| Ulsan | 838,805 | 462,103 | 55.1 |
| Gyeonggi-do | 8,761,840 | 4,534,771 | 51.8 |
| Gangwon-do | 1,190,509 | 741,724 | 62.3 |
| Chungcheongbuk-do | 1,183,811 | 696,393 | 58.8 |
| Chungcheongnam-do | 1,595,587 | 901,863 | 56.5 |
| Jeollabuk-do | 1,442,805 | 856,111 | 59.3 |
| Jeollanam-do | 1,504,902 | 967,338 | 64.3 |
| Gyeongsangbuk-do | 2,122,905 | 1,260,591 | 59.4 |
| Gyeongnam | 2,506,393 | 1,549,690 | 61.8 |
| Jeju-do | 424,098 | 276,056 | 65.1 |
- Source:투표진행상황
Provincial level elections[]
Metropolitan Mayoral and Gubernatorial elections[]
The ruling GNP was able to win 4 out of 7 mayoral seats but suffer by massive landslide on the gubernatorial election winning only 2 out of 9 seats. On the other hand, DEP was able to capture 2 mayoral seats and swept 5 out of 9 gubernatorial seats. The LFP won Daejeon while two independent candidates won gubernatorial seats one in Gyeongsangnam-do and the other in Jeju-do.
Metropolitan mayoral election winners[]
| Metropolitan cities | # | Candidate | Party | Votes | Percentage | Remarks |
|---|---|---|---|---|---|---|
| Seoul | 1 | Oh Se-hoon | ■ Grand National | 2,086,127 | 47.43% | |
| Gwangju | 2 | ■ Democratic | 297,003 | 56.73% | ||
| Daegu | 1 | ■ Grand National | 633,118 | 72.92% | ||
| Daejeon | 3 | ■ Liberty Forward | 276,122 | 46.67% | ||
| Busan | 1 | ■ Grand National | 770,507 | 55.42% | ||
| Ulsan | 1 | Park Maeng-woo | ■ Grand National | 279,421 | 61.26% | |
| Incheon | 2 | ■ Democratic | 556,902 | 52.69% |
Gubernatorial election winners[]
| Provinces | # | Candidate | Party | Votes | Percentage | Remarks |
|---|---|---|---|---|---|---|
| Gangwon-do | 2 | Lee Kwang-jae | ■ Democratic | 388,443 | 54.36% | |
| Gyeonggi-do | 1 | Kim Moon-soo | ■ Grand National | 2,271,492 | 52.20% | |
| Gyeongsangnam-do | 7 | Kim Doo-kwan | ■ Independent | 812,336 | 53.50% | |
| Gyeongsangbuk-do | 1 | ■ Grand National | 913,812 | 75.36% | ||
| Jeollanam-do | 2 | ■ Democratic | 629,984 | 68.3% | ||
| Jeollabuk-do | 2 | Kim Wan-ju | ■ Democratic | 569,980 | 68.67% | |
| Chungcheongnam-do | 2 | Ahn Hee-jung | ■ Democratic | 367,288 | 42.25% | |
| Chungcheongbuk-do | 2 | Lee Si-jong | ■ Democratic | 349,913 | 51.22% | |
| Jeju-do | 9 | ■ Independent | 110,603 | 41.40% |

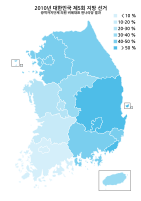
Provincial Governor election turnout rates

Metropolitan Mayoral and Governor election map by party
GNP Winning Margins on PR seats for provincial legislative elections 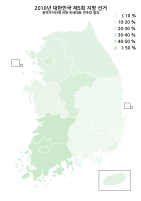
DEP Winning Margins on PR seats for provincial legislative elections 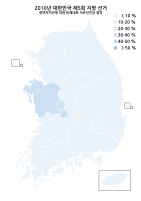
LFP Winning Margins on PR seats for provincial legislative elections 
DLP Winning Margins on PR seats for provincial legislative elections 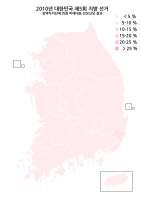
NPP Winning Margins on PR seats for provincial legislative elections 
PPP Winning Margins on PR seats for provincial legislative elections
Provincial legislative elections[]
| Division | ■ GNP | ■ DEP | ■ LFP | ■ DLP | ■ NPP | ■ PPP | ■ FU | ■ PPU | ■ Ind. | Total | ||||||||
|---|---|---|---|---|---|---|---|---|---|---|---|---|---|---|---|---|---|---|
| Seats | PR Seats | Seats | PR Seats | Seats | PR Seats | Seats | PR Seats | Seats | PR Seats | Seats | PR Seats | Seats | PR Seats | Seats | PR Seats | Seats | ||
| Seoul | 22 | 5 | 74 | 5 | 106 | |||||||||||||
| Gwangju | 18 | 2 | 1 | 1 | 22 | |||||||||||||
| Daegu | 25 | 2 | 1 | 1 | 29 | |||||||||||||
| Daejeon | 1 | 4 | 1 | 15 | 1 | 22 | ||||||||||||
| Busan | 37 | 3 | 2 | 5 | 47 | |||||||||||||
| Ulsan | 11 | 2 | 6 | 1 | 2 | 22 | ||||||||||||
| Incheon | 5 | 1 | 21 | 2 | 1 | 1 | 2 | 33 | ||||||||||
| Gangwon-do | 20 | 2 | 12 | 2 | 6 | 42 | ||||||||||||
| Gyeonggi-do | 36 | 6 | 71 | 5 | 1 | 1 | 1 | 1 | 2 | 124 | ||||||||
| Gyeongsangnam-do | 35 | 3 | 2 | 1 | 4 | 1 | 2 | 1 | 5 | 54 | ||||||||
| Gyeongsangbuk-do | 44 | 4 | 1 | 1 | 1 | 1 | 6 | 58 | ||||||||||
| Jeollanam-do | 1 | 45 | 4 | 2 | 1 | 4 | 57 | |||||||||||
| Jeollabuk-do | 1 | 33 | 2 | 1 | 1 | 38 | ||||||||||||
| Chungcheongnam-do | 5 | 1 | 12 | 1 | 19 | 2 | 40 | |||||||||||
| Chungcheongbuk-do | 3 | 1 | 20 | 2 | 4 | 1 | 31 | |||||||||||
| Jeju-do | 9 | 3 | 16 | 2 | 1 | 1 | 1 | 3 | 36 | |||||||||
| Grand Total | 253 | 35 | 328 | 32 | 38 | 3 | 18 | 6 | 3 | 0 | 3 | 2 | 1 | 0 | 1 | 2 | 36 | 761 |
Municipal level elections[]

Municipal Mayoral elections map by party
■ GNP ■ DEP ■ LFP ■ DLP ■ PFU ■ FU ■ Ind.
Mayoral elections[]
| Division | ■ GNP | ■ DEP | ■ LFP | ■ DLP | ■ PFU | ■ FU | ■ Ind. | Total |
|---|---|---|---|---|---|---|---|---|
| Seoul | 4 | 21 | 25 | |||||
| Gwangju | 4 | 1 | 5 | |||||
| Daejeon | 1 | 1 | 3 | 5 | ||||
| Daegu | 6 | 2 | 8 | |||||
| Busan | 13 | 3 | 16 | |||||
| Ulsan | 3 | 1 | 1 | 5 | ||||
| Incheon | 1 | 6 | 2 | 1 | 10 | |||
| Gangwon-do | 10 | 4 | 4 | 18 | ||||
| Gyeonggi-do | 10 | 19 | 2 | 31 | ||||
| Gyeongsangnam-do | 11 | 1 | 6 | 18 | ||||
| Gyeongsangbuk-do | 16 | 1 | 6 | 23 | ||||
| Jeollanam-do | 15 | 7 | 22 | |||||
| Jeollabuk-do | 13 | 1 | 14 | |||||
| Chungcheongnam-do | 4 | 3 | 7 | 1 | 1 | 16 | ||
| Chungcheongbuk-do | 3 | 5 | 3 | 1 | 12 | |||
| Jeju-do | No elections | |||||||
| Grand Total | 82 | 92 | 13 | 3 | 1 | 1 | 36 | 228 |
Municipal legislative elections[]
| Party | Seats | PR Seats | Total |
|---|---|---|---|
| ■ GNP | 1,087 | 160 | 1,247 |
| ■ DEP | 871 | 154 | 1,025 |
| ■ LFP | 95 | 22 | 117 |
| ■ DLP | 90 | 25 | 115 |
| ■ NPP | 22 | 0 | 22 |
| ■ PPP | 17 | 7 | 24 |
| ■ PPU | 12 | 7 | 19 |
| ■ FU | 10 | 1 | 11 |
| ■ PFU | 2 | 0 | 2 |
| ■ CKP | 1 | 0 | 1 |
| ■ Ind. | 305 | 0 | 305 |
| Grand Total | 2,512 | 376 | 2,888 |
References[]
- ^ Foundation, The Korea International Broadcasting. "한국을 대표하는 글로벌 방송! The World On Arirang!". June 2 Local Elections Voter Turnout : ARIRANG.
- ^ [6·2 국민의 선택] 투표율 54.5%… 15년만에 최고, 조선일보
External links[]
- 5th local elections results - the Central Election Management Committee
| Presidential elections | |
|---|---|
| Legislative elections | |
| By-elections | |
| Local elections | |
| Referendums | |
Categories:
- 2010 elections in South Korea
- Local elections in South Korea