2012 United States presidential election in Tennessee
| ||||||||||||||||||||||||||
| ||||||||||||||||||||||||||
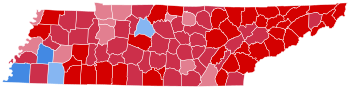 County Results
| ||||||||||||||||||||||||||
| ||||||||||||||||||||||||||


| Elections in Tennessee |
|---|
 |
|
|
|
|
|
|
|
|
|
|
2012 U.S. presidential election | |
|---|---|
|
|
| Democratic Party | |
|
|
| Republican Party | |
|
|
| Related races | |
|
|
| |
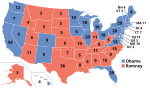
The 2012 United States presidential election in Tennessee took place on November 6, 2012, as part of the 2012 United States presidential election in which all 50 states plus the District of Columbia participated. Tennessee voters chose 11 electors to represent them in the Electoral College via a popular vote pitting incumbent Democratic President Barack Obama and his running mate, Vice President Joe Biden, against Republican challenger and former Massachusetts Governor Mitt Romney and his running mate, Congressman Paul Ryan.
Romney easily carried Tennessee's 11 electoral votes after he garnered 59.48% of the popular vote in Tennessee, to Obama's 39.08%.[1] Romney's 20.40% margin of victory was the strongest Republican performance in the state since Richard Nixon's 1972 landslide. Tennessee has not voted for a Democratic presidential nominee since 1996, when Bill Clinton won the state and many other states of the South, and the Volunteer State has not given a majority to a Democratic nominee since fellow Southerner Jimmy Carter carried it in 1976. Thus, Tennessee has been seen as part of the modern-day red wall in the 21st century. After 1996, the state has been growing more Republican with each election.[2] Even in 2008, when the rest of the country swung hard towards the left, John McCain's margin of victory increased to 15.06%, solidifying the state's Republican identity as East Tennessee joined the Appalachian region to become one of the most Republican areas of the country.
As consistent with the rest of the country, Obama carried heavily populated and diverse counties. The largest county, Shelby, was won by Obama by a 26.08% margin due to it being home to Memphis, Tennessee's largest city. In addition, the home of the state capital of Nashville, Davidson County, went to Obama by 18.58%. Hardeman and Haywood counties, both low-populated suburbs of Memphis, also went to Obama due to their high African American populations (42.2%[3] and 50.6%,[4] respectively). However, rural areas – including areas in the northwestern portion of the state that had long favored Democratic candidates – saw heavy margins for Romney, allowing him to offset Obama's wins in large cities. The eastern region of the state in Appalachia, some of the most historically Republican and Unionist counties in the country, saw margins of over 70% for the Republican ticket.[5]
Romney also flipped two counties, Houston and Jackson, to the Republican column. Both of these majority-white counties had been Democratic strongholds with their strong ties to secessionism: they only voted for a Republican presidential nominee once prior to this election, in 1928 and 1920, respectively.[6]
As of 2020, this is the most recent election in which Hardeman County was won by the Democratic presidential nominee.
General election[]
Results[]
| Party | Candidate | Running mate | Votes | Percentage | Electoral votes | |
|---|---|---|---|---|---|---|
| Republican | Mitt Romney | Paul Ryan | 1,462,330 | 59.48% | 11 | |
| Democratic | Barack Obama | Joe Biden | 960,709 | 39.08% | 0 | |
| Libertarian | Gary Johnson | Jim Gray | 18,623 | 0.67% | 0 | |
| Green | Jill Stein | Cheri Honkala | 6,515 | 0.26% | 0 | |
| Constitution | Virgil Goode | Jim Clymer | 6,022 | 0.24% | 0 | |
| Justice | Rocky Anderson | Luis J. Rodriguez | 2,639 | 0.11% | 0 | |
| American Third Position | Merlin Miller | Virginia D. Abernethy | 1,739 | 0.07% | 0 | |
| Totals | 2,458,577 | 100.00% | 11 | |||
By county[]
| County | Obama% | Obama# | Romney% | Romney# | Others% | Others# | Total |
|---|---|---|---|---|---|---|---|
| Anderson | 34.13% | 10,122 | 63.95% | 18,968 | 01.92% | 569 | 29,659 |
| Bedford | 29.15% | 4,211 | 69.46% | 10,034 | 01.38% | 200 | 14,445 |
| Benton | 36.27% | 2,258 | 61.84% | 3,850 | 01.90% | 118 | 6,226 |
| Bledsoe | 29.07% | 1,267 | 69.33% | 3,022 | 01.61% | 70 | 4,359 |
| Blount | 26.27% | 12,934 | 71.98% | 35,441 | 01.74% | 859 | 49,234 |
| Bradley | 22.35% | 8,037 | 76.25% | 27,422 | 01.40% | 504 | 35,963 |
| Campbell | 27.50% | 3,328 | 71.10% | 8,604 | 01.40% | 169 | 12,101 |
| Cannon | 31.45% | 1,564 | 66.54% | 3,309 | 02.01% | 100 | 4,973 |
| Carroll | 32.02% | 3,475 | 66.58% | 7,225 | 01.39% | 151 | 10,851 |
| Carter | 23.23% | 4,789 | 75.20% | 15,503 | 01.58% | 325 | 20,617 |
| Cheatham | 30.69% | 4,659 | 67.63% | 10,268 | 01.68% | 255 | 15,182 |
| Chester | 25.34% | 1,624 | 73.07% | 4,684 | 01.59% | 102 | 6,410 |
| Claiborne | 23.90% | 2,433 | 74.84% | 7,617 | 01.26% | 128 | 10,178 |
| Clay | 36.77% | 1,037 | 61.95% | 1,747 | 01.28% | 36 | 2,820 |
| Cocke | 24.48% | 2,804 | 73.85% | 8,459 | 01.67% | 191 | 11,454 |
| Coffee | 30.48% | 5,870 | 67.62% | 13,023 | 01.90% | 366 | 19,259 |
| Crockett | 30.36% | 1,669 | 68.81% | 3,783 | 00.84% | 46 | 5,498 |
| Cumberland | 24.80% | 6,261 | 73.88% | 18,653 | 01.32% | 333 | 25,247 |
| Davidson | 58.45% | 143,120 | 39.87% | 97,622 | 01.69% | 4,131 | 244,873 |
| Decatur | 30.65% | 1,303 | 67.61% | 2,874 | 01.74% | 74 | 4,251 |
| DeKalb | 33.85% | 2,174 | 64.51% | 4,143 | 01.64% | 105 | 6,422 |
| Dickson | 34.95% | 6,233 | 63.34% | 11,296 | 01.72% | 306 | 17,835 |
| Dyer | 27.22% | 3,757 | 71.89% | 9,921 | 00.88% | 122 | 13,800 |
| Fayette | 34.17% | 6,688 | 64.83% | 12,689 | 01.01% | 197 | 19,574 |
| Fentress | 22.64% | 1,561 | 76.04% | 5,243 | 01.32% | 91 | 6,895 |
| Franklin | 34.76% | 5,603 | 63.66% | 10,262 | 01.58% | 254 | 16,119 |
| Gibson | 33.38% | 6,564 | 65.51% | 12,883 | 01.12% | 220 | 19,667 |
| Giles | 34.82% | 3,760 | 64.03% | 6,915 | 01.15% | 124 | 10,799 |
| Grainger | 23.00% | 1,668 | 75.43% | 5,470 | 01.57% | 114 | 7,252 |
| Greene | 26.06% | 6,225 | 72.19% | 17,245 | 01.75% | 417 | 23,887 |
| Grundy | 38.78% | 1,643 | 59.38% | 2,516 | 01.84% | 78 | 4,237 |
| Hamblen | 26.13% | 5,234 | 72.49% | 14,522 | 01.38% | 276 | 20,032 |
| Hamilton | 41.67% | 58,836 | 56.62% | 79,933 | 01.71% | 2,412 | 141,181 |
| Hancock | 23.22% | 475 | 74.63% | 1,527 | 02.15% | 44 | 2,046 |
| Hardeman | 52.51% | 5,482 | 46.60% | 4,865 | 00.88% | 92 | 10,439 |
| Hardin | 23.51% | 2,467 | 75.14% | 7,886 | 01.35% | 142 | 10,495 |
| Hawkins | 25.70% | 5,088 | 72.65% | 14,382 | 01.65% | 327 | 19,797 |
| Haywood | 60.36% | 4,569 | 39.11% | 2,960 | 00.53% | 40 | 7,569 |
| Henderson | 25.03% | 2,517 | 73.80% | 7,421 | 01.16% | 117 | 10,055 |
| Henry | 34.06% | 4,339 | 64.31% | 8,193 | 01.62% | 207 | 12,739 |
| Hickman | 35.49% | 2,698 | 62.59% | 4,758 | 01.92% | 146 | 7,602 |
| Houston | 46.25% | 1,400 | 52.16% | 1,579 | 01.59% | 48 | 3,027 |
| Humphreys | 42.33% | 2,905 | 55.85% | 3,833 | 01.82% | 125 | 6,863 |
| Jackson | 41.56% | 1,739 | 56.96% | 2,383 | 01.48% | 62 | 4,184 |
| Jefferson | 24.10% | 4,232 | 74.25% | 13,038 | 01.65% | 289 | 17,559 |
| Johnson | 23.94% | 1,483 | 74.44% | 4,611 | 01.61% | 100 | 6,194 |
| Knox | 34.43% | 59,399 | 63.60% | 109,707 | 01.97% | 3,401 | 172,507 |
| Lake | 42.36% | 884 | 55.73% | 1,163 | 01.92% | 40 | 2,087 |
| Lauderdale | 46.16% | 4,011 | 53.12% | 4,616 | 00.71% | 62 | 8,689 |
| Lawrence | 27.84% | 4,237 | 70.77% | 10,770 | 01.39% | 212 | 15,219 |
| Lewis | 30.83% | 1,447 | 66.40% | 3,117 | 02.77% | 130 | 4,694 |
| Lincoln | 24.80% | 3,290 | 73.88% | 9,803 | 01.32% | 175 | 13,268 |
| Loudon | 22.91% | 5,058 | 75.69% | 16,707 | 01.40% | 308 | 22,073 |
| Macon | 22.48% | 1,552 | 76.18% | 5,260 | 01.35% | 93 | 6,905 |
| Madison | 45.13% | 18,367 | 54.03% | 21,993 | 00.84% | 342 | 40,702 |
| Marion | 37.98% | 3,953 | 60.26% | 6,272 | 01.77% | 184 | 10,409 |
| Marshall | 34.68% | 3,725 | 63.61% | 6,832 | 01.71% | 184 | 10,741 |
| Maury | 35.83% | 11,825 | 62.74% | 20,708 | 01.43% | 473 | 33,006 |
| McMinn | 25.84% | 4,609 | 72.71% | 12,967 | 01.45% | 258 | 17,834 |
| McNairy | 26.98% | 2,645 | 71.57% | 7,015 | 01.45% | 142 | 9,802 |
| Meigs | 29.34% | 1,163 | 68.97% | 2,734 | 01.69% | 67 | 3,964 |
| Monroe | 26.76% | 4,372 | 71.80% | 11,731 | 01.44% | 235 | 16,338 |
| Montgomery | 44.08% | 24,499 | 54.41% | 30,245 | 01.51% | 840 | 55,584 |
| Moore | 25.19% | 705 | 73.35% | 2,053 | 01.46% | 41 | 2,799 |
| Morgan | 26.52% | 1,725 | 71.79% | 4,669 | 01.69% | 110 | 6,504 |
| Obion | 27.01% | 3,321 | 71.68% | 8,814 | 01.32% | 162 | 12,297 |
| Overton | 36.60% | 2,805 | 62.30% | 4,775 | 01.10% | 84 | 7,664 |
| Perry | 37.85% | 992 | 60.21% | 1,578 | 01.95% | 51 | 2,621 |
| Pickett | 29.03% | 712 | 69.79% | 1,712 | 01.18% | 29 | 2,453 |
| Polk | 30.63% | 1,856 | 67.80% | 4,108 | 01.57% | 95 | 6,059 |
| Putnam | 30.60% | 7,802 | 67.66% | 17,254 | 01.74% | 444 | 25,500 |
| Rhea | 24.82% | 2,628 | 73.67% | 7,802 | 01.51% | 160 | 10,590 |
| Roane | 28.53% | 6,018 | 69.82% | 14,724 | 01.65% | 348 | 21,090 |
| Robertson | 31.53% | 8,290 | 67.11% | 17,643 | 01.35% | 356 | 26,289 |
| Rutherford | 36.84% | 36,414 | 61.56% | 60,846 | 01.61% | 1,588 | 98,848 |
| Scott | 21.78% | 1,452 | 76.74% | 5,117 | 01.48% | 99 | 6,668 |
| Sequatchie | 28.96% | 1,489 | 68.86% | 3,541 | 02.18% | 112 | 5,142 |
| Sevier | 21.91% | 7,418 | 76.73% | 25,984 | 01.36% | 462 | 33,864 |
| Shelby | 62.63% | 232,443 | 36.55% | 135,649 | 00.81% | 3,017 | 371,109 |
| Smith | 34.85% | 2,470 | 63.43% | 4,495 | 01.72% | 122 | 7,087 |
| Stewart | 40.45% | 2,069 | 57.93% | 2,963 | 01.62% | 83 | 5,115 |
| Sullivan | 25.58% | 15,321 | 72.74% | 43,562 | 01.68% | 1,004 | 59,887 |
| Sumner | 28.42% | 18,579 | 70.38% | 46,003 | 01.20% | 784 | 65,366 |
| Tipton | 29.62% | 7,133 | 69.23% | 16,672 | 01.15% | 276 | 24,081 |
| Trousdale | 42.69% | 1,240 | 55.49% | 1,612 | 01.82% | 53 | 2,905 |
| Unicoi | 27.00% | 1,913 | 71.01% | 5,032 | 01.99% | 141 | 7,086 |
| Union | 25.36% | 1,478 | 73.47% | 4,282 | 01.17% | 68 | 5,828 |
| Van Buren | 38.04% | 875 | 60.26% | 1,386 | 01.70% | 39 | 2,300 |
| Warren | 36.51% | 4,752 | 61.54% | 8,010 | 01.94% | 253 | 13,015 |
| Washington | 29.82% | 14,325 | 68.30% | 32,808 | 01.87% | 899 | 48,032 |
| Wayne | 21.20% | 1,163 | 77.52% | 4,253 | 01.28% | 70 | 5,486 |
| Weakley | 28.76% | 3,548 | 69.75% | 8,605 | 01.49% | 184 | 12,337 |
| White | 30.58% | 2,795 | 67.80% | 6,197 | 01.62% | 148 | 9,140 |
| Williamson | 26.13% | 25,142 | 72.59% | 69,850 | 01.28% | 1,233 | 96,225 |
| Wilson | 28.53% | 14,695 | 70.12% | 36,109 | 01.35% | 695 | 51,499 |
Counties that flipped from Democratic to Republican[]
- Houston (largest city: Erin)
- Jackson (largest town: Gainesboro)
By congressional district[]
Mitt Romney swept the state and carried seven of the state's nine congressional districts, all represented by Republicans. Barack Obama carried the state's two congressional districts, the 5th and 9th, anchored by the two largest cities of Nashville and Memphis, respectively.[7]
| District | Romney | Obama | Representative |
|---|---|---|---|
| 1st | 72.7% | 25.7% | |
| Phil Roe | |||
| 2nd | 67.3% | 30.9% | John J. Duncan, Jr. |
| 3rd | 63.3% | 35.1% | Chuck Fleischmann |
| 4th | 65.3% | 33.1% | Scott DesJarlais |
| 5th | 42.5% | 55.9% | Jim Cooper |
| 6th | 69.1% | 29.5% | Diane Black |
| 7th | 65.7% | 32.9% | Marsha Blackburn |
| 8th | 66.1% | 32.8% | Stephen Fincher |
| 9th | 20.9% | 78.3% | Steve Cohen |
Democratic primary[]
| |||||||||||||||||||
| |||||||||||||||||||
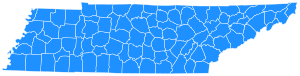 Tennessee results by county
Barack Obama | |||||||||||||||||||
The 2012 democratic primary in Tennessee took place on Super Tuesday, March 6, 2012, with Barack Obama receiving 80,355 (88.5%) votes. Other candidates received a combined total of 10,411 (11.5%) votes.[8] Tennessee had a total of 91 delegates to the 2012 Democratic National Convention, of which 82 were pledged to presidential contenders depending on the popular vote. The remaining 9 super-delegates were unbound.
| Candidate | Popular vote | Delegates | |||
|---|---|---|---|---|---|
| Count | Percentage | Pledged delegates | Super delegates | Total delegates | |
| 80,705 | 88.48% | 82 | 9 | 91 | |
| Uncommitted | 10,497 | 11.51% | 0 | 0 | 0 |
| John Wolfe Jr. (write-in) | 7 | 0.00% | 0 | 0 | 0 |
| Total: | 91,209 | 100% | 91 | 29 | 251 |
Republican primary[]
| |||||||||||||||||||||||||||||||||||||||||
| |||||||||||||||||||||||||||||||||||||||||
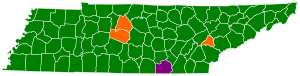 Tennessee results by county
Rick Santorum
Mitt Romney
Newt Gingrich | |||||||||||||||||||||||||||||||||||||||||

The Republican primary took place on Super Tuesday, March 6, 2012.[10][11]
Tennessee has 58 delegates to the 2012 Republican National Convention. Three superdelegates are unbound. 27 delegates are awarded by congressional district, 3 delegates for each district. If a candidate wins two-thirds of the vote in a district, he takes all 3 delegates there; if not, delegates are split 2-to-1 between the top two candidates. Another 28 delegates are awarded to the candidate who wins two-thirds of the vote statewide, or allocated proportionately among candidates winning at least 20% of the vote if no one gets two-thirds.[12]
Former Senator from Pennsylvania Rick Santorum won the primary with a plurality, carrying 37.11% of the vote and all but four counties, awarding him 29 delegates. Former Massachusetts Governor and eventual nominee, Mitt Romney, came second with 28.06% of the vote and 19 delegates. He carried only three counties: Davidson, Loudon, and Williamson. Former Speaker of the House of Representatives, Newt Gingrich of neighboring Georgia, came third with 23.96% of the vote and 9 delegates, carrying only the county of Marion. Representative from Texas Ron Paul received 9.04% of the vote and all other candidates received under 1% of the vote.[13]
Results[]
| Candidate | Votes | Percentage | Projected delegate count | ||
|---|---|---|---|---|---|
| NYT [15] |
CNN [16] |
FOX [17] | |||
| 205,809 | 37.11% | 29 | 27 | 26 | |
| Mitt Romney | 155,630 | 28.06% | 14 | 15 | 12 |
| Newt Gingrich | 132,889 | 23.96% | 9 | 8 | 9 |
| Ron Paul | 50,156 | 9.04% | 0 | 0 | 0 |
| Rick Perry (withdrawn) | 1,966 | 0.35% | 0 | 0 | 0 |
| Michele Bachmann (withdrawn) | 1,895 | 0.34% | 0 | 0 | 0 |
| Jon Huntsman (withdrawn) | 1,239 | 0.22% | 0 | 0 | 0 |
| Buddy Roemer (withdrawn) | 881 | 0.16% | 0 | 0 | 0 |
| Gary Johnson (withdrawn) | 572 | 0.10% | 0 | 0 | 0 |
| Uncommitted | 3,536 | 0.64% | 0 | 0 | 0 |
| Unprojected delegates: | 6 | 8 | 9 | ||
| Total: | 554,573 | 100.00% | 58 | 58 | 58 |
See also[]
- 2012 United States presidential election
- 2012 Republican Party presidential debates and forums
- 2012 Republican Party presidential primaries
- Results of the 2012 Republican Party presidential primaries
- Tennessee Republican Party
- 2012 Democratic Party presidential primaries
- Tennessee Democratic Party
References[]
- ^ "Dave Leip's Atlas of U.S. Presidential Elections - Tennessee". Retrieved 4 January 2013.
- ^ Moskowitz, Seth (March 2, 2020). "The Road to 270: Tennessee". 270toWin. Retrieved 2020-11-29.
- ^ "U.S. Census Bureau QuickFacts: Hardeman County, Tennessee". United States Census Bureau. Retrieved November 29, 2020.
- ^ "U.S. Census Bureau QuickFacts: Haywood County, Tennessee". United States Census Bureau. Retrieved November 29, 2020.
- ^ Rothenberg, Stuart (October 3, 2017). "What Happened to Mountain Republicans in the South?". Inside Elections. Retrieved November 29, 2020.
- ^ Skelley, Geoffrey. "County winners, 1836-2016". Google Sheets. Retrieved November 29, 2020.
- ^ [1]
- ^ "State of Tennessee Democratic presidential primary" (PDF). Archived from the original (PDF) on 2017-02-12. Retrieved 2016-09-17.
- ^ "State of Tennessee March 6, 2012 Democratic Primary Presidential Preference" (PDF). Tennessee Elections. Tennessee Secretary of State. Archived from the original (PDF) on February 12, 2017. Retrieved September 17, 2016.
- ^ "Primary and Caucus Printable Calendar". CNN. Retrieved January 12, 2012.
- ^ "Presidential Primary Dates" (PDF). Federal Election Commission. Retrieved January 23, 2012.
- ^ Nate Silver (March 4, 2012). "Romney Could Win Majority of Super Tuesday Delegates". FiveThirtyEight. Retrieved March 5, 2012.
- ^ "Tennessee Republican Primary - Election Results". The New York Times. ISSN 0362-4331. Retrieved 2020-11-29.
- ^ http://state.tn.us/sos/election/results/2012-03/RepPresStateCertCountyTotals.pdf
- ^ Tennessee - New York Times
- ^ Tennessee - CNN
- ^ "Tennessee - Fox News". Fox News. Archived from the original on 2012-04-07. Retrieved 2012-03-29.
External links[]
- The Green Papers for Tennessee (Republican)
- The Green Papers for Tennessee (Democratic)
- The Green Papers: Major state elections in chronological order
State and district results of the 2012 United States presidential election | ||
|---|---|---|
|  | |
- United States presidential elections in Tennessee
- 2012 Tennessee elections
- 2012 United States presidential election by state