Main article: 2014 Northern Ireland local elections
Elections to Belfast City Council were held on 22 May 2014 – on the same day as other local government elections in Northern Ireland – as part of the process of local government reform provided for in the Local Government Act (Northern Ireland) 2014.
The councils elected in the 2014 local elections across Northern Ireland operated in shadow form for one year, with the 26 councils which they replaced existing in parallel.[1] [2]
This reform saw the Belfast City Council area expand from 51 to 60 wards. Expansion saw some areas along the western, southern and eastern fringes of Belfast incorporated into the city, with a total of 53,000 additional residents and 21,000 households transferred from bordering council areas.[3] councillors were elected.[4]
Data derived from the Council website.[5] [6]
Results by party [ ]
Party
Votes
%
±
Seats
%
±
Sinn Féin
31,894
29.2
19
31.7
DUP
20,751
19.0
13
21.7
Alliance
12,478
11.4
8
13.3
SDLP
10,892
10.0
7
11.7
UUP
9,804
9.0
7
11.7
PUP
7,096
6.5
3
5.0
TUV
2,883
2.6
1
1.7
Green (NI)
2,524
2.3
1
1.7
People Before Profit
1,691
1.5
1
1.7
NI21
2,953
2.7
N/A
0
0.0
Éirígí
1,756
1.6
0
0.0
UKIP
1,162
1.1
N/A
0
0.0
Workers' Party
985
0.9
0
0.0
Republican Network
502
0.5
N/A
0
0.0
NI Conservatives
361
0.3
0
0.0
Socialist Party
272
0.2
0
0.0
Independent
1,152
1.1
0
0.0
-1
Totals:
109,156
100.0
60
+9
Source: Belfast City Council
Results by Electoral Area [ ] Summary [ ]
Results of the Belfast City Council election, 2014
Sinn Féin DUP Alliance SDLP UUP PUP Green TUV Others
Balmoral
17.1
1
21.5
1
13.9
1
23.7
1
9.9
1
6.0
0
2.5
0
0.0
0
5.3
0
5
Black Mountain
68.0
5
0.0
0
0.8
0
10.0
1
0.0
0
0.0
0
0.0
0
0.0
0
21.2
1
7
Botanic
14.7
1
14.1
1
17.9
1
16.7
1
8.5
1
3.9
0
8.6
0
5.7
0
9.9
0
5
Castle
25.1
1
24.7
2
9.6
1
16.6
1
10.7
1
6.2
0
0.0
0
0.0
0
7.1
0
6
Collin
67.4
5
0.0
0
3.8
0
14.1
1
4.3
0
0.0
0
0.0
0
0.0
0
10.3
0
6
Court
24.0
2
31.0
2
1.1
0
4.9
0
5.7
0
19.8
1
0.0
0
7.3
1
6.3
0
6
Lisnasharragh
6.1
0
32.8
2
24.6
2
8.4
1
13.0
1
6.0
0
4.6
0
0.0
0
4.5
0
6
Oldpark
44.6
3
18.1
1
3.0
0
8.8
1
3.5
0
7.3
1
0.0
0
3.0
0
11.6
0
6
Ormiston
0.4
0
26.4
2
27.1
2
0.7
0
19.3
2
5.5
0
6.4
1
4.9
0
9.2
0
7
Titanic
11.7
1
26.1
2
15.1
2
1.0
0
16.7
1
11.6
1
2.1
0
5.8
0
9.8
0
6
Total
29.2
19
19.0
13
11.4
8
10.0
7
9.0
7
6.5
3
2.3
1
2.6
1
10.0
1
60
Balmoral [ ]
Balmoral - 5 seats
Count
Sinn Féin
Máirtín Ó Muilleoir 17.13%
1,525
SDLP
Claire Hanna 17.12%
1,524
Alliance
Paula Bradshaw 9.06%
806
809.66
812.42
830.60
896.05
986.43
989.46
1,435.23
1,748.23
DUP
Christopher Stalford 10.88%
968
968.36
968.52
981.54
986.54
1,000.54
1,233.58
1,234.58
1,247.47
1,256.50
UUP
Jeffrey Dudgeon 9.86%
878
878
878.20
908.20
917.20
955.22
1,129.22
1,141.26
1,170.51
1,191.50
DUP
Sarah Clarke
10.67%
950
950.09
950.23
956.23
957.23
966.23
1,063.23
1,069.25
1,083.16
1,090.20
SDLP
Justin Cartwright
6.62%
589
613.93
635.39
648.80
690.62
740.48
746.50
810.83
Alliance
Jamie Doyle
4.83%
430
434.71
437.47
454.65
515.39
594.08
601.13
PUP
Simon Rice
5.99%
533
533.03
533.11
544.11
546.11
553.14
NI21
Tina McKenzie
2.88%
256
257.38
258.32
325.81
349.12
Green (NI)
Elli Kontorravdis
2.52%
224
226.73
227.47
251.63
NI21
Barbara Neeson
0.83%
74
74.60
74.80
NI Conservatives
David Timson
0.83%
74
74.18
74.22
Independent
Gerard Collins
0.79%
70
70.57
70.81
Electorate: 17,107 Valid: 8,901 (52.03%) Spoilt: 131 Quota: 1,484 Turnout: 9,032 (52.80%)
Black Mountain [ ]
Black Mountain - 7 seats
Count
Sinn Féin
Steven Corr *
12.86%
1,793
Sinn Féin
Janice Austin *†
12.80%
1,784
People Before Profit
Gerry Carroll 12.13%
1,691
1,789
Sinn Féin
Emma Groves *
11.68%
1,628
1,637
1,757
Sinn Féin
Arder Carson *
10.82%
1,509
1,527
1,628
1,629.68
1,634.18
1,636.12
1,641.44
SDLP
Tim Attwood *
9.02%
1,258
1,452
1,596
1,597.18
1,631.68
1,632.72
1,634.26
Sinn Féin
Ciarán Beattie *
9.61%
1,340
1,369
1,472
1,501.46
1,504.46
1,534.22
1,538.14
Sinn Féin
Caoimhín Mhic Giolla Mhin*
10.24%
1,428
1,450
1,521
1,522.30
1,526.05
1,527.19
1,529.71
Éirígí
Pádraic MacCoitir
7.36%
1,026
1,040
Workers' Party
Joanne Lowry
1.14%
159
SDLP
Gerard McDonald
0.95%
133
Alliance
Lauren Gray
0.79%
110
NI21
Chris Valente
0.60%
83
Electorate: 25,146 Valid: 13,942 (55.44%) Spoilt: 369 Quota: 1,743 Turnout: 14,311 (56.91%)
Botanic [ ]
Botanic - 5 seats
Count
DUP
Ruth Patterson * ‡–
14.10%
1,268
1,268
1,280
1,282
1,284
1,508
Alliance
Emmet McDonough-Brown
9.37%
843
850
865
881
925
925
1,011
1,061
1,065
1,706
Sinn Féin
Deirdre Hargey 14.74%
1,326
1,343
1,346
1,370
1,377
1,378
1,393
1,479
1,483
1,520
SDLP
Declan Boyle ‡
10.80%
971
978
983
992
1,007
1,009
1,034
1,344
1,347
1,405
1,473.40
UUP
Graham Craig ‡
8.52%
766
767
795
798
808
858
897
900
1,333
1,357
1,380.60
Green (NI)
Clare Bailey
8.58%
772
792
806
860
876
879
973
994
1,010
1,141
1,253.80
Alliance
Duncan Morrow
8.55%
769
770
775
787
812
815
878
929
939
TUV
Billy Dickson
5.66%
509
509
516
519
521
579
588
593
SDLP
Patrick McCarthy *
5.89%
530
545
552
559
565
565
576
NI21
Eileen Chan-Hu
2.90%
261
264
271
278
398
400
PUP
Ewan Suttie
3.90%
351
351
353
356
357
NI21
Ben Matthews
2.59%
233
235
247
254
Socialist Party
Paddy Meehan
1.82%
164
172
173
NI Conservatives
Ben Manton
1.39%
125
127
Workers' Party
Paddy Lynn
1.18%
106
Electorate: 19,462 Valid: 8,994 (46.21%) Spoilt: 192 Quota: 1,500 Turnout: 9,186 (47.20%)
Castle [ ]
Castle - 6 seats
Count
Sinn Féin
Mary Ellen Campbell *
15.31%
1,619
SDLP
Patrick Convery * ‡
11.32%
1,197
1,206.60
1,229.66
1,335.90
1,756.90
Alliance
Nuala McAllister
9.64%
1,020
1,021.80
1,064.86
1,261.10
1,388.58
1,410.58
1,549.18
DUP
Guy Spence *
12.66%
1,339
1,339.12
1,340.12
1,356.12
1,357.12
1,493.12
1,493.89
DUP
Lydia Patterson *
12.06%
1,276
1,276.18
1,277.18
1,287.18
1,295.18
1,463.18
1,467.03
UUP
David Browne 10.71%
1,133
1,133.12
1,136.12
1,158.12
1,163.12
1,459.12
1,465.28
Sinn Féin
Tierna Cunningham*
9.81%
1,038
1,117.14
1,144.38
1,216.40
1,258.48
1,259.48
1,352.65
PUP
William McQuade
6.21%
657
657.00
659.00
673.00
677.00
SDLP
Cathal Mullaghan
5.24%
554
555.98
596.98
651.28
NI21
Alison Crawford
3.18%
336
337.08
343.08
Independent
Fra Hughes
2.06%
218
219.02
245.02
Workers' Party
Gemma Weir
1.81%
191
191.48
Electorate: 20,977 Valid: 10,578 (50.43%) Spoilt: 175 Quota: 1,512 Turnout: 10,753 (51.26%)
Collin [ ]
Collin - 6 seats
Count
Sinn Féin
David Bell *†
14.96%
1,669
Sinn Féin
Stephen Magennis *
14.50%
1,618
SDLP
Brian Heading *
9.56%
1,067
1,069.68
1,069.90
1,216.19
1,246.19
1,624.19
Sinn Féin
Matt Garrett *
13.01%
1,452
1,504.56
1,504.84
1,540.24
1,545.24
1,579.50
1,708.50
Sinn Féin
Charlene O'Hara *
13.23%
1,476
1,479.40
1,493.43
1,507.56
1,512.61
1,544.89
1,658.89
Sinn Féin
Bill Groves * †
11.72%
1,308
1,310.40
1,311.08
1,315.16
1,315.31
1,336.41
1,427.69
NI21
Wendy Burke
3.83%
427
427.56
427.58
514.70
753.74
802.75
806.82
Éirígí
Máire Drumm
6.54%
730
731.76
732.06
740.19
744.19
751.30
SDLP
Laura Whinnery
4.58%
511
511.68
511.89
571.94
601.94
UUP
Gareth Martin
4.27%
476
476.08
476.24
486.24
Alliance
Gerard Catney
3.80%
424
425.24
425.28
Electorate: 20,017 Valid: 11,158 (50.68%) Spoilt: 202 Quota: 1,512 Turnout: 11,360 (51.60%)
Court [ ]
Court - 6 seats
Count
PUP
Billy Hutchinson 14.55%
1,674
1,674
1,674
1,674
1,674
1,674
1,674
DUP
Frank McCoubrey 13.53%
1,557
1,557
1,569
1,569
1,570
1,769
DUP
9.86%
1,134
1,136
1,154
1,154
1,157
1,207
1,311.58
1,313.63
1,715.63
Sinn Féin
Mary McConville
12.17%
1,400
1,400
1,419
1,485
1,533
1,535
1,535.00
1,535.02
1,536.02
1,536.02
1,539.04
1,732.04
Sinn Féin
Jim McVeigh *†
11.79%
1,357
1,357
1,362
1,398
1,410
1,411
1,411.00
1,411.01
1,412.01
1,412.30
1,413.32
1,547.33
TUV
Jolene Bunting ‡
7.29%
839
842
852
854
856
865
865.63
866.51
888.87
905.88
1,123.89
1,135.16
UUP
Bill Manwaring
5.66%
651
653
674
675
677
685
688.78
689.85
754.69
785.74
1,098.70
1,117.80
SDLP
Colin Keenan*
4.89%
563
566
635
697
809
809
809.00
809.04
812.67
813.75
818.31
PUP
Billy Mawhinney
5.28%
607
610
621
621
625
629
631.52
643.17
713.41
734.47
DUP
Nicola Verner*
4.49%
516
516
519
519
521
609
621.60
622.26
DUP
Naomi Thompson*
3.17%
365
366
366
368
369
Workers' Party
John Lowry
2.57%
296
297
319
334
Republican Network
Tommy Doherty
2.45%
282
282
284
Alliance
Sheila Gallagher
1.12%
129
130
NI21
Stuart Hunter
1.02%
117
117
Independent
Willie Faulkner
0.16%
18
Electorate: 20,881 Valid: 11,505 (55.10%) Spoilt: 304 Quota: 1,644 Turnout: 11,809 (56.55%)
Lisnasharragh [ ]
Lisnasharragh - 6 seats
Count
Alliance
Michael Long *
16.44%
1,726
DUP
Aileen Graham
14.73%
1,546
UUP
Chris McGimpsey *
12.98%
1,362
1,370.19
1,384.20
1,432.10
1,462.40
1,464.37
1,764.37
Alliance
Carole Howard *
8.19%
860
1,016.52
1,032.70
1,157.20
1,412.40
1,413.24
1,427.50
1,547.50
SDLP
Kate Mullan * ‡
8.36%
878
899.58
901.71
931.88
1,019.80
1,019.89
1,029.89
1,500.89
DUP
Tommy Sandford *
9.34%
980
983.12
994.12
1,013.30
1,024.30
1,041.80
1,226.43
1,230.69
1,354.69
DUP
Colin Hussey
8.73%
916
918.34
927.47
944.60
960.60
985.59
1,071.68
1,071.68
1,152.68
Sinn Féin
Dermot Kennedy
6.07%
637
642.59
642.59
649.85
693.11
693.11
697.14
PUP
Helen Smyth
6.00%
630
631.04
641.04
660.17
684.30
684.72
Green (NI)
Connal Hughes
4.62%
485
497.35
503.48
590.17
NI21
Leah McDonnell
3.00%
315
323.45
414.71
NI21
Pete Wray
1.54%
162
163.82
Electorate: 20,089 Valid: 10,497 (52.25%) Spoilt: 159 Quota: 1,500 Turnout: 10,656 (53.04%)
Oldpark [ ]
Oldpark - 6 seats
Count
Sinn Féin
Mary Clarke
14.80%
1,559
Sinn Féin
J.J. Magee *
11.77%
1,240
1,250.00
1,260.00
1,263.18
1,263.18
1,275.20
1,279.30
1,831.30
Sinn Féin
Gerry McCabe * †
11.46%
1,207
1,214.00
1,226.00
1,229.69
1,229.69
1,239.70
1,239.70
1,341.00
1,627.40
DUP
Gareth McKee * †
10.81%
1,139
1,141.00
1,141.00
1,141.03
1,213.03
1,234.00
1,437.00
1,438.10
1,438.10
2,116.10
PUP
Julie-Anne Corr
7.35%
774
788.00
788.00
788.12
899.12
907.15
1,031.20
1,031.20
1,031.20
1,163.20
1,658.20
SDLP
Nichola Mallon 8.76%
923
955.00
970.00
972.73
972.73
1,110.80
1,119.80
1,176.70
1,204.60
1,211.60
1,219.60
1,247.60
Independent
Dee Fennell
8.03%
846
859.00
980.00
982.55
984.55
1,004.60
1,008.60
1,035.10
1,042.50
1,046.50
1,050.50
1,086.50
DUP
Lee Reynolds*
7.25%
764
768.00
768.00
768.00
802.00
817.00
888.00
889.00
889.00
Sinn Féin
John Loughran
6.62%
697
711.00
730.00
763.39
763.39
782.48
784.48
UUP
Colin Houston
3.47%
366
371.00
372.00
372.03
461.03
481.03
Alliance
Peter McReynolds
3.04%
320
347.00
349.00
349.30
352.30
TUV
Wayne Gilmour
3.01%
317
320.00
320.00
320.00
Republican Network
Sammy Cusick
2.09%
220
231.00
Workers' Party
Christopher Bailie
1.55%
163
Electorate: 20,888 Valid: 10,535 (50.44%) Spoilt: 258 Quota: 1,506 Turnout: 10,793 (51.67%)
Ormiston [ ]
Ormiston - 7 seats
Count
UUP
Jim Rodgers 14.53%
1,899
Alliance
Mervyn Jones * †
9.06%
1,184
1,188.48
1,222.48
1,231.76
1,298.76
1,356.46
1,367.46
1,378.60
1,412.60
1,418.60
1,898.74
Alliance
Laura McNamee * †
6.87%
898
902.20
923.20
929.34
980.34
1,405.60
1,407.60
1,414.60
1,425.60
1,438.70
1,781.74
UUP
Peter Johnston
4.76%
622
768.58
769.72
812.54
877.22
887.06
1,035.16
1,081.22
1,231.18
1,478.50
1,501.18
1,607.80
1,639.76
DUP
Tom Haire *
8.20%
1,072
1,083.62
1,083.62
1,088.76
1,101.90
1,101.90
1,173.60
1,297.28
1,467.26
1,568.80
1,581.80
1,583.99
1,585.35
DUP
John Hussey *
6.28%
821
830.94
830.94
837.36
849.36
849.36
917.34
1,346.96
1,424.50
1,544.00
1,555.04
1,560.15
1,568.31
Green (NI)
Ross Brown 6.36%
831
836.18
853.18
872.32
970.02
996.30
1,015.30
1,038.58
1,108.14
1,158.70
1,270.26
1,408.96
1,506.88
DUP
Denny Vitty *
6.19%
809
834.90
836.90
847.46
860.46
864.46
907.88
1,020.56
1,078.84
1,304.48
1,318.04
1,328.99
1,334.43
Alliance
Ross McMullan
6.88%
899
902.50
949.50
950.78
987.78
1,063.48
1,066.48
1,077.90
1,090.90
1,102.04
PUP
Ian Shanks
5.51%
720
728.96
729.96
737.24
745.38
746.52
824.66
835.36
938.20
UKIP
Stephen Crosby
4.73%
618
623.04
624.04
639.04
660.18
664.18
820.44
834.00
DUP
Brian Kennedy*
5.74%
750
763.72
765.72
773.56
780.70
783.98
811.68
TUV
John Hiddleston
4.90%
640
647.00
648.00
654.00
657.14
658.14
Alliance
Andrew Webb*
4.29%
561
565.76
572.76
581.90
611.90
NI21
Ian Dickson
1.87%
245
246.82
248.82
255.82
NI21
Jayne Olorunda
1.47%
192
193.40
195.40
203.54
NI Conservatives
Ian Reid
1.24%
162
167.74
168.74
SDLP
Michael McMillan
0.73%
95
95.00
Sinn Féin
Laura Keenan
0.43%
56
56.14
Electorate: 20,881 Valid: 13,074 (62.61%) Spoilt: 118 Quota: 1,635 Turnout: 13,192 (63.18%)
Titanic [ ]
Titanic - 6 seats
Count
UUP
Sonia Copeland
16.68%
1,651
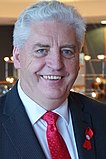
PUP
Dr. John Kyle 11.62%
1,150
1,237.92
1,239.92
1,239.92
1,259.18
1,273.60
1,308.14
1,325.40
1,454.40
DUP
Adam Newton *
10.27%
1,017
1,043.74
1,044.74
1,046.88
1,056.02
1,061.02
1,082.72
1,351.10
1,428.10
DUP
Gavin Robinson 11.60%
1,148
1,179.78
1,179.78
1,181.78
1,187.92
1,191.92
1,205.34
1,322.00
1,418.04
Sinn Féin
Niall Ó Donnghaile 11.68%
1,156
1,156.00
1,183.00
1,198.00
1,207.00
1,211.14
1,218.14
1,218.14
1,222.14
1,228.70
Alliance
David Armitage
7.88%
780
783.92
785.92
803.92
816.20
872.34
969.04
972.04
990.04
1,031.44
Alliance
Máire Hendron *
7.26%
719
721.66
726.66
761.66
772.80
821.94
890.08
892.08
903.08
929.62
TUV
Harry Toan
5.84%
578
606.56
607.56
607.56
610.98
615.98
624.52
634.52
793.78
UKIP
Jonny Lavery
5.49%
544
564.72
566.72
569.86
577.00
587.14
603.56
610.98
DUP
Sam White
4.20%
416
423.70
423.84
423.84
426.84
431.84
433.12
NI21
Jimmy Davidson
2.55%
252
257.88
257.88
261.88
271.16
311.30
Green (NI)
Gregor Claus
2.14%
212
213.26
215.26
221.26
242.40
Socialist Party
Tommy Black
1.09%
108
111.50
113.50
120.50
SDLP
Peter Devlin
1.00%
99
99.42
106.42
Workers' Party
Kevin McNally
0.71%
70
70.14
Electorate: 21,425 Valid: 9,900 (46.21%) Spoilt: 182 Quota: 1,415 Turnout: 10,082 (47.06%)
* Incumbent
Changes during the term [ ] † Co-options [ ]
Date co-opted
Electoral Area
Party
Outgoing
Co-optee
Reason
29 Oct 2014
Balmoral
Sinn Féin
Máirtín Ó Muilleoir
Geraldine McAteer
Ó Muilleoir was co-opted to the NI Assembly.
16 Jun 2015
Titanic
DUP
Gavin Robinson
Brian Kennedy
Robinson was elected to the House of Commons.
28 Jul 2015
Balmoral
SDLP
Claire Hanna
Donal Lyons
Hanna was co-opted to the NI Assembly.
1 Sep 2015
Ormiston
Alliance
Laura McNamee
Sian O'Neill
McNamee resigned.
14 Sep 2015
Collin
Sinn Féin
Bill Groves
Séanna Walsh
Groves resigned.
24 May 2016
Black Mountain
People Before Profit
Gerry Carroll
Matthew Collins
Carroll was elected to the NI Assembly.
26 May 2016
Titanic
Sinn Féin
Niall Ó Donnghaile
Mairéad O'Donnell
Ó Donnghaile was elected to the Seanad Éireann.
27 May 2016
Balmoral
DUP
Christopher Stalford
Lee Reynolds
Stalford was elected to the NI Assembly.
23 May 2016
Oldpark
SDLP
Nichola Mallon
Paul McCusker
Mallon was elected to the NI Assembly[7]
3 Jun 2016
Balmoral
Alliance
Paula Bradshaw
Kate Nicholl
Bradshaw was elected to the NI Assembly
26 Jun 2016
Ormiston
Alliance
Mervyn Jones
Peter McReynolds[8]
Jones died[9]
1 Nov 2016
Titanic
DUP
Brian Kennedy
George Dorrian
Kennedy resigned[10]
16 Nov 2016
Ormiston
Green (NI)
Ross Brown
Georgina Milne[11]
Brown resigned
19 Oct 2017
Black Mountain
Sinn Féin
Janice Austin
Orla Nic Biorna[12]
Austin resigned
6 Nov 2017
Collin
Sinn Féin
David Bell
Danny Baker[13]
Bell resigned
11 Jan 2018
Oldpark
Sinn Féin
Gerry McCabe
Ryan Murphy[14]
McCabe resigned.[15]
11 Jan 2018
Court
Sinn Féin
Jim McVeigh
Claire Canavan[16]
McVeigh resigned.[17]
27 Jan 2018
Oldpark
DUP
Gareth McKee
Dale Pankhurst[18]
McKee resigned.[19]
14 Dec 2018
Court
Sinn Féin
Mary McConville
Christina Black
McConville resigned[20]
‡ Changes in affiliation [ ]
Date
Electoral Area
Name
Previous affiliation
New affiliation
Circumstance
21 Nov 2015
Botanic
Ruth Patterson
DUP
Independent
Expelled.[21]
28 Oct 2016
Botanic
Graham Craig
UUP
DUP
Defected.[22]
28 Feb 2017
Court
Jolene Bunting
TUV
Independent
Resigned.[23]
19 Jun 2017
Botanic
Declan Boyle
SDLP
Independent
Resigned.[24]
19 Jun 2017
Castle
Patrick Convery
SDLP
Independent
Resigned.[24]
19 Jun 2017
Lisnasharragh
Kate Mullan
SDLP
Independent
Resigned.[24]
– Suspensions [ ] Ruth Patterson (Independent) was suspended from the council from 4 March 2019 to the end of her term in May.[25]
Last update 24 March 2019. [26]
Current composition: see Belfast City Council .
References [ ] show Council elections in
County Antrim Antrim and Newtownabbey Borough Council Belfast City Council Causeway Coast and Glens Borough Council Lisburn and Castlereagh District Council Mid and East Antrim District Council Antrim Borough Council
1973 1977 1981 1985 1989 1993 1997 2001 2005 2011 Abolished Ballymena Borough Council
1973 1977 1981 1985 1989 1993 1997 2001 2005 2011 Abolished Ballymoney Borough Council
1973 1977 1981 1985 1989 1993 1997 2001 2005 2011 Abolished Carrickfergus Borough Council
1973 1977 1981 1985 1989 1993 1997 2001 2005 2011 Abolished Larne Borough Council
1973 1977 1981 1985 1989 1993 1997 2001 2005 2011 Abolished Lisburn City Council
1973 1977 1981 1985 1989 1993 1997 2001 2005 2011 Abolished Moyle District Council
1973 1977 1981 1985 1989 1993 1997 2001 2005 2011 Abolished Newtownabbey Borough Council
1973 1977 1981 1985 1989 1993 1997 2001 2005 2011 Abolished Antrim County Council
show (
2013 ← )
2014 United Kingdom local elections (
→ 2015 )
London boroughs
Metropolitan boroughs Unitary authorities District councils District councils Mayoral elections PCC elections
See also European Parliament election