2015 Bath and North East Somerset Council election
| |||||||||||||||||||||||||||||||||||||||||||||||||||||||||||||||||||||||||||||||||||||
All 65 seats to Bath and North East Somerset Council 33 seats needed for a majority | |||||||||||||||||||||||||||||||||||||||||||||||||||||||||||||||||||||||||||||||||||||
|---|---|---|---|---|---|---|---|---|---|---|---|---|---|---|---|---|---|---|---|---|---|---|---|---|---|---|---|---|---|---|---|---|---|---|---|---|---|---|---|---|---|---|---|---|---|---|---|---|---|---|---|---|---|---|---|---|---|---|---|---|---|---|---|---|---|---|---|---|---|---|---|---|---|---|---|---|---|---|---|---|---|---|---|---|---|
| |||||||||||||||||||||||||||||||||||||||||||||||||||||||||||||||||||||||||||||||||||||
 Map showing the composition of Bath and North East Somerset Council following the election. Blue showing Conservative, Red showing Labour, Yellow showing Liberal Democrats, Grey showing Independents, Green showing Greens and Pale Green showing Village Voice. Striped wards have mixed representation. | |||||||||||||||||||||||||||||||||||||||||||||||||||||||||||||||||||||||||||||||||||||
| |||||||||||||||||||||||||||||||||||||||||||||||||||||||||||||||||||||||||||||||||||||
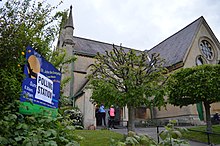
St John the Evangelist church being used as a polling station for Kingsmead ward
The 2015 Bath and North East Somerset Council election took place on 7 May 2015 to elect members of Bath and North East Somerset Council in England.[1][2] This coincided with other local elections and the 2015 general election.
Election results[]
| Bath and North East Somerset Council election, 2015[3] | |||||||||||||||
|---|---|---|---|---|---|---|---|---|---|---|---|---|---|---|---|
| Party | Candidates | Votes | |||||||||||||
| Stood | Elected | Gained | Unseated | Net | % of total | % | No. | Net % | |||||||
| Conservative | 65 | 37 | 11 | 3 | 56.9% | 37.5% | 63,614 | ||||||||
| Liberal Democrats | 65 | 15 | 2 | 16 | 23.1% | 25.0% | 42,472 | ||||||||
| Labour | 44 | 6 | 1 | 0 | 9.2% | 14.6% | 24,819 | ||||||||
| Independent | 20 | 3 | 1 | 0 | 4.6% | 5.6% | 9,519 | ||||||||
| Green | 43 | 2 | 2 | 0 | 3.1% | 13.3% | 22,506 | ||||||||
| Village Voice | 2 | 2 | 2 | 0 | 3.1% | 1.2% | 2,001 | N/A | |||||||
| UKIP | 12 | 0 | 0 | 0 | 0% | 2.8% | 4,719 | ||||||||
| Left Unity | 2 | 0 | 0 | 0 | 0% | 0.0% | 53 | N/A | |||||||
Ward results[]
The ward results listed below are based on the changes from the 2011 elections, not taking into account any party defections or by-elections. Sitting councillors are marked with an asterisk (*).
Abbey[]
| Party | Candidate | Votes | % | ±% | |
|---|---|---|---|---|---|
| Conservative | Peter Turner | 1,158 | 30.4 | –1.5 | |
| Green | Jonathan Carr | 1,071 | 28.1 | +8.7 | |
| Conservative | Brian Webber * | 985 | – | ||
| Liberal Democrats | Louise Bray | 798 | 20.9 | –13.5 | |
| Liberal Democrats | Manda Rigby * | 741 | – | ||
| Labour | Laurel Casserley | 639 | 16.8 | +2.4 | |
| Independent | Jenny Knight | 148 | 3.9 | N/A | |
| Turnout | |||||
| Registered electors | |||||
| Conservative hold | Swing | ||||
| Green gain from Liberal Democrats | Swing | ||||
Bathavon North[]
| Party | Candidate | Votes | % | ±% | |
|---|---|---|---|---|---|
| Conservative | Martin Veal * | 1,971 | 37.4 | +0.2 | |
| Conservative | Geoff Ward * | 1,745 | – | ||
| Liberal Democrats | Alison Millar | 1,544 | 29.3 | –3.1 | |
| Conservative | Ian Cooper | 1,501 | – | ||
| Liberal Democrats | Vito Pecchia | 1,305 | – | ||
| Liberal Democrats | Dorian Baker | 1,286 | – | ||
| Green | Justin Temblett-Wood | 786 | 15.0 | – | |
| Labour | Hendrik Bebber | 673 | 12.8 | –2.7 | |
| Labour | Andrew Pottage | 406 | – | ||
| Labour | Alex Jovcic-Sas | 394 | – | ||
| UKIP | Dan Evans | 288 | 5.5 | N/A | |
| Turnout | |||||
| Registered electors | |||||
| Conservative hold | Swing | ||||
| Conservative hold | Swing | ||||
| Liberal Democrats gain from Conservative | Swing | ||||
Bathavon South[]
| Party | Candidate | Votes | % | ±% | |
|---|---|---|---|---|---|
| Liberal Democrats | Neil Butters * | 860 | 47.6 | –1.7 | |
| Conservative | Johnny Kidney | 644 | 35.7 | +1.0 | |
| Green | Hugh Prentice | 177 | 9.8 | +2.2 | |
| Labour | Jordan Ness | 125 | 6.9 | –1.5 | |
| Majority | 216 | 12.0 | |||
| Turnout | 1,806 | ||||
| Registered electors | |||||
| Liberal Democrats hold | Swing | ||||
Bathavon West[]
| Party | Candidate | Votes | % | ±% | |
|---|---|---|---|---|---|
| Conservative | David Veale * | 712 | 46.3 | –6.7 | |
| Liberal Democrats | William Hobhouse | 388 | 25.2 | –21.8 | |
| Green | George Oram | 328 | 21.3 | N/A | |
| Independent | Marilyn Deacon | 110 | 7.2 | N/A | |
| Majority | 324 | 21.1 | |||
| Turnout | 1,538 | ||||
| Registered electors | |||||
| Conservative hold | Swing | ||||
Bathwick[]
| Party | Candidate | Votes | % | ±% | |
|---|---|---|---|---|---|
| Conservative | Matt Cochrane | 1,121 | 38.8 | +5.3 | |
| Conservative | Steve Jeffries | 966 | – | ||
| Liberal Democrats | Claire Jackson | 826 | 28.6 | –18.4 | |
| Liberal Democrats | David Martin * | 797 | – | ||
| Green | Matt Benka | 584 | 20.2 | +10.4 | |
| Labour | Saiful Islam | 357 | 12.4 | +2.7 | |
| Labour | Samuel Marlow-Stevens | 287 | – | ||
| Turnout | |||||
| Registered electors | |||||
| Conservative gain from Liberal Democrats | Swing | ||||
| Conservative gain from Liberal Democrats | Swing | ||||
Chew Valley North[]
| Party | Candidate | Votes | % | ±% | |
|---|---|---|---|---|---|
| Conservative | Liz Richardson * | 969 | 62.2 | –11.6 | |
| Liberal Democrats | Charles Fenn | 305 | 19.6 | +6.2 | |
| Green | Laurence Guy | 284 | 18.2 | N/A | |
| Majority | 664 | 42.6 | |||
| Turnout | 1,558 | ||||
| Registered electors | |||||
| Conservative hold | Swing | ||||
Chew Valley South[]
| Party | Candidate | Votes | % | ±% | |
|---|---|---|---|---|---|
| Conservative | Vic Pritchard * | 1,071 | 67.2 | +15.0 | |
| Green | Sally Calverley | 321 | 20.1 | N/A | |
| Liberal Democrats | Gitte Dawson | 202 | 12.7 | –5.1 | |
| Majority | 750 | 47.1 | |||
| Turnout | 1,594 | ||||
| Registered electors | |||||
| Conservative hold | Swing | ||||
Clutton[]
| Party | Candidate | Votes | % | ±% | |
|---|---|---|---|---|---|
| Conservative | Karen Warrington | 736 | 46.3 | –1.1 | |
| Liberal Democrats | Jeremy Sparks * | 540 | 34.0 | –18.6 | |
| Labour | Neil Dowman | 183 | 11.5 | N/A | |
| Green | Michael Edwards | 131 | 8.2 | N/A | |
| Majority | 196 | 12.3 | |||
| Turnout | 1,590 | ||||
| Registered electors | |||||
| Conservative gain from Liberal Democrats | Swing | ||||
Combe Down[]
| Party | Candidate | Votes | % | ±% | |
|---|---|---|---|---|---|
| Liberal Democrats | Cherry Beath * | 1,247 | 34.3 | –11.9 | |
| Conservative | Bob Goodman | 1,006 | 27.7 | +2.8 | |
| Conservative | David Beaugeard | 964 | – | ||
| Liberal Democrats | Joel Hirst | 743 | – | ||
| Green | Rosie Jones | 729 | 20.1 | +6.2 | |
| Labour | Sanjeev Chaddha | 396 | 10.9 | –1.5 | |
| UKIP | Michael Stanley | 256 | 7.0 | N/A | |
| Turnout | |||||
| Registered electors | |||||
| Liberal Democrats hold | Swing | ||||
| Conservative gain from Liberal Democrats | Swing | ||||
Farmborough[]
| Party | Candidate | Votes | % | ±% | |
|---|---|---|---|---|---|
| Conservative | Sally Davis * | 1,191 | 74.4 | +2.6 | |
| Liberal Democrats | Nicole Sykes | 409 | 25.6 | +6.6 | |
| Majority | 782 | 48.9 | |||
| Turnout | 1,600 | ||||
| Registered electors | |||||
| Conservative hold | Swing | ||||
High Littleton[]
| Party | Candidate | Votes | % | ±% | |
|---|---|---|---|---|---|
| Conservative | Les Kew * | 1,102 | 63.2 | +1.5 | |
| Green | Sarah Huggins | 358 | 20.5 | N/A | |
| Liberal Democrats | Andy Stewart | 284 | 16.3 | +3.6 | |
| Majority | 744 | 42.7 | |||
| Turnout | 1,744 | ||||
| Registered electors | |||||
| Conservative hold | Swing | ||||
Keynsham East[]
| Party | Candidate | Votes | % | ±% | |
|---|---|---|---|---|---|
| Conservative | Marie Longstaff * | 1,858 | 49.6 | –2.9 | |
| Conservative | Bryan Organ * | 1,802 | – | ||
| Liberal Democrats | Andy Wait | 854 | 22.8 | –2.1 | |
| Liberal Democrats | Keith Kirwan | 583 | – | ||
| Labour | Keith Burchell | 555 | 14.8 | –7.8 | |
| Labour | Jonathan Wallcroft | 543 | – | ||
| Green | Sam Willitts | 477 | 12.7 | N/A | |
| Turnout | |||||
| Registered electors | |||||
| Conservative hold | Swing | ||||
| Conservative hold | Swing | ||||
Keynsham North[]
| Party | Candidate | Votes | % | ±% | |
|---|---|---|---|---|---|
| Conservative | Charles Gerrish * | 1,443 | 46.8 | –10.1 | |
| Conservative | Brian Simmons * | 1,203 | – | ||
| Labour | Christopher Davis | 609 | 19.8 | –6.6 | |
| Labour | Elizabeth King | 570 | – | ||
| UKIP | Steve Grimes | 437 | 14.2 | N/A | |
| Green | Justin Edwards | 423 | 13.7 | N/A | |
| Liberal Democrats | Joshua Little | 171 | 5.5 | –11.2 | |
| Liberal Democrats | Thomas Pirie | 108 | – | ||
| Turnout | |||||
| Registered electors | |||||
| Conservative hold | Swing | ||||
| Conservative hold | Swing | ||||
Keynsham South[]
| Party | Candidate | Votes | % | ±% | |
|---|---|---|---|---|---|
| Conservative | Alan Hale * | 1,213 | 40.3 | –4.5 | |
| Conservative | Lisa O'Brien | 913 | – | ||
| Labour | Tony Crouch | 827 | 27.5 | –5.1 | |
| Labour | Fflyff McLaren | 483 | – | ||
| UKIP | Philip Evans | 444 | 14.7 | N/A | |
| Liberal Democrats | Karen Godfrey | 284 | 9.4 | –13.2 | |
| Green | Matt Orton | 244 | 8.1 | N/A | |
| Liberal Democrats | Linda Hawes | 184 | – | ||
| Turnout | |||||
| Registered electors | |||||
| Conservative hold | Swing | ||||
| Conservative hold | Swing | ||||
Kingsmead[]
| Party | Candidate | Votes | % | ±% | |
|---|---|---|---|---|---|
| Liberal Democrats | Andrew Furse * | 967 | 31.2 | –8.8 | |
| Conservative | Chris Pearce | 872 | 28.1 | +7.8 | |
| Green | Eric Lucas | 696 | 22.4 | +2.6 | |
| Conservative | Benedict Spencer | 680 | – | ||
| Green | Dick Daniel | 625 | – | ||
| Liberal Democrats | Douglas Nicol * | 624 | – | ||
| Labour | Pam Richards | 404 | 13.0 | –2.9 | |
| UKIP | Andrew Bosanquet | 163 | 5.3 | +1.2 | |
| Turnout | |||||
| Registered electors | |||||
| Liberal Democrats hold | Swing | ||||
| Conservative gain from Liberal Democrats | Swing | ||||
Lambridge[]
| Party | Candidate | Votes | % | ±% | |
|---|---|---|---|---|---|
| Green | Lin Patterson | 984 | 25.3 | +3.2 | |
| Liberal Democrats | Rob Appleyard * | 900 | 23.2 | +0.2 | |
| Conservative | Ian Cowie | 874 | 22.5 | –9.9 | |
| Liberal Democrats | Y Kumar | 619 | – | ||
| Independent | Dave Laming * | 597 | 15.4 | N/A | |
| Conservative | Tor Soltvedt | 541 | – | ||
| Independent | Bryan Chalker * | 539 | – | N/A | |
| Labour | Vicky Drew | 531 | 13.7 | –9.3 | |
| Labour | Ron Laden | 351 | – | ||
| Turnout | |||||
| Registered electors | |||||
| Green gain from Conservative | Swing | ||||
| Liberal Democrats gain from Conservative | Swing | ||||
Lansdown[]
| Party | Candidate | Votes | % | ±% | |
|---|---|---|---|---|---|
| Conservative | Patrick Anketell-Jones * | 1,366 | 49.2 | +1.2 | |
| Conservative | Tony Clarke * | 1,185 | – | ||
| Green | Sally Harris | 594 | 21.4 | +3.6 | |
| Green | Eleanor Field | 537 | – | ||
| Liberal Democrats | Felicity Gibson-Watt | 504 | 18.1 | +0.3 | |
| Liberal Democrats | Dylan Hughes | 425 | – | ||
| Labour | Hilary Fraser | 313 | 11.3 | –2.3 | |
| Turnout | |||||
| Registered electors | |||||
| Conservative hold | Swing | ||||
| Conservative hold | Swing | ||||
Lyncombe[]
| Party | Candidate | Votes | % | ±% | |
|---|---|---|---|---|---|
| Conservative | Mark Shelford | 1,165 | 30.7 | +3.5 | |
| Conservative | Michael Norton | 1,096 | – | ||
| Liberal Democrats | Katie Hall * | 1,069 | 28.2 | –15.6 | |
| Green | Tony Ambrose | 930 | 24.5 | +7.9 | |
| Liberal Democrats | Jay Risbridger | 922 | – | ||
| Green | Don Grimes | 766 | – | ||
| Labour | Nicky Stubbs | 384 | 10.1 | –2.3 | |
| UKIP | Hugo Jenks | 246 | 6.5 | N/A | |
| Turnout | |||||
| Registered electors | |||||
| Conservative gain from Liberal Democrats | Swing | ||||
| Conservative gain from Liberal Democrats | Swing | ||||
Mendip[]
| Party | Candidate | Votes | % | ±% | |
|---|---|---|---|---|---|
| Conservative | Tim Warren * | 1,034 | 63.8 | +6.1 | |
| Green | Mike Jay | 344 | 21.2 | +8.4 | |
| Liberal Democrats | Benjamin Goldstrom | 242 | 14.9 | +3.6 | |
| Majority | 690 | 42.6 | |||
| Turnout | 1,620 | ||||
| Registered electors | |||||
| Conservative hold | Swing | ||||
Midsomer Norton North[]
| Party | Candidate | Votes | % | ±% | |
|---|---|---|---|---|---|
| Conservative | Michael Evans * | 1,494 | 45.6 | –2.0 | |
| Conservative | Barry Macrae * | 1,385 | – | ||
| Labour | Martine Duggan | 944 | 28.8 | –7.6 | |
| Labour | Ryan Maher | 769 | – | ||
| Green | Joshua Palmer | 425 | 13.0 | N/A | |
| Liberal Democrats | Diane Bodle | 262 | 8.0 | –8.0 | |
| Liberal Democrats | James Clarke | 200 | – | ||
| Independent | Mandy Clarke | 153 | 4.7 | N/A | |
| Independent | Tex Clarke | 106 | – | ||
| Turnout | |||||
| Registered electors | |||||
| Conservative hold | Swing | ||||
| Conservative hold | Swing | ||||
Midsomer Norton Redfield[]
| Party | Candidate | Votes | % | ±% | |
|---|---|---|---|---|---|
| Conservative | Paul Myers * | 1,633 | 47.7 | –7.3 | |
| Conservative | Chris Watt * | 1,410 | – | ||
| Labour | Liz Derl-Davis | 888 | 25.9 | –9.5 | |
| Green | Vicki Gait | 593 | 17.3 | N/A | |
| Liberal Democrats | Michael Jakins | 311 | 9.1 | –0.5 | |
| Liberal Democrats | Alan Feest | 229 | – | ||
| Turnout | |||||
| Registered electors | |||||
| Conservative hold | Swing | ||||
| Conservative hold | Swing | ||||
Newbridge[]
| Party | Candidate | Votes | % | ±% | |
|---|---|---|---|---|---|
| Conservative | Donal Hassett | 1,099 | 27.2 | +1.7 | |
| Liberal Democrats | Caroline Roberts * | 1,008 | 25.0 | –18.7 | |
| Conservative | Guy Palmer | 960 | – | ||
| Liberal Democrats | Michelle O'Doherty | 914 | – | ||
| Green | Antony Dobson | 766 | 19.0 | +6.2 | |
| Independent | Loraine Morgan-Brinkhurst * | 603 | 14.9 | N/A | |
| Labour | Michelle Young | 564 | 14.0 | –4.0 | |
| Turnout | |||||
| Registered electors | |||||
| Conservative gain from Liberal Democrats | Swing | ||||
| Liberal Democrats hold | Swing | ||||
Odd Down[]
| Party | Candidate | Votes | % | ±% | |
|---|---|---|---|---|---|
| Liberal Democrats | Steve Hedges * | 1,269 | 37.6 | –10.4 | |
| Liberal Democrats | Nigel Roberts * | 885 | – | ||
| Conservative | Joel Harper | 711 | 21.1 | +3.3 | |
| Conservative | Lance Payton | 589 | – | ||
| Green | Karen Robinson | 532 | 15.8 | –0.4 | |
| Labour | Liz Vincent | 480 | 14.2 | –3.8 | |
| Green | Marie-Louise Jensen | 421 | – | ||
| UKIP | Joska Vincent | 380 | 11.3 | N/A | |
| Turnout | |||||
| Registered electors | |||||
| Liberal Democrats hold | Swing | ||||
| Liberal Democrats hold | Swing | ||||
Oldfield[]
| Party | Candidate | Votes | % | ±% | |
|---|---|---|---|---|---|
| Liberal Democrats | Will Sandry * | 1,091 | 33.7 | –9.7 | |
| Liberal Democrats | Shaun McGall | 930 | – | ||
| Green | Jamie Smith | 810 | 25.0 | +6.5 | |
| Conservative | Chris Goodenough | 769 | 23.7 | +6.6 | |
| Conservative | Thomas Hobson | 677 | – | ||
| Labour | Rachel Willis | 568 | 17.5 | –3.6 | |
| Labour | Peter Marsh | 491 | – | ||
| Turnout | |||||
| Registered electors | |||||
| Liberal Democrats hold | Swing | ||||
| Liberal Democrats hold | Swing | ||||
Paulton[]
| Party | Candidate | Votes | % | ±% | |
|---|---|---|---|---|---|
| Labour | Liz Hardman * | 1,170 | 32.0 | –13.3 | |
| Labour | John Bull * | 861 | – | ||
| Conservative | Mike Colliver | 844 | 23.1 | –12.4 | |
| Independent | Paul Bailes | 673 | 18.4 | N/A | |
| UKIP | Jeff Humphries | 589 | 16.1 | N/A | |
| Conservative | Kate Simmons * | 530 | – | ||
| Green | Rory Lee | 235 | 6.4 | N/A | |
| Liberal Democrats | Charlotte Lightowler | 140 | 3.8 | –15.4 | |
| Liberal Democrats | Stephen Dawson | 110 | – | ||
| Turnout | |||||
| Registered electors | |||||
| Labour hold | Swing | ||||
| Labour hold | Swing | ||||
Peasedown[]
| Party | Candidate | Votes | % | ±% | |
|---|---|---|---|---|---|
| Village Voice | Sarah Bevan * | 1,095 | 27.0 | N/A | |
| Village Voice | Karen Walker | 906 | – | N/A | |
| Conservative | Jo Davis | 880 | 21.7 | +9.3 | |
| Labour | Jonathan Rich | 879 | 21.7 | +5.0 | |
| Conservative | Stephen Goodwin | 668 | – | ||
| Labour | Lesley Mansell | 634 | – | ||
| Liberal Democrats | Wera Hobhouse | 463 | 11.4 | –42.8 | |
| Independent | Kathy Thomas | 453 | 11.2 | N/A | |
| Liberal Democrats | Ray Love | 304 | – | ||
| Green | Louis Williams | 283 | 7.0 | N/A | |
| Turnout | |||||
| Registered electors | |||||
| Village Voice gain from Liberal Democrats | Swing | ||||
| Village Voice gain from Liberal Democrats | Swing | ||||
Publow and Whitchurch[]
| Party | Candidate | Votes | % | ±% | |
|---|---|---|---|---|---|
| Conservative | Paul May | 979 | 66.4 | –5.7 | |
| Green | Christine Brown | 285 | 19.3 | N/A | |
| Liberal Democrats | Dick Beath | 210 | 14.2 | +6.9 | |
| Majority | 694 | 47.1 | |||
| Turnout | 1,474 | ||||
| Registered electors | |||||
| Conservative hold | Swing | ||||
Radstock[]
| Party | Candidate | Votes | % | ±% | |
|---|---|---|---|---|---|
| Labour | Chris Dando | 865 | 30.0 | –9.3 | |
| Conservative | Deirdre Horstmann | 643 | 22.3 | +5.8 | |
| Conservative | Tony Heaford | 637 | – | ||
| Labour | Anne Jovcic-Sas | 634 | – | ||
| Liberal Democrats | Nettie Williams | 593 | 20.6 | –23.6 | |
| Liberal Democrats | Bruce Shearn | 558 | – | ||
| Green | Terry Pitt | 402 | 13.9 | N/A | |
| Independent | Gael Doswell | 380 | 13.2 | N/A | |
| Independent | Rob Langley | 327 | – | ||
| Turnout | |||||
| Registered electors | |||||
| Labour hold | Swing | ||||
| Conservative gain from Liberal Democrats | Swing | ||||
Saltford[]
| Party | Candidate | Votes | % | ±% | |
|---|---|---|---|---|---|
| Conservative | Francine Haeberling * | 1,262 | 40.0 | –4.5 | |
| Conservative | Emma Dixon | 1,222 | – | ||
| Liberal Democrats | Duncan Hounsell | 850 | 26.9 | +13.9 | |
| Liberal Democrats | Farida Wilson | 514 | – | ||
| Green | Liz Barling | 358 | 11.3 | N/A | |
| UKIP | Tim House | 355 | 11.2 | N/A | |
| Labour | Nik Sas | 332 | 10.5 | –3.5 | |
| Turnout | |||||
| Registered electors | |||||
| Conservative hold | Swing | ||||
| Conservative hold | Swing | ||||
Southdown[]
| Party | Candidate | Votes | % | ±% | |
|---|---|---|---|---|---|
| Liberal Democrats | Paul Crossley * | 1,230 | 36.0 | –9.3 | |
| Liberal Democrats | Dine Romero * | 1,003 | – | ||
| Conservative | Peter Goodhart | 797 | 23.3 | +6.3 | |
| Conservative | Scarlett Windmill-Last | 477 | – | ||
| UKIP | Julian Deverell | 471 | 13.8 | N/A | |
| Labour | Stephen Bendle | 428 | 12.5 | –8.6 | |
| Green | Ross Baxter | 407 | 11.9 | –4.7 | |
| Green | Grant Davis | 376 | – | ||
| Independent | Bethany Tavener | 55 | 1.6 | N/A | |
| Left Unity | Karen Weston | 27 | 0.8 | N/A | |
| Left Unity | Stewart Weston | 26 | – | ||
| Turnout | |||||
| Registered electors | |||||
| Liberal Democrats hold | Swing | ||||
| Liberal Democrats hold | Swing | ||||
Timsbury[]
| Party | Candidate | Votes | % | ±% | |
|---|---|---|---|---|---|
| Independent | Douglas Deacon * | 736 | 45.9 | –23.0 | |
| Conservative | Carole Fitzpatrick | 359 | 22.4 | +10.4 | |
| Labour | Peter Sas | 200 | 12.5 | –3.0 | |
| Liberal Democrats | Daniel Hilton | 174 | 10.9 | +7.0 | |
| Green | Sara Strawson | 134 | 8.4 | N/A | |
| Majority | 377 | 23.5 | |||
| Turnout | 1,603 | ||||
| Registered electors | |||||
| Independent hold | Swing | ||||
Twerton[]
| Party | Candidate | Votes | % | ±% | |
|---|---|---|---|---|---|
| Liberal Democrats | Tim Ball * | 881 | 33.6 | –20.7 | |
| Labour | Joe Rayment | 567 | 21.6 | +3.4 | |
| Liberal Democrats | Gerry Curran * | 546 | – | ||
| Green | Lee Giles | 484 | 18.5 | +7.7 | |
| Conservative | James Hopkins | 350 | 13.3 | –3.5 | |
| UKIP | Henry Marshall | 341 | 13.0 | N/A | |
| Conservative | Matteo Weeks | 239 | – | ||
| Turnout | |||||
| Registered electors | |||||
| Liberal Democrats hold | Swing | ||||
| Labour gain from Liberal Democrats | Swing | ||||
Walcot[]
| Party | Candidate | Votes | % | ±% | |
|---|---|---|---|---|---|
| Liberal Democrats | Lisa Brett * | 1,323 | 37.4 | –1.3 | |
| Conservative | Fiona Darey | 795 | 22.5 | +7.0 | |
| Green | Michael Tichelar | 772 | 21.8 | –3.7 | |
| Liberal Democrats | Tom Williams | 768 | – | ||
| Green | Vipul Patel | 765 | – | ||
| Conservative | Christopher Slack | 695 | – | ||
| Labour | Ben Draper | 516 | 14.6 | –5.7 | |
| Labour | Tom Carter | 492 | – | ||
| Independent | Susan Traill | 132 | 3.7 | N/A | |
| Turnout | |||||
| Registered electors | |||||
| Liberal Democrats hold | Swing | ||||
| Conservative gain from Liberal Democrats | Swing | ||||
Westfield[]
| Party | Candidate | Votes | % | ±% | |
|---|---|---|---|---|---|
| Labour | Eleanor Jackson * | 1,100 | 28.5 | –22.6 | |
| Labour | Robin Moss * | 997 | – | ||
| UKIP | Ernie Blaber | 749 | 19.4 | N/A | |
| Independent | Geoff Fuller | 738 | 19.1 | N/A | |
| Conservative | Margaret Brewer | 712 | 18.4 | +3.1 | |
| Conservative | Peter Edwards | 594 | – | ||
| Green | Darren Rogers | 284 | 7.3 | N/A | |
| Liberal Democrats | Michelle Drew | 281 | 7.3 | +0.8 | |
| Liberal Democrats | Katie Mallia | 133 | – | ||
| Turnout | |||||
| Registered electors | |||||
| Labour hold | Swing | ||||
| Labour hold | Swing | ||||
Westmoreland[]
| Party | Candidate | Votes | % | ±% | |
|---|---|---|---|---|---|
| Independent | June Player * | 1,577 | 36.4 | +7.5 | |
| Independent | Colin Blackburn | 947 | 21.9 | N/A | |
| Green | Jon Lucas | 935 | 21.6 | +3.8 | |
| Liberal Democrats | Sharon Ball * | 718 | 16.6 | –11.5 | |
| Labour | Rebecca Shields | 590 | 13.6 | –1.0 | |
| Conservative | Christopher Laycock | 508 | 11.7 | –1.1 | |
| Conservative | Steve Thomas | 471 | – | ||
| Liberal Democrats | Sarah Moore | 436 | – | ||
| Turnout | |||||
| Registered electors | |||||
| Independent hold | Swing | ||||
| Independent gain from Liberal Democrats | Swing | ||||
Weston[]
| Party | Candidate | Votes | % | ±% | |
|---|---|---|---|---|---|
| Conservative | Colin Barrett * | 1,289 | 33.1 | –14.1 | |
| Conservative | Matthew Davies | 952 | – | ||
| Independent | Malcolm Lees * | 811 | 20.8 | N/A | |
| Liberal Democrats | Ruth Malloy | 737 | 18.9 | –1.9 | |
| Green | Lisa Loveridge | 627 | 16.1 | +0.8 | |
| Liberal Democrats | Matthew White | 548 | – | ||
| Labour | Steve Richards | 433 | 11.1 | –5.6 | |
| Independent | Josh Hawker | 351 | – | ||
| Turnout | |||||
| Registered electors | |||||
| Conservative hold | Swing | ||||
| Conservative hold | Swing | ||||
Widcombe[]
| Party | Candidate | Votes | % | ±% | |
|---|---|---|---|---|---|
| Liberal Democrats | Ian Gilchrist * | 1,067 | 32.1 | –12.0 | |
| Conservative | Jasper Becker | 1,030 | 31.0 | –6.6 | |
| Conservative | Brook Whelan | 863 | – | ||
| Liberal Democrats | Ben Stevens * | 811 | – | ||
| Green | Sally Driver | 699 | 21.1 | +2.8 | |
| Green | Thelma Grimes | 524 | – | ||
| Labour | Bernard Morgan | 387 | 11.7 | –1.5 | |
| Independent | Casey Nolan | 137 | 4.1 | N/A | |
| Independent | Joy Goldsmith | 78 | – | ||
| Turnout | |||||
| Registered electors | |||||
| Liberal Democrats hold | Swing | ||||
| Conservative gain from Liberal Democrats | Swing | ||||
By-elections between 2015 and 2019[]
Abbey[]
| Party | Candidate | Votes | % | ±% | |
|---|---|---|---|---|---|
| Conservative | Lizzie Gladwyn | 350 | 32.8 | –2.4 | |
| Liberal Democrats | Gerry Curran | 273 | 25.6 | +4.7 | |
| Green | Vipul Arvind Patel | 252 | 23.6 | –4.5 | |
| Labour | Vicky Linda Drew | 126 | 11.8 | –5.0 | |
| Independent | Jenny Knight | 43 | 4.0 | +0.1 | |
| UKIP | Marc Ross Hooper | 23 | 2.2 | N/A | |
| Majority | 77 | 7.2 | |||
| Turnout | 1,067 | ||||
| Conservative gain from Green | Swing | ||||
Walcot[]
| Party | Candidate | Votes | % | ±% | |
|---|---|---|---|---|---|
| Liberal Democrats | Richard Emlyn Samuel | 750 | 48.6 | +11.2 | |
| Green | Tim Stoneman | 343 | 22.2 | +0.4 | |
| Conservative | Brian Webber | 339 | 22.0 | –0.5 | |
| Labour | Amber Evelyn Weston | 111 | 7.2 | –7.4 | |
| Majority | 407 | 26.4 | |||
| Turnout | 1,548 | ||||
| Liberal Democrats hold | Swing | ||||
Newbridge[]
| Party | Candidate | Votes | % | ±% | |
|---|---|---|---|---|---|
| Liberal Democrats | Michelle Anne O'Doherty | 828 | 36.8 | +11.8 | |
| Conservative | Rob Hawking | 783 | 34.8 | +7.6 | |
| Independent | Lorraine Morgan-Brinkhurst | 242 | 10.1 | –4.8 | |
| Green | Richard Daniel | 209 | 9.3 | –9.7 | |
| Labour | Pam Richards | 174 | 7.7 | –6.3 | |
| Majority | 45 | 2.0 | |||
| Turnout | 2,236 | ||||
| Liberal Democrats gain from Conservative | Swing | ||||
Kingsmead[]
| Party | Candidate | Votes | % | ±% | |
|---|---|---|---|---|---|
| Liberal Democrats | Susan Geraldine Craig | 545 | 41.1 | +10.0 | |
| Labour | Sharon Louise Gillings | 326 | 24.6 | +11.6 | |
| Conservative | Thomas Peter Hobson | 282 | 21.3 | –6.8 | |
| Green | Eric Paul Lucas | 172 | 13.0 | –9.5 | |
| Majority | 219 | 16.5 | |||
| Turnout | 1,325 | ||||
| Liberal Democrats gain from Conservative | Swing | ||||
References[]
- ^ "Upcoming elections & referendums". The Electoral Commission. Archived from the original on 15 March 2015. Retrieved 26 March 2015.
- ^ "Statement of Persons Nominated and Notice of Poll" (PDF). Bath and North East Somerset Returning Officer. 10 April 2015. Retrieved 12 April 2015.
- ^ "Local Elections Archive Project - 2015 - Bath and North East Somerset". www.andrewteale.me.uk. Retrieved 19 March 2019.
- ^ "Abbey Ward". Bath and North East Somerset Council. Retrieved 10 May 2015.
- ^ "Bathavon North". Bath and North East Somerset Council. Retrieved 10 May 2015.
- ^ "Bathavon South". Bath and North East Somerset Council. Retrieved 10 May 2015.
- ^ "Bathavon West". Bath and North East Somerset Council. Retrieved 10 May 2015.
- ^ "Bathwick". Bath and North East Somerset Council. Retrieved 10 May 2015.
- ^ "Chew Valley North". Bath and North East Somerset Council. Retrieved 10 May 2015.
- ^ "Chew Valley South". Bath and North East Somerset Council. Retrieved 10 May 2015.
- ^ "Clutton". Bath and North East Somerset Council. Retrieved 10 May 2015.
- ^ "Combe Down". Bath and North East Somerset Council. Retrieved 10 May 2015.
- ^ "Farmborough". Bath and North East Somerset Council. Retrieved 10 May 2015.
- ^ "High Littleton". Bath and North East Somerset Council. Retrieved 10 May 2015.
- ^ "Keynsham East". Bath and North East Somerset Council. Retrieved 10 May 2015.
- ^ "Keynsham North". Bath and North East Somerset Council. Retrieved 10 May 2015.
- ^ "Keynsham South". Bath and North East Somerset Council. Retrieved 10 May 2015.
- ^ "Kingsmead". Bath and North East Somerset Council. Retrieved 10 May 2015.
- ^ "Lambridge". Bath and North East Somerset Council. Retrieved 10 May 2015.
- ^ "Lansdown". Bath and North East Somerset Council. Retrieved 10 May 2015.
- ^ "Lyncombe". Bath and North East Somerset Council. Retrieved 10 May 2015.
- ^ "Mendip". Bath and North East Somerset Council. Retrieved 10 May 2015.
- ^ "Midsomer Norton North". Bath and North East Somerset Council. Retrieved 10 May 2015.
- ^ "Midsomer Norton Redfield". Bath and North East Somerset Council. Retrieved 10 May 2015.
- ^ "Newbridge". Bath and North East Somerset Council. Retrieved 10 May 2015.
- ^ "Odd Down". Bath and North East Somerset Council. Retrieved 10 May 2015.
- ^ "Oldfield". Bath and North East Somerset Council. Retrieved 10 May 2015.
- ^ "Paulton". Bath and North East Somerset Council. Retrieved 10 May 2015.
- ^ "Peasedown". Bath and North East Somerset Council. Retrieved 10 May 2015.
- ^ "Publow and Whitchurch". Bath and North East Somerset Council. Retrieved 10 May 2015.
- ^ "Radstock". Bath and North East Somerset Council. Retrieved 10 May 2015.
- ^ "Saltford". Bath and North East Somerset Council. Retrieved 10 May 2015.
- ^ "Southdown". Bath and North East Somerset Council. Retrieved 10 May 2015.
- ^ "Timsbury". Bath and North East Somerset Council. Retrieved 10 May 2015.
- ^ "Twerton". Bath and North East Somerset Council. Retrieved 10 May 2015.
- ^ "Walcot". Bath and North East Somerset Council. Retrieved 10 May 2015.
- ^ "Westfield". Bath and North East Somerset Council. Retrieved 10 May 2015.
- ^ "Westmoreland". Bath and North East Somerset Council. Retrieved 10 May 2015.
- ^ "Weston". Bath and North East Somerset Council. Retrieved 10 May 2015.
- ^ "Widcombe". Bath and North East Somerset Council. Retrieved 10 May 2015.
- ^ "Election results for Abbey". Bath and North East Somerset Council. Retrieved 15 March 2020.
- ^ "Election results for Walcot". Bath and North East Somerset Council. Retrieved 15 March 2020.
- ^ "Election results for Newbridge". Bath and North East Somerset Council. Retrieved 15 March 2020.
- ^ "Election results for Kingsmead". Bath and North East Somerset Council. Retrieved 15 March 2020.
| Somerset County Council | |
|---|---|
| Bath and North East Somerset Council |
|
| Mendip District Council |
|
| North Somerset Council |
|
| Sedgemoor District Council | |
| South Somerset District Council | |
| Somerset West and Taunton District Council |
|
| Avon County Council |
|
| Bath City Council | |
| Taunton Deane Borough Council |
|
| Wansdyke District Council |
|
| West Somerset District Council | |
| West of England Mayor |
|
| |
Categories:
- 2015 English local elections
- May 2015 events in the United Kingdom
- Bath and North East Somerset Council elections
- 2010s in Somerset