1991 Wansdyke District Council election
| |||||||||||||||||||||||||||||||||||||||||||||||||||||
All 47 seats to Wansdyke District Council 24 seats needed for a majority | |||||||||||||||||||||||||||||||||||||||||||||||||||||
|---|---|---|---|---|---|---|---|---|---|---|---|---|---|---|---|---|---|---|---|---|---|---|---|---|---|---|---|---|---|---|---|---|---|---|---|---|---|---|---|---|---|---|---|---|---|---|---|---|---|---|---|---|---|
| |||||||||||||||||||||||||||||||||||||||||||||||||||||
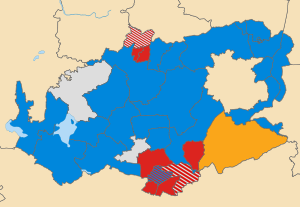 Map showing the composition of Wansdyke District Council following the election. Blue showing Conservative, Red showing Labour, Yellow showing Liberal Democrats and Grey showing Independents. Striped wards have mixed representation. | |||||||||||||||||||||||||||||||||||||||||||||||||||||
| |||||||||||||||||||||||||||||||||||||||||||||||||||||
The 1991 Wansdyke Council election was held on Thursday 2 May 1991 to elect councillors to Wansdyke District Council in England. It took place on the same day as other district council elections in the United Kingdom.
These were the final elections of the district council, before its abolition on 1 April 1996 when it was merged with Bath City Council to form Bath and North East Somerset Council.
The 1991 election saw the Conservatives win the largest number of seats but lose their overall majority.
Election results[]
| Wansdyke District Council election, 1991 | |||||||||||||||
|---|---|---|---|---|---|---|---|---|---|---|---|---|---|---|---|
| Party | Candidates | Votes | |||||||||||||
| Stood | Elected | Gained | Unseated | Net | % of total | % | No. | Net % | |||||||
| Conservative | 41 | 23 | 2 | 7 | 48.9% | 39.7% | 20,674 | ||||||||
| Labour | 39 | 19 | 4 | 1 | 42.6% | 39.0% | 20,316 | ||||||||
| Independent | 11 | 4 | 3 | 2 | 8.5% | 7.0% | 3,648 | ||||||||
| Liberal Democrats | 17 | 1 | 1 | 0 | 2.1% | 13.1% | 6,832 | ||||||||
| Independent Labour | 1 | 0 | 0 | 0 | 0% | 0.6% | 327 | N/A | |||||||
| Green | 1 | 0 | 0 | 0 | 0% | 0.5% | 259 | N/A | |||||||
Ward results[]
The ward results listed below are based on the changes from the 1987 elections, not taking into account any party defections or by-elections. Sitting councillors are marked with an asterisk (*).
Bathampton[]
| Party | Candidate | Votes | % | ±% | |
|---|---|---|---|---|---|
| Conservative | S. Andrews | 416 | 56.0 | –8.7 | |
| Liberal Democrats | E. Banks | 190 | 25.6 | –9.7 | |
| Labour | D. Taylor | 137 | 18.4 | N/A | |
| Majority | 226 | 30.4 | –1.0 | ||
| Turnout | 55.4 | +3.2 | |||
| Registered electors | 1,342 | ||||
| Conservative hold | Swing | ||||
Batheaston[]
| Party | Candidate | Votes | % | ±% | |
|---|---|---|---|---|---|
| Conservative | W. Cox * | 530 | 46.1 | –5.6 | |
| Conservative | R. Holder | 467 | – | ||
| Liberal Democrats | R. Hidalgo * | 451 | 39.2 | +8.1 | |
| Liberal Democrats | R. Davis | 406 | – | ||
| Labour | G. White | 169 | 14.7 | –2.5 | |
| Labour | J. Hooker | 166 | – | ||
| Turnout | 47.8 | ||||
| Registered electors | 2,293 | ||||
| Conservative hold | Swing | ||||
| Conservative hold | Swing | ||||
Bathford[]
| Party | Candidate | Votes | % | ±% | |
|---|---|---|---|---|---|
| Conservative | K. Akin-Flenley * | 429 | 54.2 | –15.5 | |
| Liberal Democrats | P. Davis | 229 | 29.0 | –1.3 | |
| Independent | J. Kent | 133 | 16.8 | N/A | |
| Majority | 200 | 25.3 | –14.1 | ||
| Turnout | 52.9 | –1.1 | |||
| Registered electors | 1,494 | ||||
| Conservative hold | Swing | ||||
Cameley[]
| Party | Candidate | Votes | % | ±% | |
|---|---|---|---|---|---|
| Conservative | T. Deacon * | 479 | 59.5 | –3.0 | |
| Labour | J. Beckerley-Martin | 326 | 40.5 | +3.0 | |
| Majority | 153 | 19.0 | |||
| Turnout | 45.7 | ||||
| Registered electors | 1,760 | ||||
| Conservative hold | Swing | ||||
Camerton[]
| Party | Candidate | Votes | % | ±% | |
|---|---|---|---|---|---|
| Conservative | L. Bedborough * | 263 | 42.0 | N/A | |
| Liberal Democrats | B. Wilson | 174 | 27.8 | +8.3 | |
| Labour | C. Wyatt | 122 | 19.5 | +1.1 | |
| Independent | B. Stockley | 67 | 10.7 | N/A | |
| Majority | 89 | 14.2 | |||
| Turnout | 55.4 | ||||
| Registered electors | 1,129 | ||||
| Conservative gain from Independent | Swing | ||||
Charlcombe[]
| Party | Candidate | Votes | % | ±% | |
|---|---|---|---|---|---|
| Conservative | R. Bentley * | 190 | 50.8 | –11.2 | |
| Liberal Democrats | W. Dobson-Smythe | 184 | 49.2 | +11.2 | |
| Majority | 6 | 1.6 | |||
| Turnout | 51.9 | ||||
| Registered electors | 721 | ||||
| Conservative hold | Swing | ||||
Chew Magna[]
| Party | Candidate | Votes | % | ±% | |
|---|---|---|---|---|---|
| Independent | B. Symons | 245 | 33.7 | N/A | |
| Independent | N. Reed * | 228 | 31.4 | N/A | |
| Conservative | A. Telling | 207 | 28.5 | N/A | |
| Labour | R. Delaney | 47 | 6.5 | N/A | |
| Majority | 17 | 2.3 | |||
| Turnout | 64.4 | ||||
| Registered electors | 1,129 | ||||
| Independent gain from Conservative | Swing | ||||
Chew Stoke[]
| Party | Candidate | Votes | % | ±% | |
|---|---|---|---|---|---|
| Conservative | R. Powell * | 331 | 72.1 | N/A | |
| Labour | A. Hawkins | 128 | 27.9 | N/A | |
| Majority | 203 | 44.2 | |||
| Turnout | 42.3 | ||||
| Registered electors | 1,086 | ||||
| Conservative hold | Swing | ||||
Clutton[]
| Party | Candidate | Votes | % | ±% | |
|---|---|---|---|---|---|
| Conservative | T. Rees-Mogg | 352 | 54.2 | –6.1 | |
| Labour | M. Whitton | 298 | 45.8 | +6.1 | |
| Majority | 54 | 8.3 | |||
| Turnout | 50.9 | ||||
| Registered electors | 1,276 | ||||
| Conservative hold | Swing | ||||
Compton Dando[]
| Party | Candidate | Votes | % | ±% | |
|---|---|---|---|---|---|
| Conservative | D. Miles * | 307 | 42.8 | N/A | |
| Independent | P. Britten | 225 | 31.3 | N/A | |
| Labour | J. Lingard | 186 | 25.9 | N/A | |
| Majority | 82 | 11.4 | |||
| Turnout | 51.5 | ||||
| Registered electors | 1,394 | ||||
| Conservative hold | Swing | ||||
Farmborough[]
| Party | Candidate | Votes | % | ±% | |
|---|---|---|---|---|---|
| Conservative | S. Davis | 318 | 61.7 | N/A | |
| Labour | S. Britton | 197 | 38.3 | N/A | |
| Majority | 121 | 23.5 | |||
| Turnout | 58.6 | ||||
| Registered electors | 879 | ||||
| Conservative hold | Swing | ||||
Freshford[]
| Party | Candidate | Votes | % | ±% | |
|---|---|---|---|---|---|
| Conservative | B. Cowley * | 309 | 48.4 | –13.8 | |
| Liberal Democrats | J. Davies | 250 | 39.1 | +13.7 | |
| Labour | A. Davies | 80 | 12.5 | +0.1 | |
| Majority | 59 | 9.2 | |||
| Turnout | 51.5 | ||||
| Registered electors | 1,240 | ||||
| Conservative hold | Swing | ||||
Hartprees[]
| Party | Candidate | Votes | % | ±% | |
|---|---|---|---|---|---|
| Conservative | H. Taviner * | 441 | 81.8 | N/A | |
| Labour | E. Titshall | 98 | 18.2 | N/A | |
| Majority | 343 | 63.6 | |||
| Turnout | 45.9 | ||||
| Registered electors | 1,174 | ||||
| Conservative hold | Swing | ||||
High Littleton[]
| Party | Candidate | Votes | % | ±% | |
|---|---|---|---|---|---|
| Independent | J. Hotter * | 342 | 52.1 | N/A | |
| Liberal Democrats | S. Ledbetter | 240 | 36.5 | N/A | |
| Labour | D. Chalk | 75 | 11.4 | N/A | |
| Majority | 102 | 15.5 | |||
| Turnout | 44.6 | ||||
| Registered electors | 1,474 | ||||
| Independent hold | Swing | ||||
Hinton Charterhouse[]
| Party | Candidate | Votes | % | ±% | |
|---|---|---|---|---|---|
| Liberal Democrats | E. Flower | 433 | 61.9 | +19.4 | |
| Conservative | M. Purse | 267 | 38.1 | –7.6 | |
| Majority | 166 | 23.7 | |||
| Turnout | 57.8 | ||||
| Registered electors | 1,174 | ||||
| Liberal Democrats gain from Conservative | Swing | ||||
Keynsham East[]
| Party | Candidate | Votes | % | ±% | |
|---|---|---|---|---|---|
| Conservative | B. Organ * | 1,250 | 44.2 | –7.9 | |
| Conservative | J. Neville-Dove * | 1,194 | – | ||
| Conservative | L. Sell * | 1,171 | – | ||
| Liberal Democrats | G. Roberts | 1,063 | 37.6 | +2.2 | |
| Labour | P. Knight | 515 | 18.2 | +5.7 | |
| Turnout | 64.3 | ||||
| Registered electors | 4,401 | ||||
| Conservative hold | Swing | ||||
| Conservative hold | Swing | ||||
| Conservative hold | Swing | ||||
Keynsham North[]
| Party | Candidate | Votes | % | ±% | |
|---|---|---|---|---|---|
| Independent | T. Evans | 557 | 29.2 | –4.2 | |
| Labour | C. Davis | 520 | 27.3 | +2.1 | |
| Conservative | M. Pope * | 472 | 24.8 | –16.6 | |
| Conservative | T. Skipp | 433 | – | ||
| Liberal Democrats | L. Roberts | 358 | 18.8 | N/A | |
| Turnout | 68.3 | ||||
| Registered electors | 2,794 | ||||
| Independent gain from Conservative | Swing | ||||
| Labour gain from Conservative | Swing | ||||
Keynsham South[]
| Party | Candidate | Votes | % | ±% | |
|---|---|---|---|---|---|
| Labour | S. Bateman * | 842 | 45.2 | +4.8 | |
| Labour | A. Inker | 814 | – | ||
| Labour | M. Zamir | 667 | – | ||
| Conservative | R. Beech * | 650 | 34.9 | +4.4 | |
| Conservative | S. Gill | 585 | – | ||
| Conservative | G. Pountain | 578 | – | ||
| Liberal Democrats | C. Connett | 371 | 19.9 | –9.1 | |
| Turnout | 56.9 | ||||
| Registered electors | 3,277 | ||||
| Labour hold | Swing | ||||
| Labour hold | Swing | ||||
| Labour gain from Conservative | Swing | ||||
Keynsham West[]
| Party | Candidate | Votes | % | ±% | |
|---|---|---|---|---|---|
| Labour | J. Stiddard | 449 | 35.6 | –15.3 | |
| Labour | G. Derrick | 432 | – | ||
| Conservative | E. Bryant * | 430 | 34.1 | –15.0 | |
| Conservative | R. Abram | 423 | – | ||
| Liberal Democrats | A. Crouch | 383 | 30.3 | N/A | |
| Turnout | 55.1 | ||||
| Registered electors | 2,292 | ||||
| Labour gain from Conservative | Swing | ||||
| Labour hold | Swing | ||||
Midsomer Norton North[]
| Party | Candidate | Votes | % | ±% | |
|---|---|---|---|---|---|
| Labour | M. Collins | 799 | 52.3 | +12.5 | |
| Conservative | S. Steel * | 730 | 47.7 | +12.9 | |
| Labour | L. Carruthers | 699 | – | ||
| Conservative | A. Nash | 631 | – | ||
| Turnout | 38.9 | ||||
| Registered electors | 3,672 | ||||
| Labour hold | Swing | ||||
| Conservative hold | Swing | ||||
Midsomer Norton Redfield[]
| Party | Candidate | Votes | % | ±% | |
|---|---|---|---|---|---|
| Labour | B. Perry * | 1,046 | 64.8 | +24.3 | |
| Labour | A. French | 849 | – | ||
| Conservative | W. Carey | 567 | 35.2 | –3.4 | |
| Conservative | S. Green | 564 | – | ||
| Turnout | 47.8 | ||||
| Registered electors | 3,170 | ||||
| Labour hold | Swing | ||||
| Labour gain from Conservative | Swing | ||||
Newton St Loe[]
| Party | Candidate | Votes | % | ±% | |
|---|---|---|---|---|---|
| Conservative | R. Gay * | 361 | 52.4 | N/A | |
| Liberal Democrats | R. Bradbury | 212 | 30.8 | N/A | |
| Labour | V. Burton | 116 | 16.8 | N/A | |
| Majority | 149 | 21.6 | |||
| Turnout | 40.0 | ||||
| Registered electors | 1,722 | ||||
| Conservative hold | Swing | ||||
Paulton[]
| Party | Candidate | Votes | % | ±% | |
|---|---|---|---|---|---|
| Labour | A. Curtis | 850 | 72.2 | +38.9 | |
| Labour | D. Hamblin * | 741 | – | ||
| Labour | J. Hamblin * | 690 | – | ||
| Independent Labour | W. Martin | 327 | 27.8 | N/A | |
| Turnout | 31.7 | ||||
| Registered electors | 3,714 | ||||
| Labour hold | Swing | ||||
| Labour hold | Swing | ||||
| Labour hold | Swing | ||||
Peasedown St John[]
| Party | Candidate | Votes | % | ±% | |
|---|---|---|---|---|---|
| Labour | E. Latchem * | 779 | 72.5 | +25.1 | |
| Labour | E. Derrick | 736 | – | ||
| Conservative | H. Collier | 296 | 27.5 | –11.5 | |
| Conservative | L. Perrott | 246 | – | ||
| Turnout | 35.9 | ||||
| Registered electors | 2,870 | ||||
| Labour hold | Swing | ||||
| Labour hold | Swing | ||||
Publow[]
| Party | Candidate | Votes | % | ±% | |
|---|---|---|---|---|---|
| Conservative | A. Webb * | 616 | 72.3 | N/A | |
| Labour | B. Parish | 236 | 27.7 | N/A | |
| Majority | 380 | 44.6 | |||
| Turnout | 57.2 | ||||
| Registered electors | 1,490 | ||||
| Conservative hold | Swing | ||||
Radstock[]
| Party | Candidate | Votes | % | ±% | |
|---|---|---|---|---|---|
| Labour | P. Gay * | 1,292 | 36.6 | –9.0 | |
| Independent | B. Shearn * | 1,032 | – | ||
| Labour | D. Wyatt | 910 | – | ||
| Liberal Democrats | R. Inchley | 655 | 18.6 | +2.1 | |
| Independent | M. Whittock | 330 | – | ||
| Conservative | A. Curtis | 288 | 8.2 | –4.7 | |
| Conservative | D. Jones | 271 | – | ||
| Conservative | K. Overmont | 269 | – | ||
| Green | M. Boulton | 259 | 7.3 | N/A | |
| Turnout | 57.8 | ||||
| Registered electors | 3,940 | ||||
| Labour hold | Swing | ||||
| Independent gain from Labour | Swing | ||||
| Labour hold | Swing | ||||
Saltford[]
| Party | Candidate | Votes | % | ±% | |
|---|---|---|---|---|---|
| Conservative | G. Wood | 930 | 51.1 | –28.5 | |
| Conservative | M. Horler * | 884 | – | ||
| Liberal Democrats | D. Hounsell | 641 | 35.2 | N/A | |
| Liberal Democrats | M. Davies | 592 | – | ||
| Labour | P. Hogg | 249 | 13.7 | –6.7 | |
| Turnout | 52.7 | ||||
| Registered electors | 3,454 | ||||
| Conservative hold | Swing | ||||
| Conservative hold | Swing | ||||
Stowey Sutton[]
| Party | Candidate | Votes | % | ±% | |
|---|---|---|---|---|---|
| Conservative | V. Pritchard * | 261 | 52.7 | +6.0 | |
| Independent | E. Harvey | 165 | 33.3 | N/A | |
| Labour | C. Stanaway | 69 | 13.9 | N/A | |
| Majority | 96 | 19.4 | |||
| Turnout | 52.6 | ||||
| Registered electors | 941 | ||||
| Conservative gain from Independent | Swing | ||||
Timsbury[]
| Party | Candidate | Votes | % | ±% | |
|---|---|---|---|---|---|
| Conservative | W. Brown | 491 | 42.4 | –8.1 | |
| Labour | J. Carter | 343 | 29.6 | –19.9 | |
| Independent | E. Potter | 324 | 28.0 | N/A | |
| Majority | 148 | 12.8 | |||
| Turnout | 59.5 | ||||
| Registered electors | 1,946 | ||||
| Conservative hold | Swing | ||||
Westfield[]
| Party | Candidate | Votes | % | ±% | |
|---|---|---|---|---|---|
| Labour | W. Reakes * | 1,252 | 61.7 | +11.9 | |
| Labour | C. Jones * | 1,252 | – | ||
| Labour | P. Sas | 1,140 | – | ||
| Conservative | N. Silcox | 777 | 38.3 | +12.1 | |
| Turnout | 38.7 | ||||
| Registered electors | 5,244 | ||||
| Labour hold | Swing | ||||
| Labour hold | Swing | ||||
| Labour hold | Swing | ||||
References[]
Categories:
- 1991 English local elections
- Wansdyke District Council elections
- 1990s in Somerset