2019 Carlow County Council election
| |||||||||||||||||||||||||||||||||||||
All 18 seats to Carlow County Council 10 seats needed for a majority | |||||||||||||||||||||||||||||||||||||
|---|---|---|---|---|---|---|---|---|---|---|---|---|---|---|---|---|---|---|---|---|---|---|---|---|---|---|---|---|---|---|---|---|---|---|---|---|---|
| |||||||||||||||||||||||||||||||||||||
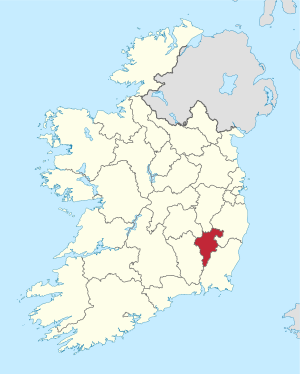 Map showing the area of Carlow County Council | |||||||||||||||||||||||||||||||||||||
| |||||||||||||||||||||||||||||||||||||
A Carlow County Council election was held in County Carlow in Ireland on 24 May 2019 as part of that year's local elections. All 18 councillors were elected for a five-year term of office from three local electoral areas (LEAs) by single transferable vote.
The 2018 boundary review committee recommended significant changes to the LEAs used in the 2014 elections due to terms of references requiring a maximum of seven councillors in each LEA and changes in population revealed in the 2016 census.[1] These changes were made by the Minister of State with special responsibility for Local Government and Electoral Reform John Paul Phelan.[2]
Fianna Fáil gained an additional seat to emerge level with Fine Gael on 6 seats apiece and a higher share of the vote. Sinn Féin had a poor election losing two seats, and Cllr John Cassin was re-elected as an Independent. Labour retained two seats, while Adrienne Wallace, who contested Ireland South for Solidarity–People Before Profit in the European Parliament election held on the same day, gained a seat for the party.
Results by party[]
| Party | Seats | ± | First Pref. votes | FPv% | ±% | |
|---|---|---|---|---|---|---|
| Fianna Fáil | 6 | 7,244 | 33.55 | |||
| Fine Gael | 6 | 6,769 | 31.35 | |||
| Labour | 2 | 1,910 | 8.85 | |||
| Sinn Féin | 1 | 1,817 | 8.41 | |||
| People Before Profit | 1 | 448 | 2.07 | New | ||
| Aontú | 0 | 310 | 1.44 | New | ||
| Renua | 0 | 288 | 1.33 | New | ||
| Independent | 2 | 2,807 | 13.00 | |||
| Totals | 18 | 21,593 | 100.0 | |||
Results by local electoral area[]
Carlow[]
| Party | Candidate | FPv% | Count | |||||||||
|---|---|---|---|---|---|---|---|---|---|---|---|---|
| 1 | 2 | 3 | 4 | 5 | 6 | 7 | 8 | 9 | ||||
| Fianna Fáil | Fintan Phelan[a] | 23.26% | 1,711 | |||||||||
| Fianna Fáil | Andrea Dalton[b] | 14.76% | 1,086 | |||||||||
| Fine Gael | Fergal Browne[a] | 12.10% | 890 | 1,052 | ||||||||
| Fianna Fáil | Ken Murnane[b] | 10.78% | 793 | 994 | ||||||||
| Fine Gael | Tom O'Neill | 7.33% | 539 | 627 | 664 | 693 | 721 | 734 | 747 | 785 | 830 | |
| Independent | John Cassin[a] | 7.16% | 527 | 600 | 630 | 644 | 671 | 688 | 761 | 829 | 902 | |
| People Before Profit | Adrienne Wallace | 6.09% | 448 | 522 | 549 | 586 | 599 | 617 | 701 | 763 | 814 | |
| Fine Gael | Wayne Fennell | 5.87% | 432 | 508 | 541 | 558 | 604 | 613 | 630 | 686 | 745 | |
| Aontú | Mary Hande | 4.21% | 310 | 345 | 360 | 367 | 377 | 385 | 406 | 422 | ||
| Sinn Féin | Ciarán Dooley | 3.28% | 241 | 261 | 267 | 271 | 283 | 288 | ||||
| Independent | Bernard Jennings | 3.18% | 234 | 270 | 280 | 293 | 303 | 307 | 326 | |||
| Labour | Kevin Byrne | 1.97% | 145 | 171 | 179 | 186 | ||||||
| Electorate: 16,425 Valid: 7,356 Spoilt: 121 Quota: 920 Turnout: 7,477 (45.52%) | ||||||||||||
Muinebeag[]
| Party | Candidate | FPv% | Count | |||||
|---|---|---|---|---|---|---|---|---|
| 1 | 2 | 3 | 4 | 5 | ||||
| Fine Gael | Tommy Kinsella[a] | 23.06% | 1,617 | |||||
| Labour | Willie Quinn[a] | 14.02% | 983 | 1,147 | 1,271 | |||
| Sinn Féin | Andy Gladney[a] | 14.48% | 1,015 | 1,054 | 1,147 | 1,175 | ||
| Fine Gael | Michael Doran[a] | 12.32% | 864 | 916 | 944 | 951 | 1,185 | |
| Fianna Fáil | Arthur McDonald[a] | 12.17% | 853 | 893 | 967 | 981 | 1,153 | |
| Fianna Fáil | Josie Daly | 9.63% | 675 | 698 | 798 | 812 | 910 | |
| Fine Gael | Denis Foley[a] | 7.17% | 503 | 595 | 626 | 634 | ||
| Independent | David O'Brien | 3.58% | 251 | 264 | ||||
| Fianna Fáil | Philip Gahan | 3.57% | 250 | 275 | ||||
| Electorate: 13,175 Valid: 7,011 Spoilt: 133 Quota: 1,169 Turnout: 7,144 (54.22%) | ||||||||
Tullow[]
| Party | Candidate | FPv% | Count | ||||||||
|---|---|---|---|---|---|---|---|---|---|---|---|
| 1 | 2 | 3 | 4 | 5 | 6 | 7 | 8 | ||||
| Fianna Fáil | John Pender[a] | 20.01% | 1,446 | ||||||||
| Independent | Charlie Murphy[a] | 19.32% | 1,396 | ||||||||
| Fine Gael | Brian O'Donoghue[a] | 11.87% | 858 | 927 | 942 | 955 | 1,050 | ||||
| Labour | William Paton[a] | 10.82% | 782 | 878 | 904 | 933 | 1,046 | ||||
| Fine Gael | John Murphy[a] | 9.65% | 697 | 740 | 839 | 891 | 1,006 | 1,018 | 1,163 | ||
| Fianna Fáil | John McDonald | 5.95% | 430 | 547 | 610 | 628 | 657 | 660 | 782 | 833 | |
| Sinn Féin | Jim Deane[a] | 7.76% | 561 | 588 | 610 | 639 | 673 | 674 | 783 | 795 | |
| Independent | Billy Nolan | 5.52% | 399 | 417 | 500 | 573 | 596 | 597 | |||
| Fine Gael | Maria Ansbro | 5.11% | 369 | 400 | 414 | 457 | |||||
| Renua | Helena Byrne | 3.99% | 288 | 300 | 341 | ||||||
| Electorate: 14,840 Valid: 7,226 Spoilt: 86 Quota: 1,033 Turnout: 7,312 (49.27%) | |||||||||||
Results by gender[]
| 2019 Carlow County Council election[6][7] Candidates by gender | ||||
|---|---|---|---|---|
| Gender | Number of candidates |
% of candidates |
Elected councillors |
% of councillors |
| Men | 26 | 83.9% | 16 | 88.9% |
| Women | 5 | 16.1% | 2 | 11.1% |
| TOTAL | 31 | 18 | ||
Footnotes[]
Sources[]
- "Local Elections 2019: Results, Transfer of Votes and Statistics" (PDF). Department of Housing, Planning and Local Government (DHPLG). pp. 66–68. Archived from the original (PDF) on 10 June 2020. Retrieved 10 June 2020.
- "Carlow County Council – Local Election candidates". RTÉ. 13 May 2019. Archived from the original on 11 September 2020. Retrieved 15 May 2019.
- "State of the Poll". Carlow County Council. 25 May 2019. Archived from the original on 11 September 2020. Retrieved 19 June 2019.
References[]
- ^ Local Electoral Area Boundary Committee No. 1 (13 June 2018). "Report 2018" (PDF). Government Publications. pp. 20–23, 141. ISBN 978-1-4064-2990-9. Archived from the original (PDF) on 14 November 2018. Retrieved 8 May 2019.
- ^ Phelan, John Paul (19 December 2018). "County of Carlow Local Electoral Areas Order 2018". electronic Irish Statute Book (eISB). Archived from the original on 6 May 2021. Retrieved 8 May 2019.
- ^ DHPLG 2019, p. 66.
- ^ DHPLG 2019, p. 67.
- ^ DHPLG 2019, p. 68.
- ^ "Carlow County Council: People Before Profit claim seat for first time". The Irish Times. Dublin. 27 May 2019 [25 May 2019]. Archived from the original on 10 June 2021.
- ^ DHPLG 2019, p. 247.
- 2019 Irish local elections
- Carlow County Council elections