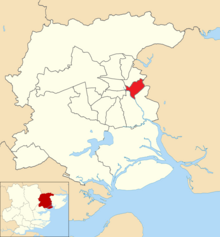
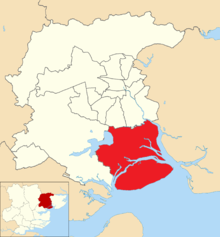
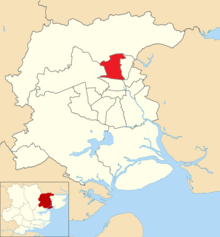
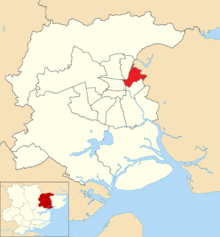
2021 Colchester Borough Council election
| |||||||||||||||||||||||||||||||||||||||||||||||||||||||||||||||||||||||||||
19 seats (out of 51 seats) 26 seats needed for a majority | |||||||||||||||||||||||||||||||||||||||||||||||||||||||||||||||||||||||||||
|---|---|---|---|---|---|---|---|---|---|---|---|---|---|---|---|---|---|---|---|---|---|---|---|---|---|---|---|---|---|---|---|---|---|---|---|---|---|---|---|---|---|---|---|---|---|---|---|---|---|---|---|---|---|---|---|---|---|---|---|---|---|---|---|---|---|---|---|---|---|---|---|---|---|---|---|
| Turnout | 33.9% ( | ||||||||||||||||||||||||||||||||||||||||||||||||||||||||||||||||||||||||||
| |||||||||||||||||||||||||||||||||||||||||||||||||||||||||||||||||||||||||||
 Results map of the Borough Council election | |||||||||||||||||||||||||||||||||||||||||||||||||||||||||||||||||||||||||||
Elections to Colchester Borough Council were held on 6 May 2021. They were originally planned for 7 May 2020,[1] but postponed until 2021 due to the COVID-19 pandemic.[2] Seventeen members of the council (one-third of the whole) were up for election, one from each of the 17 wards. There were also two additional by-elections in Prettygate and Lexden & Braiswick wards, bringing the total number of elected members to nineteen.
Result Summary[]
Candidates by Party[]
Result[]
| 2021 Colchester Borough Council election | ||||||||||
|---|---|---|---|---|---|---|---|---|---|---|
| Party | This election | Full council | This election | |||||||
| Seats | Net | Seats % | Other | Total | Total % | Votes | Votes % | +/− | ||
| Conservative | 9 | 47.7 | 14 | 23 | 45.1 | 23,413 | 44.8 | +9.9 | ||
| Liberal Democrats | 4 | 21.1 | 8 | 12 | 23.5 | 10,264 | 19.7 | -6.9 | ||
| Labour | 4 | 21.1 | 7 | 11 | 21.6 | 11,763 | 22.5 | +4.8 | ||
| Independent | 1 | 5.3 | 2 | 3 | 5.9 | 912 | 1.7 | -4.6 | ||
| Green | 1 | 5.3 | 1 | 2 | 3.9 | 5,592 | 10.7 | -2.9 | ||
| Reform UK | 0 | 0.0 | 0 | 0 | 0.0 | 266 | 0.5 | New | ||
Composition[]
Prior to the election, the composition of the council was:
- Conservative Party: 23
- Liberal Democrats: 13
- Labour Party: 11
- Independent: 3
- Green: 1
After the election, the composition of the council was:
- Conservative Party: 23
- Liberal Democrats: 12
- Labour Party: 11
- Independent: 3
- Green: 2
Ward results[]
The Statement of Nominated Persons was released on 8 April 2021 detailing the persons standing as candidates at the Borough Council election.[3]
Incumbent councillors are marked with an asterisk*
Berechurch[]

| Party | Candidate | Votes | % | ±% | |
|---|---|---|---|---|---|
| Labour | Dave Harris* | 1,604 | 68.4 | +15.2 | |
| Conservative | Chris Piggott | 470 | 20.0 | +4.9 | |
| Liberal Democrats | Mick Spindler | 193 | 8.2 | -16.4 | |
| Green | John Clifton | 78 | 3.3 | -3.8 | |
| Majority | 1,134 | 48.4 | +19.8 | ||
| Turnout | 2,345 | 31.5 | +2.9 | ||
| Labour hold | Swing | ||||
Castle[]

| Party | Candidate | Votes | % | ±% | |
|---|---|---|---|---|---|
| Green | Steph Nissen | 1,136 | 37.8 | -18.1 | |
| Conservative | Fabian Green | 976 | 32.5 | +3.3 | |
| Labour | Richard Hill | 574 | 19.1 | +10.4 | |
| Liberal Democrats | Martin Gillingham | 319 | 10.6 | +4.3 | |
| Majority | 160 | 5.3 | -21.4 | ||
| Turnout | 3,005 | 37.1 | -3.4 | ||
| Green gain from Liberal Democrats | Swing | ||||
Greenstead[]

| Party | Candidate | Votes | % | ±% | |
|---|---|---|---|---|---|
| Labour | Julie Young* | 1,097 | 52.0 | +4.5 | |
| Conservative | Michael Hinton | 600 | 28.4 | +9.4 | |
| Liberal Democrats | Chantelle-Louise Whyborn | 222 | 10.5 | -3.3 | |
| Green | Kemal Cufoglu | 135 | 6.4 | -1.9 | |
| Reform UK | Kevin Blair | 57 | 2.7 | New | |
| Majority | 497 | 23.6 | -5.1 | ||
| Turnout | 2,111 | 19.3 | -1.1 | ||
| Labour hold | Swing | ||||
No Independent candidate as previous (-11.2).
Highwoods[]

| Party | Candidate | Votes | % | ±% | |
|---|---|---|---|---|---|
| Independent | Gerard Oxford* | 780 | 35.0 | -17.6 | |
| Conservative | Stephen Rowe | 664 | 29.8 | +10.5 | |
| Labour | Jocelyn Law | 401 | 18.0 | +6.4 | |
| Liberal Democrats | Kieron Franks | 188 | 8.4 | -0.8 | |
| Green | Clare Burgess | 135 | 6.4 | -0.9 | |
| Reform UK | Diane Baker | 64 | 2.9 | New | |
| Majority | 116 | 5.2 | -28.1 | ||
| Turnout | 2,228 | 30.3 | +0.9 | ||
| Independent hold | Swing | ||||
Lexden & Braiswick[]

| Party | Candidate | Votes | % | ±% | |
|---|---|---|---|---|---|
| Conservative | Dennis Willetts* | 1,949 | 61.0 | ||
| Conservative | Martin Leatherdale | 1,597 | 50.0 | ||
| Liberal Democrats | Sandra Culham | 594 | 18.6 | ||
| Green | Roger Bamforth | 532 | 16.6 | ||
| Labour | Luke Hayes | 396 | 12.4 | ||
| Labour | Kayleigh Rippingale-Shaw | 333 | 10.4 | ||
| Turnout | 3,200 | 43.3 | +4.1 | ||
| Conservative hold | |||||
| Conservative hold | |||||
Marks Tey & Layer[]

| Party | Candidate | Votes | % | ±% | |
|---|---|---|---|---|---|
| Conservative | Kevin Bentley* | 1,880 | 67.4 | +2.8 | |
| Labour | John Spademan | 323 | 11.6 | +4.1 | |
| Green | Amy Sheridan | 231 | 8.3 | -6.0 | |
| Liberal Democrats | Mark Hull | 223 | 8.0 | -5.6 | |
| Independent | Neil Gilbranch | 132 | 4.7 | New | |
| Majority | 1,557 | 55.8 | +5.5 | ||
| Turnout | 2,789 | 34.0 | +1.4 | ||
| Conservative hold | Swing | ||||
Mersea & Pyefleet[]

| Party | Candidate | Votes | % | ±% | |
|---|---|---|---|---|---|
| Conservative | John Jowers* | 2,126 | 69.8 | +39.5 | |
| Green | Peter Banks | 490 | 16.1 | +7.0 | |
| Labour | James Pey | 272 | 8.9 | +1.1 | |
| Liberal Democrats | Susan Waite | 156 | 5.1 | +1.7 | |
| Majority | 1,636 | 53.7 | +52.0 | ||
| Turnout | 3,044 | 37.7 | -4.7 | ||
| Conservative hold | Swing | ||||
No Independent (-28.6, -13.5) or UKIP (-7.3) candidates as previous.
Mile End[]

| Party | Candidate | Votes | % | ±% | |
|---|---|---|---|---|---|
| Liberal Democrats | Martin Goss* | 1,974 | 65.3 | +3.1 | |
| Conservative | Rachel Smith | 583 | 19.3 | -0.6 | |
| Labour | Pauline Bacon | 328 | 10.8 | +2.2 | |
| Green | Amanda Kirke | 139 | 4.6 | -4.7 | |
| Majority | 1,391 | 46.0 | +3.3 | ||
| Turnout | 3,024 | 32.5 | +3.9 | ||
| Liberal Democrats hold | Swing | ||||
New Town & Christ Church[]

| Party | Candidate | Votes | % | ±% | |
|---|---|---|---|---|---|
| Labour | Pam Cox[4] | 1,521 | 43.4 | +11.5 | |
| Conservative | Carla Hales | 887 | 25.3 | +5.9 | |
| Liberal Democrats | Catherine Spindler | 794 | 22.7 | -13.5 | |
| Green | Bob Brannan | 301 | 8.6 | -3.9 | |
| Majority | 634 | 18.0 | — | ||
| Turnout | 3,503 | 35.5 | +2.1 | ||
| Labour gain from Liberal Democrats | Swing | ||||
Old Heath & The Hythe[]

| Party | Candidate | Votes | % | ±% | |
|---|---|---|---|---|---|
| Labour | Michael Lilley* | 1,376 | 53.3 | +1.3 | |
| Conservative | Rowena Cable | 687 | 26.6 | +5.7 | |
| Green | Andrew Canessa | 282 | 10.9 | -3.3 | |
| Liberal Democrats | Soban Asghar | 235 | 9.1 | -3.8 | |
| Majority | 689 | 26.7 | -4.4 | ||
| Turnout | 2,580 | 29.8 | +2.3 | ||
| Labour hold | Swing | ||||
Prettygate[]

| Party | Candidate | Votes | % | ±% | |
|---|---|---|---|---|---|
| Conservative | Sue Lissimore* | 2,136 | 65.7 | ||
| Conservative | Leigh Tate | 1,285 | 39.6 | ||
| Liberal Democrats | John Loxley | 544 | 16.7 | ||
| Labour | Richard Bourne | 513 | 15.8 | ||
| Labour | Victoria Weaver | 388 | 11.9 | ||
| Green | John Burgess | 350 | 10.8 | ||
| Green | Natalie Edgoose | 250 | 7.7 | ||
| Turnout | 3,251 | 40.7 | +4.4 | ||
| Conservative hold | |||||
| Conservative hold | |||||
Rural North[]

| Party | Candidate | Votes | % | ±% | |
|---|---|---|---|---|---|
| Conservative | Darius Laws[4] | 2,207 | 64.5 | +3.1 | |
| Green | Sue Bailey | 406 | 11.9 | -3.7 | |
| Labour | Diane Brown | 367 | 10.7 | +3.0 | |
| Liberal Democrats | William Brown | 359 | 10.5 | -4.8 | |
| Reform UK | Andrew Phillips | 84 | 2.5 | New | |
| Majority | 1,801 | 52.6 | +6.8 | ||
| Turnout | 3,423 | 40.2 | +5.3 | ||
| Conservative hold | Swing | ||||
Shrub End[]

| Party | Candidate | Votes | % | ±% | |
|---|---|---|---|---|---|
| Liberal Democrats | Lyn Barton* | 819 | 37.0 | -4.6 | |
| Conservative | Angela Linghorn-Baker | 783 | 35.3 | +1.5 | |
| Labour | David McCulloch | 416 | 18.8 | +1.5 | |
| Green | Blake Roberts | 136 | 6.1 | -2.2 | |
| Reform UK | Joe Johnson | 61 | 2.8 | New | |
| Majority | 36 | 1.7 | -6.1 | ||
| Turnout | 2,215 | 27.1 | -0.2 | ||
| Liberal Democrats hold | Swing | ||||
St. Anne's & St. John's[]

| Party | Candidate | Votes | % | ±% | |
|---|---|---|---|---|---|
| Liberal Democrats | Mike Hogg*[4] | 1,241 | 42.0 | -2.4 | |
| Conservative | Tom Rowe[6] | 1,214 | 41.1 | +1.0 | |
| Labour | Abigail Chambers | 301 | 10.2 | +2.5 | |
| Green | Pam Nelson | 200 | 6.8 | -1.0 | |
| Majority | 27 | 0.9 | -3.4 | ||
| Turnout | 2,956 | 35.8 | +1.5 | ||
| Liberal Democrats hold | Swing | ||||
Stanway[]

| Party | Candidate | Votes | % | ±% | |
|---|---|---|---|---|---|
| Conservative | Jeremy Hagon | 1,160 | 46.4 | +12.5 | |
| Liberal Democrats | Paul Williams | 987 | 39.5 | -13.2 | |
| Labour | Kevin Brown | 245 | 9.8 | +3.7 | |
| Green | John McArthur | 109 | 4.4 | -2.9 | |
| Majority | 173 | 6.9 | — | ||
| Turnout | 2,501 | 35.9 | +0.9 | ||
| Conservative hold | Swing | ||||
Tiptree[]

| Party | Candidate | Votes | % | ±% | |
|---|---|---|---|---|---|
| Conservative | Roger Mannion | 1,713 | 72.0 | +7.8 | |
| Labour | John Wood | 288 | 12.1 | -2.7 | |
| Green | Clare Smee | 206 | 8.7 | -2.3 | |
| Liberal Democrats | Jennifer Stevens | 171 | 7.2 | -1.5 | |
| Majority | 1,425 | 59.9 | +10.5 | ||
| Turnout | 2,378 | 32.5 | +3.2 | ||
| Conservative hold | Swing | ||||
Wivenhoe[]

| Party | Candidate | Votes | % | ±% | |
|---|---|---|---|---|---|
| Liberal Democrats | Michelle Burrows | 1,245 | 38.4 | -28.9 | |
| Labour | Cyril Liddy* | 1,020 | 31.5 | +13.5 | |
| Conservative | Jodie Clark | 496 | 15.3 | +6.9 | |
| Green | Asa Aldis | 480 | 14.8 | +8.5 | |
| Majority | 225 | 6.9 | — | ||
| Turnout | 3,241 | 41.9 | +2.8 | ||
| Liberal Democrats gain from Labour | Swing | ||||
References[]
- ^ "Information Categories · Colchester Borough Council". www.colchester.gov.uk.
- ^ "Local elections postponed for a year over coronavirus". BBC News. 13 March 2020. Retrieved 13 March 2020.
- ^ Pritchard, Adrian (8 April 2021). "Colchester Borough Council Election of a Borough Councillor" (PDF). Colchester Borough Council. Archived (PDF) from the original on 15 June 2021 – via windows.net.
- ^ a b c "Race for town hall hots up as preparations ramp up for May's elections". Maldon and Burnham Standard.
- ^ "Beverly Davies steps down from Colchester Council". Colchester Gazette.
- ^ "Thomas Rowe Colchester Conservative". Retrieved 13 April 2021.
{{cite web}}: CS1 maint: url-status (link)
- 2021 English local elections
- Colchester Borough Council elections
- 2020s in Essex