Abortion statistics in the United States
Both the Centers for Disease Control and Prevention (CDC)[1][2] and the Guttmacher Institute[3] regularly report abortion statistics in the United States. They use different methodologies, so they report somewhat different abortion rates, but they show similar trends. The CDC relies on voluntary reporting of abortion data from the states and the District of Columbia.[2] The Guttmacher Institute, on the other hand, attempts to contact every abortion provider.[3]
Abortion statistics are commonly presented as the number of abortions, the abortion rate (the number of abortions per 1,000 women ages 15 to 44), and the abortion ratio. The CDC defines the abortion ratio as the number of abortions per 1,000 live births,[2] and the Guttmacher Institute defines it as the number of abortions per 100 pregnancies ending in an abortion or a live birth.[3]
Trends in abortion statistics[]
As of December 2020, the CDC had reported abortion data for the years 1970 through 2018, and the Guttmacher Institute had reported abortion data for the years 1973 through 2017.
The Guttmacher Institute has always found a higher abortion rate than the CDC. For 2017, the Guttmacher Institute reported 13.5 abortions and the CDC reported 11.2 abortions per 1,000 women of childbearing age.
Here are some of the reasons the CDC’s data is incomplete:
- States are not legally required to report abortion data to the CDC. For 2018, California, Maryland, and New Hampshire failed to report abortion data. In particular, the lack of data from California, a populous state with a high abortion rate, reduces the reported overall abortion rate.
- New Jersey and the District of Columbia do not require abortion providers to report abortions to a governmental health agency, so data for these areas may be incomplete.
- Among states that require abortion providers to report abortions, compliance varies. [2]
The Guttmacher Institute’s data is incomplete in a different way: it does not collect abortion data for every year. Currently, it skips every third year and estimates data for missing years by interpolation.[3]
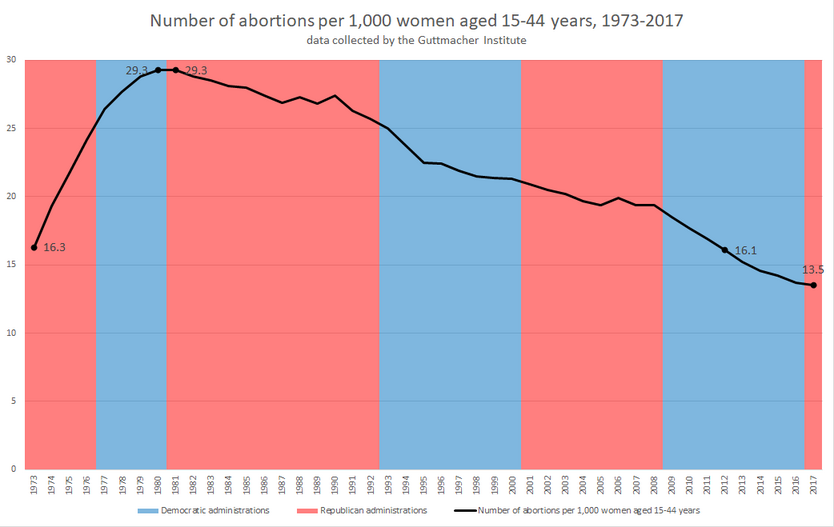
In 1973, the Roe v. Wade Supreme Court decision legalized abortion in all 50 states. From 1973 to 1980, the abortion rate rose almost 80%, peaking at 29.3 abortions per 1,000 women of childbearing age according to the Guttmacher Institute and at 25 abortions per 1,000 women of childbearing age according to the CDC.
From 1981 through 2017, the abortion rate fell approximately in half. It did not fall every single year, but it has not risen two years in a row since 1979 and 1980. The abortion rate fell below the 1973 rate in 2012 and continued to fall through 2017. In 2017, the abortion rate stood at 13.5 abortions per 1,000 women of childbearing age according to the Guttmacher Institute, and at 11.2 abortions per 1,000 women of childbearing age according to the CDC. In 2018, according to the CDC, the abortion rate rose for the first time since 2006, to 11.3 abortions per 1,000 women of childbearing age.
During the 1980s, the population of women of childbearing age grew faster than the abortion rate fell, so the number of abortions performed did not peak until 1990. From 1991 through 2017, the number of abortions generally fell. The largest percentage decrease in the number of abortions occurred in 2013, the year the contraceptive mandate of the Affordable Care Act took effect for most health insurance plans. The Guttmacher Institute reports that 862,320 abortions were performed in 2017.
From 1973 to 1983, the abortion ratio, defined by the Guttmacher Institute as the number of abortions per 100 pregnancies ending in an abortion or a live birth, rose about 60%, peaking at 30.4 in 1983. From 1984 through 2016, the abortion ratio fell about 40%, falling more rapidly in Democratic administrations than in Republican ones. It hit a low of 18.3 in 2016 and rose slightly to 18.4 in 2017. The abortion ratio was slightly lower in 2016 and 2017 than in 1973 because a 40% decrease more than offsets a 60% increase. The CDC defines the abortion ratio differently but reports similar trends. According to the CDC, the abortion ratio peaked in 1984, fell to its lowest point in 2017, and increased slightly in 2018.
Abortion data for the two most recent years reported by the Guttmacher Institute appears below. The abortion rate is the number of abortions per 1,000 women of childbearing age and the abortion ratio is the number of abortions per 100 pregnancies ending in an abortion or a live birth. The number of abortions and the abortion rate fell in 2017, but, for the first time since 2008, the abortion ratio rose.[3]
| year | number of abortions | abortion rate | abortion ratio |
|---|---|---|---|
| 2016 | 874,100 | 13.7 | 18.3 |
| 2017 | 862,300 | 13.5 | 18.4 |
Abortion data for the two most recent years reported by the CDC appears below. The number of abortions is the number reported in 47 states and the District of Columbia, excluding California, Maryland, and New Hampshire. The abortion rate is the number of abortions per 1,000 women of childbearing age and the abortion ratio is the number of abortions per 1,000 live births. All these numbers rose slightly in 2018.[2]
| year | number of abortions | abortion rate | abortion ratio |
|---|---|---|---|
| 2017 | 612,719 | 11.2 | 185 |
| 2018 | 619,591 | 11.3 | 189 |
Independent clinics provide 60% of abortions in the United States while Planned Parenthood provides 35% of abortions in the United States.[4]
CDC surveillance reports[]
The Centers for Disease Control and Prevention began abortion surveillance reports in 1969 to document the number and characteristics of women obtaining legal induced abortions. CDC compiles the information that the states and the District of Columbia collect to produce national estimates. Because New York City and the rest of New York State report separately, there are a total of 52 reporting areas. The CDC numbers, published annually, are derived from actual counts of every abortion reported to state health departments. Reporting to the CDC is not mandatory,[1] Some states choose not to report abortions to the CDC, and different states fail to report in different years. The CDC’s surveillance system compiles information on legal induced abortions only. Because reporting is voluntary, CDC surveillance reports undercount the actual number of abortions in the United States.
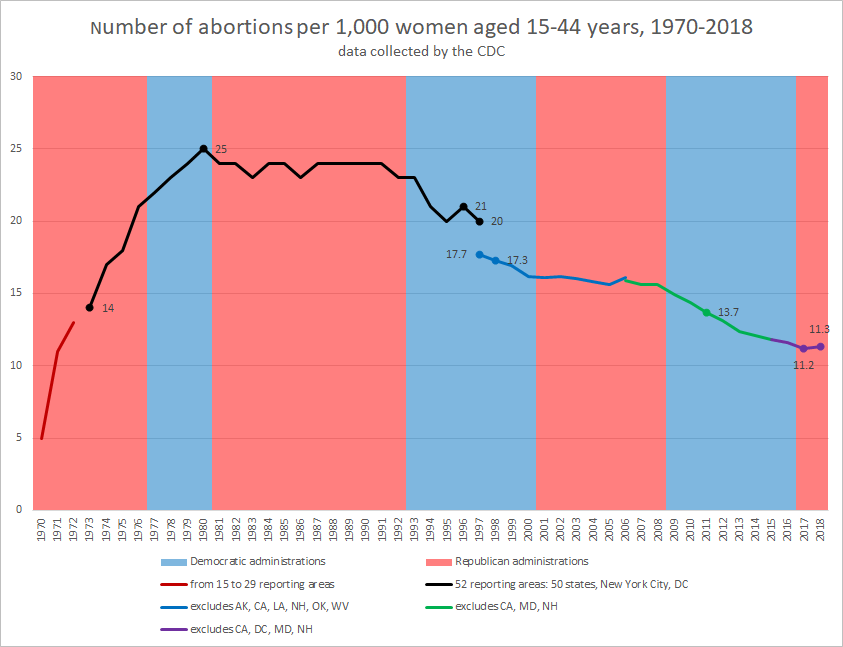
To estimate the percentage change in the abortion rate from one year to the next most accurately, we must compare data from the same group of states in both years. Unfortunately, different states report their data to the CDC in different years. The black, blue, green, and purple pieces of the graph allow us to make accurate apples-to-apples comparisons. Each differently colored piece shows data from a different group of states. For example, the blue piece shows data from 46 reporting areas that reported continuously from 1997 through 2006. To estimate the change in the abortion rate from 1996 to 1998, we use the black part of the graph for 1997 and the blue part for 1998. The black part shows a 4.8% decrease in 1997, and the blue part shows a 2.3% decrease in 1998. The gap between the black and blue sections in 1997 occurs because data from California, a populous state with high abortion rates, was not available after 1997.[citation needed]
The rapid increase in the reported abortion rates from 1970 through 1972, prior to Roe v. Wade, was due in part to improved reporting of the abortions that occurred.[8]

The means in the graph above are geometric means. For example, the mean annual increase during the Carter administration was 4.46%, because the abortion rate rose 19% in the Carter administration, and 104.46%*104.46%*104.46%*104.46%=119%.
Guttmacher Institute estimates[]
Unlike the CDC, the abortion rights research and policy organization Guttmacher Institute does not rely only on state reports but instead periodically surveys abortion providers in all states to estimate the number of abortions in the United States.[3]
For 2017, the Guttmacher Institute reported 862,320 abortions, an abortion rate of 13.5 abortions per 1,000 women aged 15 to 44 years, and 18.4 abortions per 100 pregnancies ending in abortion or live birth.[9][3]

Demographic Statistics[]
Ethnicity[]
Abortion rates tend to be higher among minority women in the U.S. In 2000–2001, due to lower access to health care and contraception, the rates among black and Hispanic women were 49 per 1,000 and 33 per 1,000, respectively, vs. 13 per 1,000 among non-Hispanic white women. Note that this figure includes all women of reproductive age, including women that are not pregnant. In other words, these abortion rates reflect the rate at which U.S. women of reproductive age have an abortion each year.[11]
Religion[]
A study by the National Institute of Health in the United States found that of the Obstetrician-Gynecologists that provide abortions, more identified as Protestant than Catholic.[12] The Guttmacher report of 1987 found Protestants accounted for 41.9% of abortions while Catholics accounted for 31.5%. The Guttmacher report of 1994 found Protestants accounted for 37% of abortions while Catholics accounted for 31%. The Guttmacher report of 2000 found Protestants accounted for 43% of abortions while Catholics accounted for 27%. The Guttmacher report of 2014 found Protestants accounted for 30% of abortions while Catholics accounted for 24%.[13][14][15][16]
References[]
- ^ a b "Abortion | Data and Statistics | Reproductive Health | CDC". www.cdc.gov. 2019-01-16. Retrieved 2019-07-24.
- ^ a b c d e f g Kortsmit, Katherine; Jatlaoui, Tara C.; Mandel, Michele G.; Reeves, Jennifer A.; Oduyebo, Titilope; Petersen, Emily; Whiteman, Maura K. (27 November 2020). "Abortion Surveillance — United States, 2018". MMWR Surveillance Summaries. 69 (7): 1–29. doi:10.15585/mmwr.ss6907a1. PMC 7713711. PMID 33237897. Graphs in this Wikipedia article take CDC data for 2015-2018 from this source.
- ^ a b c d e f g h i Jones, Rachel K.; Witwer, Elizabeth; Jerman, Jenna (September 2019). "Abortion Incidence and Service Availability in the United States, 2017". Perspectives on Sexual and Reproductive Health. 49 (1): 17–27. doi:10.1363/2019.30760. PMC 5487028. PMID 28094905. S2CID 203813573. Retrieved December 12, 2020.
- ^ https://abortioncarenetwork.org/wp-content/uploads/2020/07/6-infographic-poster-7-b.pdf
- ^ a b Gamble, Sonya B.; Strauss, Lilo T.; Parker, Wilda Y.; Cook, Douglas A.; Zane, Suzanne B.; Hamdan, Saeed (28 November 2008). "Abortion surveillance--United States, 2005". Morbidity and Mortality Weekly Report. 57 (13): 1–32. PMID 19037196. Graphs in this Wikipedia article take CDC data for 1970-1997 from this source.
- ^ a b Pazol, Karen; Gamble, Sonya B.; Parker, Wilda Y.; Cook, Douglas A.; Zane, Suzanne B.; Hamdan, Saeed (27 November 2009). "Abortion surveillance - United States, 2006". Morbidity and Mortality Weekly Report. 58 (8): 1–35. PMID 19940837. Graphs in this Wikipedia article take CDC data for 1997-2006 from this source.
- ^ a b Jatlaoui TC, Boutot ME, Mandel MG, Whiteman MK, Ti A, Petersen E, Pazol K (November 2018). "Abortion Surveillance - United States, 2015". MMWR. Surveillance Summaries. 67 (13): 20. doi:10.15585/mmwr.ss6713a1. PMC 6289084. PMID 30462632. Graphs in this Wikipedia article take CDC data for 2006-2015 from this source.
- ^ Centers for Disease Control Prevention (CDC) (4 December 1998). "Abortion surveillance: preliminary analysis--United States, 1996". Morbidity and Mortality Weekly Report. 47 (47): 1025–8, 1035. PMID 9853940.
- ^ Jones, Rachel K.; Witwer, Elizabeth; Jerman, Jenna (18 September 2019). "Abortion Incidence and Service Availability in the United States, 2017". Perspectives on Sexual and Reproductive Health. 49 (1): 17–27. doi:10.1363/2019.30760. PMC 5487028. PMID 28094905. S2CID 203813573.
- ^ a b Jones, Rachel K.; Kooistra, Kathryn (March 2011). "Abortion Incidence and Access to Services In the United States, 2008". Perspectives on Sexual and Reproductive Health. 43 (1): 41–50. doi:10.1363/4304111. PMID 21388504.
- ^ "Abortion". Archived from the original on 2008-03-11.
- ^ Stulberg, Debra B.; Dude, Annie M.; Dahlquist, Irma; Curlin, Farr A. (September 2011). "Abortion Provision Among Practicing Obstetrician–Gynecologists". Obstetrics and Gynecology. 118 (3): 609–614. doi:10.1097/AOG.0b013e31822ad973. PMC 3170127. PMID 21860290.
- ^ "Bishops dismiss report on abortions by Catholics".
- ^ "Study: Evangelicals, Catholics Resort to Abortion, Too". Chicago Tribune.
- ^ "Abortions: Comparing Catholic and Protestant Women". 27 December 2007.
- ^ "U.S. Abortion Statistics".
Abortion | |||||||||||||
|---|---|---|---|---|---|---|---|---|---|---|---|---|---|
| Main topics |
| ||||||||||||
| Movements |
| ||||||||||||
| Issues |
| ||||||||||||
| By country |
| ||||||||||||
| Law |
| ||||||||||||
| Methods |
| ||||||||||||
| Religion |
| ||||||||||||
| |||||||||||||
- Abortion in the United States
- Medical data sets
- Reproductive rights in the United States