Adur District Council elections
Half of Adur District Council in West Sussex, England is elected every two years. Until 2003, the council was elected by thirds. Since the last boundary changes in 2004, 29 councillors have been elected from 14 wards.[1]
Political control[]
Since the foundation of the council in 1973 political control of the council has been held by the following parties:[2]
| Party in control | Years |
|---|---|
| No overall control | 1973 - 1979 |
| Conservative | 1979 - 1980 |
| SDP-Liberal Alliance | 1980 - 1988 |
| Liberal Democrats | 1988 - 1999 |
| No overall control | 1999 - 2002 |
| Conservative | 2002–present |
Council elections[]
- 1973 Adur District Council election
- 1976 Adur District Council election
- 1979 Adur District Council election (New ward boundaries)[3]
- 1980 Adur District Council election
- 1982 Adur District Council election
- 1983 Adur District Council election
- 1984 Adur District Council election
- 1986 Adur District Council election (District boundary changes took place but the number of seats remained the same)[4]
- 1987 Adur District Council election
- 1988 Adur District Council election
- 1990 Adur District Council election
- (District boundary changes took place but the number of seats remained the same)[5]
- 1998 Adur District Council election
- 1999 Adur District Council election
- 2000 Adur District Council election
- 2002 Adur District Council election
- 2003 Adur District Council election
- 2004 Adur District Council election (New ward boundaries reduced the number of seats by 10)[6][7]
- 2006 Adur District Council election
- 2008 Adur District Council election
- 2010 Adur District Council election
- 2012 Adur District Council election
- 2014 Adur District Council election
- 2016 Adur District Council election
- 2018 Adur District Council election
- 2021 Adur District Council election
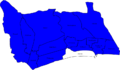
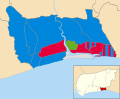
District result maps[]
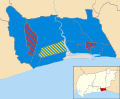
2004 results map

2006 results map
2008 results map

2010 results map
2021 results map


By-election results[]
1997-2001[]
| Party | Candidate | Votes | % | ±% | |
|---|---|---|---|---|---|
| Liberal Democrats | 967 | 37.5 | -2.4 | ||
| Labour | 821 | 31.8 | -14.9 | ||
| Conservative | 790 | 30.6 | +17.2 | ||
| Majority | 146 | 5.7 | |||
| Turnout | 2,578 | ||||
| Liberal Democrats hold | Swing | ||||
| Party | Candidate | Votes | % | ±% | |
|---|---|---|---|---|---|
| Liberal Democrats | 1,066 | 38.3 | -20.5 | ||
| Conservative | 1,062 | 38.2 | +15.5 | ||
| Labour | 652 | 23.5 | +4.9 | ||
| Majority | 4 | 0.1 | |||
| Turnout | 2,780 | ||||
| Liberal Democrats hold | Swing | ||||
| Party | Candidate | Votes | % | ±% | |
|---|---|---|---|---|---|
| Conservative | 1,192 | 39.3 | +7.6 | ||
| Liberal Democrats | 924 | 30.5 | -7.2 | ||
| Labour | 916 | 30.2 | -0.4 | ||
| Majority | 268 | 8.8 | |||
| Turnout | 3,032 | ||||
| Conservative gain from Liberal Democrats | Swing | ||||
| Party | Candidate | Votes | % | ±% | |
|---|---|---|---|---|---|
| Conservative | 425 | 35.6 | -4.5 | ||
| Liberal Democrats | 423 | 35.4 | -10.1 | ||
| Labour | 346 | 29.0 | +14.7 | ||
| Majority | 2 | 0.2 | |||
| Turnout | 1,194 | ||||
| Conservative gain from Liberal Democrats | Swing | ||||
| Party | Candidate | Votes | % | ±% | |
|---|---|---|---|---|---|
| Conservative | 738 | 50.3 | +10.4 | ||
| Labour | 589 | 40.2 | -4.7 | ||
| Liberal Democrats | 139 | 9.5 | -5.7 | ||
| Majority | 149 | 10.1 | |||
| Turnout | 1,466 | 34.6 | |||
| Conservative gain from Labour | Swing | ||||
2001-2005[]
| Party | Candidate | Votes | % | ±% | |
|---|---|---|---|---|---|
| Conservative | Angela Mills | 886 | 41.9 | +3.1 | |
| Liberal Democrats | Shirely Rance | 802 | 38.0 | -10.9 | |
| Labour | Ronald Horne | 425 | 21.1 | -7.8 | |
| Majority | 84 | 3.9 | |||
| Turnout | 2,113 | 64.0 | |||
| Conservative gain from Liberal Democrats | Swing | ||||
| Party | Candidate | Votes | % | ±% | |
|---|---|---|---|---|---|
| Conservative | Andrew McGregor | 761 | 40.0 | -1.5 | |
| Liberal Democrats | Barrie Marler | 617 | 32.4 | +2.7 | |
| Labour | Jeanette White | 525 | 27.6 | -1.2 | |
| Majority | 144 | 7.6 | |||
| Turnout | 1,903 | 60.7 | |||
| Conservative gain from Liberal Democrats | Swing | ||||
| Party | Candidate | Votes | % | ±% | |
|---|---|---|---|---|---|
| Conservative | Iris Hayward | 895 | 38.9 | -0.6 | |
| Liberal Democrats | Anthony Stuart | 720 | 31.3 | -1.3 | |
| Labour | Teana Ashley | 686 | 29.8 | +2.0 | |
| Majority | 175 | 7.6 | |||
| Turnout | 2,301 | 61.1 | |||
| Conservative gain from Labour | Swing | ||||
| Party | Candidate | Votes | % | ±% | |
|---|---|---|---|---|---|
| Conservative | Sara Hall | 368 | 50.5 | -5.9 | |
| Liberal Democrats | Roy Gibson | 213 | 29.2 | +29.2 | |
| Labour | Ann Bridges | 148 | 20.3 | -12.4 | |
| Majority | 155 | 21.3 | |||
| Turnout | 729 | 18.8 | |||
| Conservative hold | Swing | ||||
2005-2009[]
| Party | Candidate | Votes | % | ±% | |
|---|---|---|---|---|---|
| Independent | Keith Fayers-Morrisey | 1,190 | 62.3 | ||
| Liberal Democrats | Doris Martin | 404 | 21.2 | ||
| Labour | Daniel Yates | 316 | 16.5 | ||
| Majority | 786 | 41.1 | |||
| Turnout | 1,910 | 64.0 | |||
| Independent hold | Swing | ||||
| Party | Candidate | Votes | % | ±% | |
|---|---|---|---|---|---|
| Conservative | Angus Dunn | 445 | 59.1 | -0.2 | |
| Liberal Democrats | Clive Connor | 184 | 24.4 | +2.7 | |
| Labour | Barry Thompson | 124 | 16.5 | -2.5 | |
| Majority | 261 | 34.7 | |||
| Turnout | 753 | 22.0 | |||
| Conservative hold | Swing | ||||
2009-2013[]
| Party | Candidate | Votes | % | ±% | |
|---|---|---|---|---|---|
| Conservative | Nicholas Pigott | 288 | 39.6 | -15.6 | |
| Labour | Barry Mear | 282 | 38.8 | +13.6 | |
| UKIP | David Bamber | 91 | 12.5 | +12.5 | |
| Green | Jennie Tindall | 35 | 4.8 | +4.8 | |
| Liberal Democrats | Cyril Cannings | 31 | 4.3 | -15.3 | |
| Majority | 6 | 0.8 | -29.2 | ||
| Turnout | 730 | 21.4 | -9.6 | ||
| Conservative hold | Swing | -14.6 | |||
References[]
- ^ "Your councillors". Adur District Council. Retrieved 2009-10-21.
- ^ "Adur". BBC News Online. 2008-04-19. Retrieved 2009-10-21.
- ^ The District of Adur (Electoral Arrangements) Order 1978
- ^ The Adur, Arun and Worthing (Areas) Order 1985
- ^ legislation.gov.uk - The East Sussex, West Sussex and Kent (County Boundaries) Order 1992. Retrieved on 5 November 2015.
- ^ "Adur". * BBC News Online. Retrieved 2008-05-03.
- ^ legislation.gov.uk - The District of Adur (Electoral Changes) Order 2002. Retrieved on 4 October 2015.
- ^ "Marine ward by-election" (PDF). Adur District Council. Retrieved 26 July 2011.
- ^ "Welsh council victory for Labour". guardian.co.uk. 2006-09-15. Retrieved 2009-10-21.
- ^ "Declaration of Result: Cokeham Ward By Election" (PDF). Adur District Council. 18 October 2011. Retrieved 19 October 2011.
External links[]
| West Sussex CC | |
|---|---|
| Adur | |
| Arun | |
| Chichester | |
| Crawley | |
| Horsham | |
| Mid Sussex | |
| Worthing | |
| |
Categories:
- Adur District Council elections
- Council elections in West Sussex
- Local government in West Sussex
- Adur District
- District council elections in England