Arun District Council elections
Arun District Council in West Sussex, England is elected every four years. Since the last boundary changes in 2015, 54 councillors have been elected from 23 wards.
Political control[]
Since the first election to the council in 1973 the council had been controlled by the Conservative Party, but in 2019 for the first time in 46 years they were no longer the majority party.[1] Later in 2019 the Conservatives became the largest party, and following two by-election victories in May 2021 they retook control of the council under Cllr Shaun Gunner.[2]
| Party in control | Party in minority lead | ||||
|---|---|---|---|---|---|
| Conservative | 1973-2019 | ||||
| No overall control | 2019–present | Liberal Democrat | 2019–2021 | ||
| Conservative | 2021–present | ||||
Council elections[]
- (New ward boundaries)[3]
- (District boundary changes took place but the number of seats remained the same)[4][5]
- 1999 Arun District Council election
- 2003 Arun District Council election (New ward boundaries)[6][7]
- 2007 Arun District Council election
- 2011 Arun District Council election
- 2015 Arun District Council election (New ward boundaries)[8]
Composition of council[]
| Year | Conservative | Liberal Democrats | Labour | UKIP | Independents | Majority | Notes | |||||||
| [9] | 39 | 4 | 4 | 0 | 13 | Con Maj 18 | First elections to Council, formed of 60 seats | |||||||
| 50 | 5 | 1 | 0 | 4 | Con Maj 40 | |||||||||
| 50 | 9 | 1 | 0 | 0 | Con Maj 40 | |||||||||
| 51 | 4 | 1 | 0 | 0 | Con Maj 46 | Boundary changes reduce size of council to 56 | ||||||||
| 51 | 4 | 1 | 0 | 0 | Con Maj 46 | |||||||||
| 36 | 11 | 7 | 0 | 2 | Con Maj 16 | |||||||||
| 29 | 14 | 10 | 0 | 3 | Con Maj 2 | |||||||||
| 1999 | 36 | 10 | 8 | 0 | 2 | Con Maj 16 | ||||||||
| 2003 | 36 | 11 | 8 | 0 | 1 | Con Maj 16 | ||||||||
| 2007 | 42 | 9 | 3 | 0 | 2 | Con Maj 28 | ||||||||
| 2011 | 48 | 4 | 3 | 0 | 1 | Con Maj 40 | ||||||||
| 2015 | 42 | 5 | 1 | 4 | 2 | Con Maj 30 | Boundary changes reduce size of council to 54 | |||||||
| 2019 | 21 | 22 | 1 | 0 | 8 | NOC | ||||||||
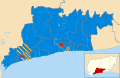
District result maps[]
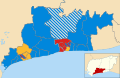
2003 results map

2007 results map
2011 results map


By-election results[]
1995-1999[]
| Party | Candidate | Votes | % | ±% | |
|---|---|---|---|---|---|
| Conservative | 594 | 60.4 | |||
| Liberal Democrats | 374 | 38.6 | |||
| Majority | 220 | 22.8 | |||
| Turnout | 968 | 31.0 | |||
| Conservative hold | Swing | ||||
| Party | Candidate | Votes | % | ±% | |
|---|---|---|---|---|---|
| Conservative | 393 | 40.1 | +9.6 | ||
| Independent | 294 | 30.0 | +8.8 | ||
| Liberal Democrats | 167 | 17.0 | +9.4 | ||
| Independent | 102 | 10.4 | +10.4 | ||
| Labour | 24 | 2.5 | -6.4 | ||
| Majority | 99 | 10.1 | |||
| Turnout | 980 | 27.4 | |||
| Conservative gain from Independent | Swing | ||||
1999-2003[]
| Party | Candidate | Votes | % | ±% | |
|---|---|---|---|---|---|
| Conservative | Florence Harrison | 604 | 64.1 | ||
| Liberal Democrats | Richard James | 208 | 22.1 | ||
| Labour | Moira Rice | 130 | 13.8 | ||
| Majority | 396 | 42.0 | |||
| Turnout | 942 | 30.0 | |||
| Conservative hold | Swing | ||||
| Party | Candidate | Votes | % | ±% | |
|---|---|---|---|---|---|
| Conservative | Andrew Evans | 429 | 38.7 | -2.7 | |
| Labour | Pauline Nash | 388 | 35.0 | +5.6 | |
| Liberal Democrats | Sylvia Olliver | 292 | 26.3 | -3.0 | |
| Majority | 41 | 3.7 | |||
| Turnout | 1,109 | 24.4 | |||
| Conservative hold | Swing | ||||
2003-2007[]
| Party | Candidate | Votes | % | ±% | |
|---|---|---|---|---|---|
| Liberal Democrats | Ian Menzies | 1,213 | 50.7 | +24.3 | |
| Conservative | Richard Taft | 1,179 | 49.3 | -24.3 | |
| Majority | 34 | 1.4 | |||
| Turnout | 2,392 | 60.5 | |||
| Liberal Democrats gain from Conservative | Swing | ||||
| Party | Candidate | Votes | % | ±% | |
|---|---|---|---|---|---|
| Conservative | Paul English | 492 | 58.2 | +9.3 | |
| Liberal Democrats | Michael Harvey | 267 | 31.6 | +31.6 | |
| Labour | Simon Holland | 86 | 10.2 | -1.6 | |
| Majority | 225 | 26.6 | |||
| Turnout | 845 | 22.6 | |||
| Conservative hold | Swing | ||||
| Party | Candidate | Votes | % | ±% | |
|---|---|---|---|---|---|
| Conservative | Paul Bicknell | 846 | 66.8 | +3.4 | |
| Liberal Democrats | Trevor Richards | 421 | 33.2 | -3.4 | |
| Majority | 425 | 33.6 | |||
| Turnout | 1,267 | 22.8 | |||
| Conservative hold | Swing | ||||
| Party | Candidate | Votes | % | ±% | |
|---|---|---|---|---|---|
| Conservative | Florence Harrison | 769 | 44.1 | +1.8 | |
| Liberal Democrats | Andrew Lauretani | 581 | 33.4 | +3.0 | |
| UKIP | 277 | 15.9 | -2.1 | ||
| Labour | 115 | 6.6 | -2.7 | ||
| Majority | 188 | 10.7 | |||
| Turnout | 1,742 | 26.8 | |||
| Conservative hold | Swing | ||||
| Party | Candidate | Votes | % | ±% | |
|---|---|---|---|---|---|
| Conservative | 1,052 | 73.6 | +6.8 | ||
| Liberal Democrats | Trevor Richards | 254 | 17.8 | -15.4 | |
| Labour | 123 | 8.6 | +8.6 | ||
| Majority | 798 | 55.8 | +22.2 | ||
| Turnout | 1,429 | 24.7 | +1.9 | ||
| Conservative hold | Swing | ||||
| Party | Candidate | Votes | % | ±% | |
|---|---|---|---|---|---|
| Conservative | Michael Taft | 699 | 70.5 | +21.2 | |
| Liberal Democrats | Roslyn Kissell | 205 | 20.7 | -30.0 | |
| Labour | 87 | 8.8 | +8.8 | ||
| Majority | 494 | 49.8 | |||
| Turnout | 991 | 24.0 | -36.5 | ||
| Conservative gain from Liberal Democrats | Swing | ||||
2007-2011[]
| Party | Candidate | Votes | % | ±% | |
|---|---|---|---|---|---|
| Conservative | Ema Neno | 620 | 59.8 | -4.8 | |
| Liberal Democrats | David Jones | 212 | 20.4 | -2.4 | |
| BNP | Albert Bodle | 205 | 19.8 | +19.8 | |
| Majority | 408 | 39.4 | |||
| Turnout | 1,037 | 25.4 | |||
| Conservative hold | Swing | -1.2 | |||
| Party | Candidate | Votes | % | ±% | |
|---|---|---|---|---|---|
| Conservative | Gillian Madeley | 630 | 52.1 | -3.1 | |
| Liberal Democrats | Martin Lury | 269 | 22.2 | +10.3 | |
| BNP | Michael Witchell | 165 | 13.6 | +13.6 | |
| UKIP | Joan Phillips | 89 | 7.4 | -4.6 | |
| Labour | Michelle White | 56 | 4.6 | +4.6 | |
| Majority | 361 | 29.9 | N/A | ||
| Turnout | 1,209 | 30.2 | -8.5 | ||
| Conservative hold | Swing | ||||
2011-2015[]
| Party | Candidate | Votes | % | ±% | |
|---|---|---|---|---|---|
| Liberal Democrats | Paul Wells | 383 | 33.6 | +17.9 | |
| Conservative | Bill Smee | 357 | 31.3 | -32.6 | |
| UKIP | Janet Taylor | 339 | 29.7 | +22.6 | |
| Labour | Richard Dawson | 61 | 5.3 | -1.3 | |
| Majority | 26 | 2.3 | |||
| Turnout | 1,141 | 26.8 | -26.2 | ||
| Liberal Democrats gain from Conservative | Swing | 25.3 | |||
References[]
- ^ "Arun". BBC News Online. Retrieved 2010-03-20.
- ^ "Conservatives regain control of Arun District Council after two-year hiatus". Bognor Regis Observer.
- ^ The District of Arun (Electoral Arrangements) Order 1980
- ^ The Adur, Arun and Worthing (Areas) Order 1985
- ^ The Arun and Chichester (Areas) Order 1985
- ^ "Local elections". BBC News Online. Retrieved 2009-09-02.
- ^ legislation.gov.uk - The District of Arun (Electoral Changes) Order 2002. Retrieved on 4 October 2015.
- ^ legislation.gov.uk - The Arun (Electoral Changes) Order 2013. Retrieved on 3 November 2015.
- ^ "Arun 1973-2011" (PDF). The Elections Centre, University of Plymouth. Retrieved 3 August 2016.
- ^ "Rustington South". Arun District Council. Archived from the original on 2011-08-07. Retrieved 2010-03-20.
- ^ "Hotham". Arun District Council. Archived from the original on 2011-08-07. Retrieved 2010-03-20.
- ^ "Yapton Ward of Arun District Council". Arun District Council. Archived from the original on 2011-08-07. Retrieved 2010-03-20.
- ^ "Felpham East By-Election results announced". Arun District Council. Archived from the original on 2011-08-07. Retrieved 2010-03-20.
- ^ "Angmering Ward By-Election results announced". Arun District Council. 2005-11-15. Archived from the original on 2011-08-07. Retrieved 2010-03-20.
- ^ "By-election results announced". Arun District Council. 2006-04-21. Archived from the original on 2011-08-07. Retrieved 2010-03-20.
- ^ Jump up to: a b "By-election results announced in the Arun District". Arun District Council. Archived from the original on 2011-08-07. Retrieved 2010-03-20.
- ^ "BNP defeated in Sussex poll". The Argus. 2008-03-21. Retrieved 2010-03-20.
- ^ "Felpham chooses Tory councillor". Chichester Observer. 2009-04-09. Retrieved 2009-09-02.
- By-election results Archived 2010-03-29 at the Wayback Machine
External links[]
| hide | |
|---|---|
| West Sussex CC | |
| Adur | |
| Arun | |
| Chichester | |
| Crawley | |
| Horsham | |
| Mid Sussex | |
| Worthing | |
| |
Categories:
- Arun District Council elections
- Local government in West Sussex
- Arun District
- Council elections in West Sussex