Ain's 1st constituency
| Ain's 1st constituency | |
|---|---|
| Constituency for the National Assembly | |
 Boundary of Ain's 1st constituency in Ain | |
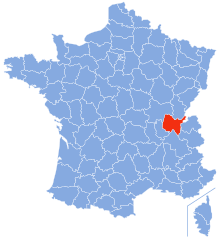 Location of Ain within France | |
| Department | Ain |
| Region | Auvergne-Rhône-Alpes |
| Population | 115,683 (2013)[1] |
| Electorate | 82,673 (2017)[2] |
| Current constituency | |
| Deputy | Xavier Breton |
| Political party | LR |
| Parliamentary group | LR |
Ain's 1st constituency is one of five French legislative constituencies in the department of Ain. It is currently represented by Xavier Breton of The Republicans (LR).
Historic representation[]
| Legislature | Start of mandate | End of mandate | Deputy | Party | |
|---|---|---|---|---|---|
| 1st | 9 December 1958 | 9 October 1962 | SFIO | ||
| 2nd | 6 December 1962 | 2 April 1967 | MRP | ||
| 3rd | 3 April 1967 | 30 May 1968 | CD | ||
| 4th | 11 July 1968 | 1 April 1973 | |||
| 5th | 2 April 1973 | 2 April 1978 | CDP | ||
| 6th | 3 April 1978 | 22 May 1981 | Jacques Boyon | RPR | |
| 7th | 2 July 1981 | 1 April 1986 | PS | ||
| 8th | 2 April 1986 | 14 May 1988 | Proportional representation | ||
| 9th | 23 June 1988 | 1 April 1993 | Jacques Boyon | RPR | |
| 10th | 2 April 1993 | 21 April 1997 | |||
| 11th | 12 June 1997 | 18 June 2002 | PS | ||
| 12th | 19 June 2002 | 19 June 2007 | Jean-Michel Bertrand | UMP | |
| 13th | 20 June 2007 | 19 June 2012 | Xavier Breton | ||
| 14th | 20 June 2012 | 20 June 2017 | |||
| 15th | 21 June 2017 | ongoing | LR | ||
Elections[]
2017[]
| Candidate | Label | First round | Second round | |||
|---|---|---|---|---|---|---|
| Votes | % | Votes | % | |||
| Laurent Mallet | MoDem | 13,534 | 33.89 | 15,114 | 46.25 | |
| Xavier Breton | LR | 10,693 | 26.78 | 17,564 | 53.75 | |
| Jérôme Buisson | FN | 6,174 | 15.46 | |||
| Fabrine Martin-Zemlik | FI | 3,874 | 9.70 | |||
| Florence Blatrix-Contat | PS | 3,687 | 9.23 | |||
| Jacques Fontaine | PCF | 656 | 1.64 | |||
| Laurane Raimondo | ECO | 562 | 1.41 | |||
| Maude Lépagnot | EXG | 293 | 0.73 | |||
| Marie Carlier | DIV | 247 | 0.62 | |||
| Gilbert Bonnot | DIV | 211 | 0.53 | |||
| Votes | 39,931 | 100.00 | 32,678 | 100.00 | ||
| Valid votes | 39,931 | 98.28 | 32,678 | 91.46 | ||
| Blank votes | 545 | 1.34 | 2,245 | 6.28 | ||
| Null votes | 155 | 0.38 | 805 | 2.25 | ||
| Turnout | 40,631 | 49.13 | 35,728 | 43.22 | ||
| Abstentions | 42,063 | 50.87 | 46,945 | 56.78 | ||
| Registered voters | 82,694 | 82,673 | ||||
| Source: Ministry of the Interior | ||||||
2012[]
| Candidate | Label | First round | Second round | |||
|---|---|---|---|---|---|---|
| Votes | % | Votes | % | |||
| PS | 18,312 | 38.92 | 22,743 | 48.41 | ||
| Xavier Breton | UMP | 17,716 | 37.65 | 24,233 | 51.59 | |
| Clément Perrin | FN | 7,290 | 15.49 | |||
| Sébastien Boileau | FG | 1,520 | 3.23 | |||
| Nadia Allouache | EELV | 1,161 | 2.47 | |||
| Grégory Baudouin | DVD | 296 | 0.63 | |||
| Muriel Van der Vossen | ECO | 226 | 0.48 | |||
| Jacques Fléchon | DVD | 220 | 0.47 | |||
| Carole Guénard-Gerbaud | EXG | 171 | 0.36 | |||
| Maude Lépagnot | EXG | 141 | 0.30 | |||
| Votes | 47,053 | 100.00 | 46,976 | 100.00 | ||
| Valid votes | 47,053 | 99.00 | 46,976 | 98.07 | ||
| Blank or null votes | 476 | 1.00 | 924 | 1.93 | ||
| Turnout | 47,529 | 60.11 | 47,900 | 60.58 | ||
| Abstentions | 31,537 | 39.89 | 31,172 | 39.42 | ||
| Registered voters | 79,066 | 79,072 | ||||
| Source: Ministry of the Interior | ||||||
2007[]
| Candidate | Label | First round | Second round | |||
|---|---|---|---|---|---|---|
| Votes | % | Votes | % | |||
| Xavier Breton | UMP | 24,250 | 47.24 | 27,739 | 53.66 | |
| PS | 16,415 | 31.98 | 23,953 | 46.34 | ||
| Marc Pariot | UDF–MoDem | 2,860 | 5.57 | |||
| Marie-Lucienne Catherin | FN | 2,086 | 4.06 | |||
| Monique Duthu | LV | 1,411 | 2.75 | |||
| Carole Guénard-Gerbaud | EXG | 1,162 | 2.26 | |||
| Jacques Fléchon | MPF | 1,078 | 2.10 | |||
| Pierre Aviniere | PCF | 789 | 1.54 | |||
| Bernard Favre | ECO | 530 | 1.03 | |||
| Odile Huret | DIV | 448 | 0.87 | |||
| Éric Lahy | EXG | 300 | 0.58 | |||
| Votes | 51,329 | 100.00 | 51,692 | 100.00 | ||
| Valid votes | 51,329 | 98.57 | 51,692 | 98.09 | ||
| Blank or null votes | 744 | 1.43 | 1,009 | 1.91 | ||
| Turnout | 52,073 | 60.12 | 52,701 | 60.85 | ||
| Abstentions | 34,540 | 39.88 | 33,907 | 39.15 | ||
| Registered voters | 86,613 | 86,608 | ||||
| Source: Ministry of the Interior | ||||||
References[]
- ^ "Populations légales des circonscriptions législatives pour les élections de 2017". Institut national de la statistique et des études économiques. 1 December 2016. Retrieved 31 January 2018.
- ^ "Résultats des élections législatives 2017". Ministère de l'Intérieur. 18 June 2017. Retrieved 31 January 2018.
External links[]
Categories:
- French legislative constituencies of Ain