Morbihan's 6th constituency
constituency | |||
 Constituency in Department | |||
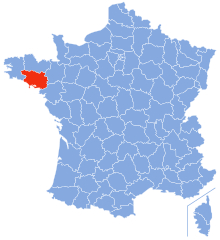 Location of Morbihan in France | |||
| Deputy |
| ||
|---|---|---|---|
| Department | Morbihan | ||
| Cantons | (pre-2015) Cléguérec, Le Faouët, Gourin, Guémené-sur-Scorff, Hennebont, Plouay, Pont-Scorff | ||
The 6th constituency of Morbihan is a French legislative constituency in the Morbihan département. Like the other 576 French constituencies, it elects one MP using the two-round system, with a run-off if no candidate receives over 50% of the vote in the first round.
Historic representation[]
| Election | Member | Party | |
|---|---|---|---|
| 1988 | PS | ||
| 1993 | Jacques Le Nay | UDF | |
| 2002 | UMP | ||
| 2007 | |||
| 2012 | PS | ||
| 2017 | Jean-Michel Jacques | LREM | |
Election results[]
2017[]
| Candidate | Label | First round | Second round | |||
|---|---|---|---|---|---|---|
| Votes | % | Votes | % | |||
| Jean-Michel Jacques | REM | 17,450 | 35.41 | 20,250 | 54.72 | |
| Gwenn Le Nay | UDI | 6,829 | 13.86 | 16,755 | 45.28 | |
| DVG | 5,273 | 10.70 | ||||
| David Guillemet | FI | 4,981 | 10.11 | |||
| Yvan Chichery | FN | 4,333 | 8.79 | |||
| Anne-Maud Goujon | LR | 4,297 | 8.72 | |||
| Christian Derrien | REG | 3,724 | 7.56 | |||
| Joël Le Guellec | DLF | 691 | 1.40 | |||
| Dominique Yvon | REG | 667 | 1.35 | |||
| Kelig Lagree | EXG | 499 | 1.01 | |||
| Henri de Bronac | DVD | 328 | 0.67 | |||
| Erwan Penin | DIV | 213 | 0.43 | |||
| Votes | 49,285 | 100.00 | 37,005 | 100.00 | ||
| Valid votes | 49,285 | 97.62 | 37,005 | 87.68 | ||
| Blank votes | 821 | 1.63 | 3,551 | 8.41 | ||
| Null votes | 382 | 0.76 | 1,650 | 3.91 | ||
| Turnout | 50,488 | 55.66 | 42,206 | 46.53 | ||
| Abstentions | 40,215 | 44.34 | 48,495 | 53.47 | ||
| Registered voters | 90,703 | 90,701 | ||||
| Source: Ministry of the Interior | ||||||
2012[]
| Party | Candidate | Votes | % | ±% | |||
|---|---|---|---|---|---|---|---|
| UMP | Jacques Le Nay | 20,293 | 36.27 | ||||
| PS | Philippe Nogues | 14,229 | 25.43 | ||||
| DVG | Christian Derrien | 7,608 | 13.60 | ||||
| FG | Gérard Perron | 5,024 | 8.98 | ||||
| FN | Ulla Paulat | 4,524 | 8.08 | ||||
| EELV | Claire Duval | 2,153 | 3.85 | ||||
| Others | N/A | 2,126 | |||||
| Turnout | 55,957 | 62.81 | |||||
| 2nd round result | |||||||
| PS | Philippe Nogues | 28,726 | 51.48 | ||||
| UMP | Jacques Le Nay | 27,074 | 48.52 | ||||
| Turnout | 55,800 | 62.65 | |||||
| PS gain from UMP | |||||||
2007[]
| Party | Candidate | Votes | % | ±% | |
|---|---|---|---|---|---|
| UMP | Jacques Le Nay | 30,528 | 54.67 | ||
| PS | Jean-Pierre Bageot | 25,311 | 45.33 | ||
| Turnout | 57,185 | 65.66 | |||
| UMP hold | Swing | ||||
Sources[]
- Official results of French elections from 1998: "Résultats électoraux officiels en France" (in French).
This article about government in France is a stub. You can help Wikipedia by . |
Categories:
- French legislative constituencies of Morbihan
- European government stubs
- France politics stubs