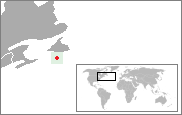
1st constituency of Saint-Pierre-et-Miquelon Deputy Department Saint-Pierre-et-Miquelon Cantons Saint-Pierre, Miquelon-Langlade
The 1st constituency of Saint-Pierre-et-Miquelon is a French legislative constituency on the islands of Saint-Pierre-et-Miquelon . It is the islands' only constituency and also the least populated constituency in France with only 5,997 inhabitants in 2017.[1]
Deputies [ ] Election results [ ] 2017 [ ]
Legislative Election 2017 : Saint-Pierre-et-Miquelon 1st - 2nd round
Party
Candidate
Votes
%
PRG
Annick Girardin
1,886
51.87
LR
Stéphane Lenormand
1,750
48.13
Turnout
3,748
75.35
PRG hold
Swing
Legislative Election 2017 : Saint-Pierre-et-Miquelon 1st - 1st round
Party
Candidate
Votes
%
LR
Stéphane Lenormand
1,209
41.59
PRG
Annick Girardin
1,209
41.59
DVD
Denis Vigneau-Dugue
314
10.80
FI
Robert Langlois
146
5.02
FN
Roger Rode
29
1.00
Turnout
2,957
59.45
2014 by-election [ ] On 9 April 2014, Annick Girardin was appointed Secretary of State for Development and Francophonie in the cabinet of Prime Minister Manuel Valls . Catherine Pen, her suppléant (substitute), took over the seat but resigned on the same day due to health problems. A by-election was called and Girardin was again a candidate. She won on the first round on 29 June 2014. She kept her ministerial post and her substitute Stéphane Claireaux took the seat on 30 July.
By-election, 2014: Saint-Pierre-et-Miquelon 1st
Party
Candidate
Votes
%
PRG
Annick Girardin
1,342
59.91
UMP
François Zimmermann
758
33.84
FN
Roger Rode
87
3.88
PP
Pierre Magnin
53
2.37
Turnout
2,240
PRG hold
Swing
2012 [ ]
Legislative Election 2012 : Saint-Pierre-et-Miquelon 1st
Party
Candidate
Votes
%
PRG
Annick Girardin
1,674
65.52
DVD
Bernard Le Soavec
378
14.79
UMP
François Zimmermann
289
11.31
FN
Roger Rode
116
4.54
DVD
Thierry Abraham
98
3.84
Turnout
2,636
53.51
PRG hold
Swing
2007 [ ]
Legislative Election 2007 : Saint-Pierre-et-Miquelon 1st - 2nd round
Party
Candidate
Votes
%
PRG
Annick Girardin
1,816
51.27
UMP
Gérard Grignon
1,726
48.73
Turnout
3,740
75.97
PRG gain from UMP
Swing
Legislative Election 2007 : Saint-Pierre-et-Miquelon 1st - 1st round
Party
Candidate
Votes
%
UMP
Gérard Grignon
1,098
35.31
PRG
Annick Girardin
966
31.06
PS
Karine Claireaux
463
14.89
DVG
Marc Plantegenest
377
12.12
DVD
Bernard Le Soavec
206
6.62
Turnout
3,233
65.66
2002 [ ]
Legislative Election 2002 : Saint-Pierre-et-Miquelon 1st - 2nd round
Party
Candidate
Votes
%
UMP
Gérard Grignon
2,356
69.17
PS
Karine Claireaux
1,050
30.83
Turnout
3,603
74.72
UMP hold
Swing
Legislative Election 2002 : Saint-Pierre-et-Miquelon 1st - 1st round
Party
Candidate
Votes
%
UMP
Gérard Grignon
1,388
44.04
PS
Karine Claireaux
608
19.29
PRG
Annick Girardin
465
14.75
DVG
André Urtizberea
330
10.47
DVD
Bernard Le Soavec
218
6.92
DL
J. Bertrand Gauvain
107
3.39
DVD
J. Marc Gutelle
22
0.70
MNR
Annick Perrin-Jassy
14
0.44
Turnout
3,233
65.66
1997 [ ]
Legislative Election 1997 : Saint-Pierre-et-Miquelon 1st - 2nd round
Party
Candidate
Votes
%
UDF
Gérard Grignon
1,882
52.2
DVG
Marc Plantegenest
1,723
47.8
Turnout
3,605
UDF hold
Swing
References [ ] Sources [ ] 