Ashfield District Council elections
Ashfield District Council in Nottinghamshire, England is elected every four years. Since the last boundary changes in 2003, 33 councillors have been elected from 15 wards.
Political control[]
Since the foundation of the council in 1973 political control of the council has been held by the following parties:[1]
| Party in control | Years |
|---|---|
| Labour | 1973–2003 |
| No overall control | 2003–2011 |
| Labour | 2011–2018 |
| No overall control | April 2018 - 2019 |
| Ashfield Independents | April 2019 - |
Council elections[]
- (New ward boundaries)[2]
- (District boundary changes took place but the number of seats remained the same)[3]
- (District boundary changes took place but the number of seats remained the same)[4]
- 1999 Ashfield District Council election
- 2003 Ashfield District Council election (New ward boundaries)[5][6]
- 2007 Ashfield District Council election
- 2011 Ashfield District Council election
- 2015 Ashfield District Council election (New ward boundaries)[7]
- 2019 Ashfield District Council election
District result maps[]

2003 results map

2007 results map
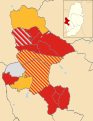
2011 results map


By-election results[]
1999–2003[]
| Party | Candidate | Votes | % | ±% | |
|---|---|---|---|---|---|
| Labour | 445 | 31.8 | -7.9 | ||
| Conservative | 420 | 30.0 | +30.0 | ||
| Independent Labour | 211 | 15.1 | +15.1 | ||
| Liberal Democrats | 205 | 14.7 | +14.7 | ||
| Independent | 118 | 8.4 | -23.1 | ||
| Majority | 25 | 1.8 | |||
| Turnout | 1,399 | 28.1 | |||
| Labour hold | Swing | ||||
| Party | Candidate | Votes | % | ±% | |
|---|---|---|---|---|---|
| Labour | Stephen Mays | 533 | 39.6 | ||
| Conservative | Eugene Di Villa | 438 | 32.5 | ||
| Liberal Democrats | Philip Birkitt | 375 | 27.9 | ||
| Majority | 95 | 7.1 | |||
| Turnout | 1,346 | ||||
| Labour hold | Swing | ||||
| Party | Candidate | Votes | % | ±% | |
|---|---|---|---|---|---|
| Labour | Christopher Davidson | 323 | 35.0 | -15.3 | |
| Independent | 249 | 27.0 | +27.0 | ||
| Independent | 181 | 19.6 | +19.6 | ||
| Conservative | 169 | 18.3 | -31.4 | ||
| Majority | 74 | 8.0 | |||
| Turnout | 922 | 15.9 | |||
| Labour gain from Conservative | Swing | ||||
2003–2007[]
| Party | Candidate | Votes | % | ±% | |
|---|---|---|---|---|---|
| Liberal Democrats | Austin Rathe | 848 | 40.7 | +40.7 | |
| Labour | Ian Briggs | 514 | 24.7 | -18.6 | |
| Independent | Ruth Welton | 389 | 18.7 | +18.7 | |
| BNP | Michael Clarke | 331 | 15.9 | -2.9 | |
| Majority | 334 | 16.0 | |||
| Turnout | 2,082 | ||||
| Liberal Democrats gain from Conservative | Swing | ||||
2007–2011[]
| Party | Candidate | Votes | % | ±% | |
|---|---|---|---|---|---|
| Liberal Democrats | Fiona Asbury | 873 | 37.0 | +37.0 | |
| Labour | Kier Barsby | 560 | 23.7 | -3.7 | |
| BNP | Michael Clarke | 321 | 13.6 | +13.6 | |
| Independent | John Ross | 275 | 11.7 | -38.2 | |
| Conservative | Michael Halls | 257 | 10.9 | -11.8 | |
| Green | Mark Harrison | 72 | 3.1 | +3.1 | |
| Majority | 313 | 13.3 | |||
| Turnout | 2,358 | 26.5 | |||
| Liberal Democrats gain from Independent | Swing | ||||
| Party | Candidate | Votes | % | ±% | |
|---|---|---|---|---|---|
| Liberal Democrats | Margaret Patrick | 996 | 33.8 | -31.9 | |
| Labour | Scott Darrington | 612 | 20.8 | +4.0 | |
| Conservative | Michael Halls | 519 | 17.6 | +7.3 | |
| BNP | Michael Clarke | 380 | 12.9 | +12.9 | |
| Independent | Alfred Thorpe | 299 | 10.2 | +2.9 | |
| Green | Mark Harrison | 140 | 4.8 | +4.8 | |
| Majority | 384 | 13.0 | |||
| Turnout | 2,946 | ||||
| Liberal Democrats hold | Swing | ||||
| Party | Candidate | Votes | % | ±% | |
|---|---|---|---|---|---|
| Liberal Democrats | Kevin Moore | 463 | 32.3 | +18.8 | |
| Labour | Trevor Charles | 392 | 27.3 | +6.8 | |
| Conservative | Robert Copley | 320 | 22.3 | -7.7 | |
| UKIP | Ronald Nixon | 181 | 12.6 | +12.6 | |
| Independent | Diane Butler | 79 | 5.5 | -30.5 | |
| Majority | 71 | 6.0 | |||
| Turnout | 1,435 | 26.2 | |||
| Liberal Democrats gain from Independent | Swing | ||||
| Party | Candidate | Votes | % | ±% | |
|---|---|---|---|---|---|
| Labour | Trevor Locke | 675 | 38.4 | +17.9 | |
| Conservative | Mick Murphy | 437 | 24.9 | -5.1 | |
| Liberal Democrats | Kenneth Cotham | 357 | 20.3 | +6.8 | |
| UKIP | Ronald Nixon | 158 | 9.0 | +9.0 | |
| BNP | Edward Holmes | 131 | 7.5 | +7.5 | |
| Majority | 238 | 13.5 | |||
| Turnout | 1,758 | 32.3 | |||
| Labour gain from Conservative | Swing | ||||
2011–2015[]
2015–2019[]
| Party | Candidate | Votes | % | ±% | |
|---|---|---|---|---|---|
| Ashfield Independents | John Wilmott | 1,329 | 51 | N/A | |
| Labour | Ian Morrison | 629 | 24 | N/A | |
| Conservative | Sheila Clarke | 532 | 20 | N/A | |
| UKIP | Stephen Crosby | 66 | 3 | N/A | |
| Liberal Democrats | James Harvey | 46 | 2 | N/A | |
| Ashfield Independents gain from Conservative party (UK) | Swing | ||||
| Party | Candidate | Votes | % | ±% | |
|---|---|---|---|---|---|
| Ashfield Independents | Matthew Relf | 856 | 82 | N/A | |
| Labour | Kevin Ball | 97 | 9 | N/A | |
| Conservative | Christine Self | 48 | 4.6 | N/A | |
| Democrats and Veterans | Stephen Crosby | 26 | 2.4 | N/A | |
| UKIP | Moira Samson | 13 | 1.2 | N/A | |
| Liberal Democrats | Martin Howes | 5 | 0.4 | N/A | |
| Ashfield Independents gain from Labour | Swing | ||||
References[]
- ^ "England council elections". BBC News Online. Archived from the original on 19 May 2011. Retrieved 19 May 2011.
- ^ legislation.gov.uk – The District of Ashfield (Electoral Arrangements) Order 1976. Retrieved on 19 November 2015.
- ^ legislation.gov.uk – The Nottinghamshire (District Boundaries) Order 1988. Retrieved on 6 November 2015.
- ^ legislation.gov.uk – The Derbyshire and Nottinghamshire (County Boundaries) Order 1992. Retrieved on 5 November 2015.
- ^ "Local elections". BBC News Online. Retrieved 26 September 2009.
- ^ legislation.gov.uk – The District of Ashfield (Electoral Changes) Order 2000. Retrieved on 4 October 2015.
- ^ legislation.gov.uk – The Ashfield (Electoral Changes) Order 2015. Retrieved on 3 November 2015.
- ^ "Ashfield District Council Elections – Underwood Ward". Ashfield District Council. Archived from the original on 30 June 2003. Retrieved 19 May 2011.
- ^ "Boost for Labour in byelection". guardian.co.uk. 19 July 2002. Retrieved 26 September 2009.
- ^ "Lib Dem in poll victory". Nottingham Evening Post. 14 July 2006.
- ^ "Sutton West Ward By-election – Nov 2007". Ashfield District Council. Archived from the original on 13 June 2011. Retrieved 26 September 2009.
- ^ "Declaration of result of poll". Ashfield District Council. Archived from the original on 13 June 2011. Retrieved 26 September 2009.
- ^ "Lib Dems win Ashfield seat". this is nottingham.co.uk. 21 August 2009. Retrieved 26 September 2009.[permanent dead link]
- ^ "Labour "overjoyed" with Hucknall by-election win". this is nottingham.co.uk. 12 February 2010. Archived from the original on 24 March 2010. Retrieved 12 February 2010.
- ^ "Hucknall North By-Election - Ashfield District Council". Ashfield District Council. 1 September 2017. Archived from the original on 12 September 2017. Retrieved 12 September 2017.
- ^ "Sutton Junction and Harlow Wood By-Election - Ashfield District Council". Ashfield District Council. 12 December 2018. Retrieved 12 December 2018.
- By-election results Archived 29 March 2010 at the Wayback Machine
External links[]
Categories:
- Ashfield District Council elections
- Ashfield District
- Council elections in Nottinghamshire
- District council elections in England