Nottinghamshire County Council elections
This article uses bare URLs, which may be threatened by link rot. (May 2021) |
Nottinghamshire County Council in England is elected every four years.
Political control[]
Since the foundation of the council in 1973 political control of the council has been held by the following parties:[1]
| Party in control | Years |
|---|---|
| Labour | 1973 - 1977 |
| Conservative | 1977 - 1981 |
| Labour | 1981 - 2009 |
| Conservative | 2009 - 2013 |
| Labour | 2013 - 2017 |
| Conservative | 2017 - |
Council elections[]
- 1973 Nottinghamshire County Council election
- 1977 Nottinghamshire County Council election
- 1981 Nottinghamshire County Council election
- 1985 Nottinghamshire County Council election
- 1989 Nottinghamshire County Council election
- 1993 Nottinghamshire County Council election
- 1997 Nottinghamshire County Council election
- 2001 Nottinghamshire County Council election
- 2005 Nottinghamshire County Council election (boundary changes increased the number of seats by 4)[2]
- 2009 Nottinghamshire County Council election
- 2013 Nottinghamshire County Council election
- 2017 Nottinghamshire County Council election
- 2021 Nottinghamshire County Council election
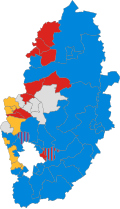
County result maps[]

2021 results map

2017 results map

2013 results map
2009 results map

2005 results map

2001 results map

1997 results map

1993 results map

1989 results map

1985 results map

1981 results map


By-election results[]
1997-2001[]
| Party | Candidate | Votes | % | ±% | |
|---|---|---|---|---|---|
| Conservative | 835 | 61.6 | +20.1 | ||
| Labour | 457 | 33.7 | -16.1 | ||
| Liberal Democrats | 64 | 4.7 | -4.0 | ||
| Majority | 378 | 27.9 | |||
| Turnout | 1,356 | ||||
| Conservative gain from Labour | Swing | ||||
| Party | Candidate | Votes | % | ±% | |
|---|---|---|---|---|---|
| Labour | 746 | 71.3 | |||
| Conservative | 301 | 28.7 | |||
| Majority | 445 | 42.6 | |||
| Turnout | 1,047 | 14.8 | |||
| Labour hold | Swing | ||||
2001-2005[]
| Party | Candidate | Votes | % | ±% | |
|---|---|---|---|---|---|
| Conservative | 1,895 | 65.2 | +17.3 | ||
| Liberal Democrats | 813 | 28.0 | +0.6 | ||
| Labour | 197 | 6.8 | +0.0 | ||
| Majority | 1,082 | 37.2 | |||
| Turnout | 2,905 | 25.1 | |||
| Conservative hold | Swing | ||||
| Party | Candidate | Votes | % | ±% | |
|---|---|---|---|---|---|
| Conservative | Richard Jackson | 1,488 | 46.5 | +9.1 | |
| Labour | 1,163 | 36.3 | -6.5 | ||
| Liberal Democrats | 552 | 17.2 | +2.2 | ||
| Majority | 325 | 10.2 | |||
| Turnout | 3,203 | 35.8 | |||
| Conservative gain from Labour | Swing | ||||
2005-2009[]
| Party | Candidate | Votes | % | ±% | |
|---|---|---|---|---|---|
| Labour | Helen Holt | 1,228 | 38.0 | +3.5 | |
| Conservative | Ken Rees | 628 | 19.4 | +1.0 | |
| Independent | Syd Owen | 620 | 19.2 | +2.0 | |
| Liberal Democrats | Phillip Smith | 544 | 16.8 | -0.3 | |
| Green | Paul Frost | 214 | 6.6 | -2.2 | |
| Majority | 600 | 18.6 | |||
| Turnout | 3,234 | 17.5 | |||
| Labour hold | Swing | ||||
| Party | Candidate | Votes | % | ±% | |
|---|---|---|---|---|---|
| Conservative | Michael Murphy | 1,597 | 32.5 | +0.3 | |
| Labour | John Wilmott | 1,554 | 31.6 | -18.2 | |
| Liberal Democrats | Harry Toseland | 1,007 | 20.5 | +20.5 | |
| UKIP | Peter Foulkes | 413 | 8.4 | +8.4 | |
| Green | Mark Harrison | 350 | 7.1 | -4.5 | |
| Majority | 43 | 0.9 | |||
| Turnout | 4,921 | 21.2 | |||
| Conservative gain from Labour | Swing | ||||
| Party | Candidate | Votes | % | ±% | |
|---|---|---|---|---|---|
| Liberal Democrats | Jason Zadrozny | 1,979 | 73.1 | +59.2 | |
| Labour | David Parker | 435 | 16.1 | -28.7 | |
| Conservative | Peter Thorpe | 222 | 8.2 | -15.6 | |
| UKIP | Peter Foulkes | 70 | 2.6 | +2.6 | |
| Majority | 1,544 | 57.0 | |||
| Turnout | 2,706 | 31.6 | |||
| Liberal Democrats gain from Labour | Swing | ||||
| Party | Candidate | Votes | % | ±% | |
|---|---|---|---|---|---|
| Conservative | Stuart Wallace | 517 | 45.2 | -6.4 | |
| Liberal Democrats | Chris Harrison | 322 | 28.1 | -2.3 | |
| Labour | Glenn Bardill | 198 | 17.3 | -0.7 | |
| UKIP | Terry Coleman | 107 | 9.4 | +9.4 | |
| Majority | 195 | 17.1 | |||
| Turnout | 1,144 | 15.6 | |||
| Conservative hold | Swing | ||||
| Party | Candidate | Votes | % | ±% | |
|---|---|---|---|---|---|
| Labour | Chris Winterton | 1,342 | 33.5 | +13.4 | |
| Mansfield Independent Forum | Andrew Tristram | 1,108 | 27.6 | -12.7 | |
| Conservative | Drew Stafford | 774 | 19.3 | -9.2 | |
| UKIP | Nick Bennet | 489 | 12.2 | +12.2 | |
| Liberal Democrats | Danielle Gent | 295 | 7.4 | -3.8 | |
| Majority | 234 | 5.9 | |||
| Turnout | 4,008 | 20.9 | |||
| Labour gain from Independent | Swing | ||||
2012-2016[]
| Party | Candidate | Votes | % | ±% | |
|---|---|---|---|---|---|
| Conservative | John Doddy | 1,958 | 47.7 | +5.9 | |
| Liberal Democrats | David Watts | 1,375 | 33.5 | +20.6 | |
| UKIP | Lee Waters | 682 | 16.6 | +7.0 | |
| Majority | 583 | 14.2 | |||
| Turnout | 4,102 | 25.6 | |||
| Conservative hold | Swing | ||||
| Party | Candidate | Votes | % | ±% | |
|---|---|---|---|---|---|
| Labour | John Peck | 1,557 | 58.0 | +27.8 | |
| Conservative | Daniel Mottishaw | 660 | 24.6 | -9.7 | |
| Nottinghamshire Independents | Jim Gregson | 346 | 12.9 | -22.7 | |
| UKIP | Carole Terzza | 123 | 4.6 | +4.6 | |
| Majority | 897 | 33.4 | |||
| Turnout | 2,686 | 24.52 | |||
| Labour gain from | Swing | ||||
2016-present[]
| Party | Candidate | Votes | % | ±% | |
|---|---|---|---|---|---|
| Conservative | Francis Purdue-Horan | 1,270 | 44.0 | +2.2 | |
| Independent | Tracey Kerry | 1,232 | 42.7 | N/A | |
| Labour | Alan Walker | 382 | 13.2 | -7.0 | |
| Majority | 38 | 1.3 | |||
| Turnout | 2,890 | 28.1 | |||
| Conservative hold | Swing | ||||
References[]
- ^ "Nottinghamshire". BBC News Online. 19 April 2009. Retrieved 2009-09-25.
- ^ "Local election results: Nottinghamshire". BBC News Online. Retrieved 2009-09-25.
- ^ "East Mansfield by-election 2006". Nottinghamshire County Council. Retrieved 2009-09-25.
- ^ "Hucknall by-election 2007". Nottinghamshire County Council. Retrieved 2009-09-25.
- ^ "Sutton-in-Ashfield North By-election 2007". Nottinghamshire County Council. Retrieved 2009-09-25.
- ^ "Newark East by-election result". Nottinghamshire County Council. 2009-09-18. Retrieved 2009-09-25.
- ^ "Mansfield South by-election result". Nottinghamshire County Council. 2010-02-26. Retrieved 2010-02-26.
- ^ http://www.nottinghamshire.gov.uk/media/115100/declaration-of-result-bingham-division.pdf
External links[]
Categories:
- Nottinghamshire County Council elections
- Council elections in the East Midlands
- Council elections in Nottinghamshire
- County council elections in England