Hampshire County Council elections
Hampshire County Council in England is elected every four years. Since the boundary changes in 2005, 78 councillors have been elected from 75 wards, with further boundary changes in 2017.[1][2]
Political control[]
| Party in control | Years |
|---|---|
| No overall control | 1973–1977 |
| Conservative | 1977–1985 |
| No overall control | 1985–1989 |
| Conservative | 1989–1993 |
| No overall control | 1993–1997 |
| Conservative | 1997–present |
Council elections[]
- 2005 Hampshire County Council election (boundary changes increased the number of seats by 2)[3]
- 2009 Hampshire County Council election
- 2013 Hampshire County Council election
- 2017 Hampshire County Council election (boundary changes)
- 2021 Hampshire County Council election
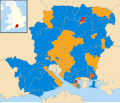
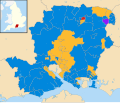
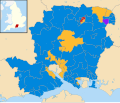
County result maps[]


By-election results[]
1997–2001[]
| Party | Candidate | Votes | % | ±% | |
|---|---|---|---|---|---|
| Liberal Democrats | 1,674 | 48.7 | +6.0 | ||
| Conservative | 1,628 | 47.3 | +1.8 | ||
| Labour | 138 | 4.0 | -7.8 | ||
| Majority | 46 | 1.4 | |||
| Turnout | 3,440 | 22.0 | |||
| Liberal Democrats gain from Conservative | Swing | ||||
| Party | Candidate | Votes | % | ±% | |
|---|---|---|---|---|---|
| Conservative | 742 | 43.2 | +5.9 | ||
| Labour | 564 | 32.8 | -2.4 | ||
| Liberal Democrats | 347 | 20.2 | -5.2 | ||
| Independent | 64 | 3.7 | +3.7 | ||
| Majority | 178 | 10.4 | |||
| Turnout | 1,717 | 16.5 | |||
| Conservative hold | Swing | ||||
| Party | Candidate | Votes | % | ±% | |
|---|---|---|---|---|---|
| Conservative | 741 | 47.3 | +10.9 | ||
| Liberal Democrats | 554 | 35.4 | +5.5 | ||
| Labour | 270 | 17.3 | -12.8 | ||
| Majority | 187 | 11.9 | |||
| Turnout | 1,565 | 10.6 | |||
| Conservative hold | Swing | ||||
| Party | Candidate | Votes | % | ±% | |
|---|---|---|---|---|---|
| Labour | 1,107 | 51.1 | -3.4 | ||
| Conservative | 617 | 28.5 | +2.6 | ||
| Liberal Democrats | 443 | 20.4 | +1.8 | ||
| Majority | 490 | 22.6 | |||
| Turnout | 2,167 | 20.2 | |||
| Conservative hold | Swing | ||||
| Party | Candidate | Votes | % | ±% | |
|---|---|---|---|---|---|
| Conservative | John Stocks | 1,044 | 63.9 | +28.2 | |
| Liberal Democrats | Helen Alley | 373 | 22.8 | +8.0 | |
| Labour | Peter Cotton | 217 | 13.3 | +6.5 | |
| Majority | 671 | 41.1 | |||
| Turnout | 1,634 | 13.8 | |||
| Conservative gain from Independent | Swing | ||||
2001–2005[]
| Party | Candidate | Votes | % | ±% | |
|---|---|---|---|---|---|
| Labour | 1,606 | 68.3 | +11.9 | ||
| Conservative | 639 | 27.2 | -6.2 | ||
| Liberal Democrats | 107 | 4.5 | -5.7 | ||
| Majority | 967 | 41.1 | |||
| Turnout | 2,352 | 21.7 | |||
| Labour hold | Swing | ||||
| Party | Candidate | Votes | % | ±% | |
|---|---|---|---|---|---|
| Liberal Democrats | John Shaw | 1,223 | 38.6 | +11.8 | |
| Conservative | Harry Robinson | 1,126 | 35.5 | +4.2 | |
| Labour | Julie Johnson | 824 | 26.0 | -15.9 | |
| Majority | 98 | 3.1 | |||
| Turnout | 3,174 | 28.5 | |||
| Liberal Democrats gain from Labour | Swing | ||||
| Party | Candidate | Votes | % | ±% | |
|---|---|---|---|---|---|
| Liberal Democrats | Lee Dunsdon | 1,796 | 66.9 | +21.0 | |
| Conservative | Alexis McEvoy | 801 | 29.8 | -7.7 | |
| Labour | Alan Goodfellow | 87 | 3.2 | -13.5 | |
| Majority | 995 | 37.1 | |||
| Turnout | 2,684 | 25.0 | |||
| Liberal Democrats hold | Swing | ||||
| Party | Candidate | Votes | % | ±% | |
|---|---|---|---|---|---|
| Liberal Democrats | Ann Buckley | 978 | 56.6 | +36.2 | |
| Labour | 433 | 25.0 | -31.0 | ||
| Conservative | 285 | 16.5 | -7.0 | ||
| Green | 33 | 1.9 | +1.9 | ||
| Majority | 545 | 31.6 | |||
| Turnout | 1,729 | 17.2 | |||
| Liberal Democrats gain from Labour | Swing | ||||
2009–2013[]
| Party | Candidate | Votes | % | ±% | |
|---|---|---|---|---|---|
| Conservative | Ferris Cowper | 1,588 | 64.4 | ||
| Liberal Democrats | Maureen Comber | 290 | 11.8 | ||
| Labour | John Tough | 258 | 10.5 | ||
| Green | Neville Taylor | 178 | 7.2 | ||
| Justice & Anti-Corruption Party | Don Jerrard | 146 | 5.9 | ||
| Majority | 1,298 | 52.8 | |||
| Turnout | 2,473 | 18.5 | |||
| Conservative hold | Swing | ||||
References[]
- ^ "County Council Elections". Hampshire County Council. Archived from the original on 2009-07-26. Retrieved 2009-09-05.
- ^ "LGBCE | Hampshire County Council | LGBCE Site". www.lgbce.org.uk. Retrieved 2020-04-14.
- ^ "Local election results: Hampshire". * BBC News Online. Retrieved 2009-09-05.
- ^ "By-Election November 2000". Hampshire County Council. Archived from the original on 2007-08-08. Retrieved 2009-09-05.
- ^ "Victory for Lib-Dems". Hampshire Chronicle. 2003-02-10. Retrieved 2009-09-05.
- ^ "Declaration of result of poll". New Forest District Council. Retrieved 2009-09-05.
- ^ "Lib Dems enjoy landslide". guardian.co.uk. 2004-12-03. Retrieved 2009-09-05.
- ^ "2011 By-Election 15/09/2011". Hampshire County Council. Retrieved 16 September 2011.
External links[]
| Hampshire County Council | |
|---|---|
| Basingstoke and Deane Borough Council | |
| East Hampshire District Council | |
| Eastleigh Borough Council | |
| Fareham Borough Council | |
| Gosport Borough Council | |
| Hart District Council | |
| Havant Borough Council | |
| New Forest District Council | |
| Portsmouth City Council | |
| Rushmoor Borough Council | |
| Southampton City Council | |
| Test Valley Borough Council | |
| Winchester City Council | |
| |
|
Categories:
- Hampshire County Council elections
- Council elections in Hampshire
- County council elections in England