Cumbria County Council elections
Cumbria County Council in England is elected every four years. Since the last boundary changes in 2013, 84 councillors have been elected from 84 wards.[1]
Political control[]
Since 1973 political control of the council has been held by the following parties:[2]
| Party in control | Years |
|---|---|
| No overall control | 1973 - 1977 |
| Conservative | 1977 - 1981 |
| Labour | 1981 - 1985 |
| No overall control | 1985 - 1997 |
| Labour | 1997 - 2001 |
| No overall control | 2001–present |
Council elections[]
- 1973 Cumbria County Council election
- 1977 Cumbria County Council election
- 1981 Cumbria County Council election (boundary changes increased the number of seats by 1)[3]
- 1985 Cumbria County Council election
- 1989 Cumbria County Council election
- 1993 Cumbria County Council election
- 1997 Cumbria County Council election
- 2001 Cumbria County Council election (boundary changes reduced the number of seats by 1)[4]
- 2005 Cumbria County Council election
- 2009 Cumbria County Council election
- 2013 Cumbria County Council election
- 2017 Cumbria County Council election
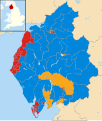
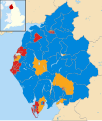
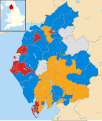
County result maps[]
2001 results map
2005 results map
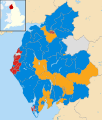
2009 results map
2013 results map
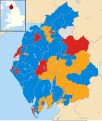
2017 results map


By-election results[]
1993-1997[]
| Party | Candidate | Votes | % | ±% | |
|---|---|---|---|---|---|
| Conservative | 616 | 41.0 | |||
| Liberal Democrats | 510 | 34.0 | |||
| Labour | 317 | 21.0 | |||
| Independent | 51 | 3.4 | |||
| Majority | 106 | 7.0 | |||
| Turnout | 1,494 | 25.0 | |||
| Conservative hold | Swing | ||||
1997-2001[]
| Party | Candidate | Votes | % | ±% | |
|---|---|---|---|---|---|
| Liberal Democrats | 908 | 62.6 | +11.8 | ||
| Conservative | 328 | 22.6 | -5.4 | ||
| Labour | 214 | 14.8 | -6.4 | ||
| Majority | 580 | 40.0 | |||
| Turnout | 1,450 | ||||
| Liberal Democrats hold | Swing | ||||
| Party | Candidate | Votes | % | ±% | |
|---|---|---|---|---|---|
| Conservative | 660 | 82.9 | +18.2 | ||
| Labour | 136 | 17.1 | -18.2 | ||
| Majority | 524 | 65.8 | |||
| Turnout | 796 | 17.9 | |||
| Conservative hold | Swing | ||||
| Party | Candidate | Votes | % | ±% | |
|---|---|---|---|---|---|
| Liberal Democrats | 930 | 55.7 | -0.1 | ||
| Conservative | 558 | 33.4 | -0.3 | ||
| Labour | 182 | 10.9 | +0.4 | ||
| Majority | 372 | 22.3 | |||
| Turnout | 1,670 | ||||
| Liberal Democrats hold | Swing | ||||
| Party | Candidate | Votes | % | ±% | |
|---|---|---|---|---|---|
| Labour | 332 | 45.0 | -31.4 | ||
| Independent | 255 | 34.6 | +34.6 | ||
| Conservative | 151 | 20.5 | -3.1 | ||
| Majority | 77 | 10.4 | |||
| Turnout | 738 | 20.5 | |||
| Labour hold | Swing | ||||
| Party | Candidate | Votes | % | ±% | |
|---|---|---|---|---|---|
| Conservative | 346 | 37.4 | +9.8 | ||
| Labour | 340 | 36.8 | -18.4 | ||
| Liberal Democrats | 238 | 25.8 | +8.2 | ||
| Majority | 6 | 0.6 | |||
| Turnout | 924 | ||||
| Conservative gain from Labour | Swing | ||||
2001-2005[]
| Party | Candidate | Votes | % | ±% | |
|---|---|---|---|---|---|
| Conservative | Isa Henderson | 797 | 41.8 | +6.3 | |
| Independent | Bryan Metz | 787 | 41.2 | +22.0 | |
| Labour | Christopher Bagshaw | 324 | 17.0 | +7.6 | |
| Majority | 10 | 0.6 | |||
| Turnout | 1,908 | 41.0 | |||
| Conservative hold | Swing | ||||
| Party | Candidate | Votes | % | ±% | |
|---|---|---|---|---|---|
| Conservative | 1,229 | 66.2 | +6.0 | ||
| Liberal Democrats | 556 | 30.0 | -9.8 | ||
| Labour | 71 | 3.8 | +3.8 | ||
| Majority | 673 | 36.2 | |||
| Turnout | 1,856 | 36.8 | |||
| Conservative hold | Swing | ||||
| Party | Candidate | Votes | % | ±% | |
|---|---|---|---|---|---|
| Liberal Democrats | 889 | 51.1 | +41.4 | ||
| Labour | 851 | 48.9 | -26.2 | ||
| Majority | 38 | 2.2 | |||
| Turnout | 1,740 | 44.4 | |||
| Liberal Democrats gain from Labour | Swing | ||||
| Party | Candidate | Votes | % | ±% | |
|---|---|---|---|---|---|
| Labour | 645 | 57.5 | -25.5 | ||
| Liberal Democrats | 476 | 42.5 | +42.5 | ||
| Majority | 169 | 15.0 | |||
| Turnout | 1,121 | 22.0 | |||
| Labour hold | Swing | ||||
| Party | Candidate | Votes | % | ±% | |
|---|---|---|---|---|---|
| Independent | 273 | 62.8 | +62.8 | ||
| Labour | 162 | 37.2 | -17.2 | ||
| Majority | 111 | 25.6 | |||
| Turnout | 435 | 13.3 | |||
| Independent gain from Labour | Swing | ||||
2005-2009[]
| Party | Candidate | Votes | % | ±% | |
|---|---|---|---|---|---|
| Labour | Joseph Holliday | 658 | 53.3 | -4.5 | |
| Conservative | John Heathcote | 430 | 34.8 | -7.4 | |
| Independent | John Bracken | 120 | 9.7 | +9.7 | |
| Green | Lynn Bates | 26 | 2.1 | +2.1 | |
| Majority | 228 | 18.5 | |||
| Turnout | 1,234 | 32.3 | |||
| Labour hold | Swing | ||||
| Party | Candidate | Votes | % | ±% | |
|---|---|---|---|---|---|
| Conservative | Lawrence Fisher | 717 | 61.4 | +13.6 | |
| Labour | Alex Faulds | 363 | 31.1 | +2.9 | |
| BNP | David Fisher | 88 | 7.5 | +7.5 | |
| Majority | 354 | 30.3 | |||
| Turnout | 1,168 | 23.3 | |||
| Conservative hold | Swing | ||||
| Party | Candidate | Votes | % | ±% | |
|---|---|---|---|---|---|
| Liberal Democrats | Olwyn Lockley | 653 | 64.0 | +20.2 | |
| Labour | Joseph Hendry | 222 | 21.7 | -18.2 | |
| Conservative | James Bainbridge | 117 | 11.5 | -4.8 | |
| Green | Lynn Bates | 29 | 2.8 | +2.8 | |
| Majority | 431 | 42.3 | |||
| Turnout | 1,021 | 25.2 | |||
| Liberal Democrats hold | Swing | ||||
| Party | Candidate | Votes | % | ±% | |
|---|---|---|---|---|---|
| Liberal Democrats | Patricia Bell | 800 | 59.8 | +14.7 | |
| Conservative | Dawn Dixon | 380 | 28.4 | -2.2 | |
| Independent | Keith Phillips | 123 | 9.2 | +3.6 | |
| Green | Alan Marsden | 34 | 2.5 | +2.5 | |
| Majority | 420 | 31.4 | |||
| Turnout | 1,337 | 29.7 | |||
| Liberal Democrats hold | Swing | ||||
| Party | Candidate | Votes | % | ±% | |
|---|---|---|---|---|---|
| Labour | Wendy Skillicorn | 434 | 41.7 | -24.1 | |
| BNP | Simon Nicholson | 418 | 40.1 | +40.1 | |
| Conservative | Brigid Anne Whiteside | 190 | 18.2 | +1.1 | |
| Majority | 16 | 1.5 | -47.1 | ||
| Turnout | 1,042 | 26.6 | -26.7 | ||
| Labour hold | Swing | ||||
2013-2017[]
| Party | Candidate | Votes | % | ±% | |
|---|---|---|---|---|---|
| Labour | Christine Bowditch | 565 | 45.8 | -20.1 | |
| Conservative | Nigel Christian | 435 | 35.3 | +1.2 | |
| UKIP | John Stayner | 234 | 19.0 | N/A | |
| Majority | |||||
| Turnout | |||||
| Labour hold | Swing | ||||
References[]
- ^ "Welcome to Council and Democracy". Cumbria County Council. Retrieved 2010-04-13.
- ^ "Cumbria". BBC News Online. 19 April 2009. Retrieved 2010-04-13.
- ^ The County of Cumbria (Electoral Arrangements) Order 1981
- ^ "Cumbria". BBC News Online. Retrieved 2010-04-13.
- ^ "County Council By-Election result : Alston and East Fellside". Cumbria County Council. Retrieved 2010-04-13.
- ^ "Ups and downs for Tories". guardian.co.uk. London. 2003-07-25. Retrieved 2010-04-13.
- ^ "23/6/2006 - St. John's by-election result". Cumbria County Council. 2006-06-23. Retrieved 2010-04-13.
- ^ "26/1/2007 - Brampton and Gilsland by-election result". Cumbria County Council. 2007-01-26. Retrieved 2010-04-13.
- ^ "23/2/2007 - Castle by-election result". Cumbria County Council. 2007-02-23. Retrieved 2010-04-13.
- ^ "26/10/2007 - Penrith East by election result". Cumbria County Council. 2007-10-26. Archived from the original on 2011-07-24. Retrieved 2010-04-13.
- ^ "19/12/2008 - Kells and Sandwith by-election results". Cumbria County Council. 2010-04-13. Retrieved 2010-04-13.
External links[]
Categories:
- Cumbria County Council elections
- County council elections in England
- Council elections in Cumbria